
Don't wanna be here? Send us removal request.
Statistics
We looked inside some of the posts by blastdnasquencing-blog and here's what we found interesting.
Average Info
Notes Per Post
0
Likes Per Post
0
Reblog Per Post
0
Reply Per Post
0
Number of Posts By Type
Text
1
Last Seen Tumblr Blogs


Fun Fact
In Q3 of 2020, 31% of US users access the Tumblr app daily.
Text
DNA Sequencing is a BLAST!
Introduction/Initial Hypothesis
This lab introduces the value of DNA sequence analytics to group organisms based on phylogenetics rather than morphological features or arbitrary taxonomy. Since DNA serves as a physical heritable factor that can be traced and sequenced, biologists use it as the most effective tool to classify organisms. As father of modern binomial nomenclature, Carl Linnaeus (1707-1778) set the foundation of classifying organisms based on common similarities and thus established a hierarchy to place any living creature depending on their outward appearance. However, only after Charles Darwin (1809-1882) introduced his theory of evolution in On the Origin of Species did biologists seek to classify species based on their lineage of inheritance, spurring the field of phylogeny. Phenotypic traits originally seemed to be shared between evolutionarily linked species were sometimes instead seen to possess analogous structures, which arose from twin adaptations to combat similar environments. The emergence of DNA analysis, especially nucleotide sequencing also gave biologists a concrete method to determine similar descent. Suddenly the age of Linnaean classification crumbled as previously thought monophyletic taxons (groups with all descendants sharing common ancestry) instead became paraphyletic (missing a descendant) or polyphyletic (containing species with no evolutionary descent). In addition, the discovery of parallel gene transfer in some bacteria has led some to question vertical evolutionary charts in favor of circular ones.

In this particular laboratory activity, I was given a picture of a fossil specimen collected near Lioning Province in China. Based on its morphological features shown in the amber, I was able to make some initial references that would contribute to my hypothesis. For instance, I could spot some very thin sprouting along the backbone of the animal (easily classifying it as a vertebrate, or part of the Chordata phylum) and assumed it was a group of feathers, thus placing this animal perhaps in the Aves category (birds). In addition, I could not discern any temple openings in its skull, thus classifying it as an Anapsid and part of the Reptilia class. Finally, I could make out that this organism did not have any opposable thumbs, disqualifying it as part of the Primate order in Mammalia and noticed that it was a tetrapod. Thus, I tentatively placed it in the Aves class. By comparing four different gene sequencing found in this sample with the BLAST site database, this experimentation would either corroborate or question my hypothesis. My proposed class the organisms would sit within is circled in red on the following cladogram:
Methods/Materials
I utilized my computer and the four ASN files given by the lab handout (the gene sequencing) as well as the Basic Local Alignment Search Tool (BLAST website) in order to obtain DNA sequencing evidence. I entered all four ASN files into the “Saved Strategies” page and both observed the alignment distributions of the top 100 subject sequences and the “Distance tree of results” page, which gave a prediction of where the targeted organism would fall within. Using all eight pages, I formulated a qualitative analysis of the data.

Data
In order to group the data systematically, I first listed the two most similar species based on their DNA sequencing score, which combined the Identification percentage (the proportion of nucleotides that were identical between the two species, the target and the compared species) and the Query cover (the percentage of the identical nucleotides aligned correctly). As independent identifiers, a low Query cover but a high Identification score could indicate a good nucleotide match but with one containing more introns or having insertions and deletions rather than substitutions between the identical groups of nucleotides.
I listed the most similar species with their most identical protein scores with the convention of the numbers in the parentheses being (Query cover, Identification percent).
Gene 1: Gallus gallus (100%/99%) and Coturnix japonica (100%/97%)
Gene 2: Drosophilia melanogaster (92%/99%) and Drosophilia yakuba (95%/97%)
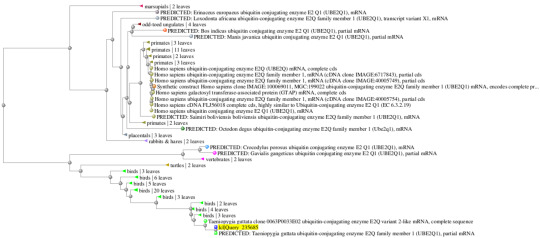
Gene 3: Taeniopygia guttate (95%/100%) and Corvus brachyrhynchos (95%/99%)
Gene 4: Alligator sinesis (100%/99%) and Alligator mississippiensis (91%/83%)
In addition, the following are the predicted phylogenetic tree containing the most immediate evolutionary ancestors of the target organism. Using these trees, I was able to quickly discern which class or family or organisms the compared species were originated.
Analysis/Conclusions
Overall, I believe that my hypothesis that the target organism fell underneath the Aves class was adequately supported. Thus, my conclusive cladogram would be the same as my hypothesis:

There are several reasons for my reasoning. First of all, looking at the data, the closest relative species based on both nucleotide similarity and alignment happened to be included in groups chickens (aves), fruit flies (arthopoda), finches (aves), and alligators/crocodiles (reptilia), it seems fair to group the target organism in aves as two of the four closely related species belonged to that group. Why not arthropoda? Looking at the morphological data, the organism possessed a backbone (thus it is part of the Chordata phylum) and as a basal group, the arthropods are farther than aves than reptilia. It is interesting to note that the Query cover for the arthropod species are the lowest (92% and 95%) of all the other species even though the Identification score is high, alluding that perhaps while the nucleotide bases might have been preserved through evolution, many insertions and deletions between them could have caused wildly different protein to be synthesized.
In addition, the Aves class is less inclusive than the Reptilia group, and especially to be noted is that birds may be thought as a subset of reptiles because they are reptiles’ evolutionary descendants. Although the Reptilia class could be an alternate supported hypothesis, I would put a higher precedent on the Gallus gallus because it has a higher Query cover with a near perfect Identification percent, meaning that of the 99% nucleotides that are identical, they are all aligned the same as well.
Finally through interesting research outside this laboratory, I found a species of dinosaur named Sinosauropteryx that bears close resemblance to this laboratory’s fossil specimen, and even may be the same species. It was the first dinosaur recorded that possessed feathers, and may have been the bridge species between reptiles and birds.

0 notes