
Don't wanna be here? Send us removal request.
Statistics
We looked inside some of the posts by chetaly and here's what we found interesting.
Average Info
Notes Per Post
2
Likes Per Post
2
Reblog Per Post
0
Reply Per Post
0
Time Between Posts
9 days
Number of Posts By Type
Text
4
Last Seen Tumblr Blogs


Fun Fact
BuzzFeed published a report claiming that Tumblr was utilized as a distribution channel for Russian agents to influence American voting habits during the 2016 presidential election in Feb 2018.
Text
Assignment 4
In this week’s assignment, I was supposed to write a program showing the data visualizations of graphical representation. for this, various steps were followed. they are as mentioned below:
STEP 1: the feature distribution done by us in the last week’s assignment will be used and continued further.
python libraries like numpy, pandas, seaborn and matplotlib. Using these libraries at particular point of time wherever required.
Step 2: feature selection and distribution is done on the variables from the codebook.
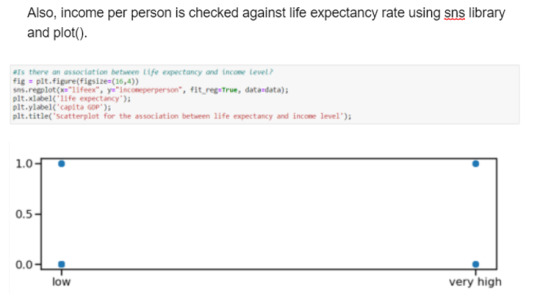
Step 3: In order to create graphical representation of these variables, sns library is used to plot histogram shoeing relation between lifeexpectancy, urban rate and income per person. Also, the correlation is also plotted.
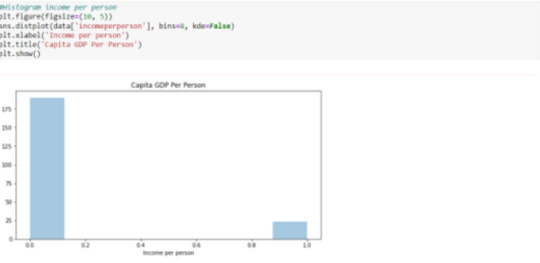

To plot the variables chosen or used by us , code is given below:

0 notes
Text
Assignment 3
lifeSTEP 1: Make and implement data management decisions for the variables you selected.

Step2: Run frequency distributions for your chosen variables and select columns, and possibly rows.

Step 3: Creating variable quartiles and frequency bins for the selected variables.

Step 4: Now we calculate the relation between the variables, such as the relation between high GDP and high income of various countries.

Similarly, we have done for the life expectancy rate and checked the correlation between urban rate and life expectancy rates.


Thus, by doing this data management and visualization, we got to know the relation between our variables .
0 notes
Text
Assignment 2
In the week 2 assignment, we were supposed to perform feature distribution on the variables or features chosen by us from the codebook in earlier assignment. The codebook which I chose was “Gapminder”; this data includes one year of numerous country-level indicators of health, wealth and development and the features taken were: “lifeexpectancy”, “urbanrate”, “incomeperperson”.
Step 1: Write the program code showing the feature distribution so for that we imported python libraries like numpy and pandas. For reading the selected codebook, the function pd.read_csv() is used along with low_memory(). low_memory() is used to reduce the memory used by each columns while reading the csv file. So low_memory= false can increase efficiency when running the program.

Step 2: To display missing data, add the dropna=False option to the value count state.Also, while calculating the frequency count of variables the value_counts() is used in order to return a Series containing counts of unique values. The resulting object will be in descending order so that the first element is the most frequently-occurring element as shown in our output.
The code used for the percentage calculation is as below:

So the output which we received is :

0 notes
Text
Assignment 1
In assignment 1, we have to choose dataset on which we have to work for the whole course. The five code books are given through which we have to select a subcategory and two topics/ variable on which we want to work.
STEP 1: Choose a data set that you would like to work with.
After reviewing five codebooks, I have decide to go with “portion of the GapMinder”. This data includes one year of numerous country-level indicators of health, wealth and development. I want work on health issue is the main reason to choose this handbook. In today’s world, the average life expectancy is increased. But some intoxication cause early death.
STEP 2. Identify a specific topic of interest
As I want to explore the average life expectancy including some intoxication, I would like to go with alcohol consumption and life expectancy. As the alcohol consumption is so injurious to health I would like to aim this issue to how much it’s dangerous. So I’m considering how the alcohol consumption will effect to health and other parameters or which parameters are related to to alcohol consumption.
STEP 3. Prepare a codebook of your own
As, GapMinder includes variables apart from health (wealth, development). So here I’m considering only incomeperperson, alcconsumption and lifeexpectancy as variables.
STEP 4. Identify a second topic that you would like to explore in terms of its association with your original topic.
The second topic which I would like to explore is urbanrate. While looking at the codebook, I thought that there might be possibility that urban rate is connected to alcohol consumption. We can see in urban area, people are less aware of their health and consume more toxic.
STEP 5. Add questions/items/variables documenting this second topic to your personal codebook.
Is there any relation between urban rate and alcohol consumption?
Is there any relation between life expectancy and alcohol consumption?
Is there any relation between Income and alcohol consumption?
STEP 6. Perform a literature review to see what research has been previously done on this topic
For the relation between urbanrate and alcohol consumption, I search so much on google scholar but there is not a single paper on it. When I had search on google itself, I got to know that there is nor direct relation between this two. The relation as in terms of stress and culture. Those can be in city and urban are also. So I don’t have to consider this term(urbanrate).
For the relation between life expectancy and alcohol consumption, I got lots of articles on it so do with income and alcohol consumption. Here are few articles and overview of their content.
Lifetime income patterns and alcohol consumption: Investigating the association between long- and short-term income trajectories and drinking[1]
Overview: In this paper, authors evaluated the relationship between long-term and short-term measures of income. They used the data of US Panel Study on Income Dynamics. They also gave inference like the low income associated with heavy consumption. “Lifetime income patterns may have an indirect association with alcohol use, mediated through current socioeconomic position.”[1]
A Review of Expectancy Theory and Alcohol Consumption[2]
According to their study , “Expectancy manipulations and alcohol consumption: three studies in the laboratory have shown that increasing positive expectancies through word priming increases subsequent consumption and two studies have shown that increasing negative expectancies decreases it”[2]
Alcohol-related mortality by age and sex and its impact on life expectancy: Estimates based on the Finnish death register[3]
In this article, the author studied plausible results on the connection between alcohol-related mortality and age and sex. Here are few statistics, “According to the results, 6% of all deaths were alcohol related. These deaths were responsible for a 2 year loss in life expectancy at age 15 years among men and 0.4 years among women, which explains at least one-fifth of the difference in life expectancies between the sexes. In the age group of 15–49 years, over 40% of all deaths among men and 15% among women were alcohol related. In this age group, over 50% of the mortality difference between the sexes results from alcohol-related deaths”[3]
STEP 7. Based on your literature review, develop a hypothesis about what you believe the association might be between these topics. Be sure to integrate the specific variables you selected into the hypothesis.
After exploring such articles, they are enough to establish the correlation between alcohol consumption and life expectancy and also with Income (apart from these three). After certain observation, following are my hypothesis:
The alcohol consumption is highly correlated with life expectancy.
The social culture , group of people associated with person, stress and Income have direct correlation with alcohol consumption.
Urban rate is not directly connected to alcohol consumption
Final Codebook:

2 notes
·
View notes