
Don't wanna be here? Send us removal request.
Statistics
We looked inside some of the posts by comprehensiveanalysisofglobal and here's what we found interesting.
Average Info
Notes Per Post
1
Likes Per Post
1
Reblog Per Post
0
Reply Per Post
0
Time Between Posts
19 minutes
Number of Posts By Type
Text
2
Last Seen Tumblr Blogs


Fun Fact
The “We are the 99%” Tumblr blog became the slogan for the Occupy Wall Street movement.
Text
Analyzing World Bank Data (2012–2013)
Preliminary Statistical Analyses
The World Bank dataset provides a comprehensive view of various socio-economic indicators across different countries for the years 2012 and 2013. Our preliminary statistical analyses focused on summarizing key variables and identifying trends over these two years.
Summary Statistics:
Count: The dataset includes 22 variables for each year.
Mean: The average values of the variables indicate general trends in economic, health, and social indicators.
Standard Deviation: This measures the variability in the data, highlighting differences between countries.
Minimum and Maximum: These values show the range of the data, from the lowest to the highest recorded values.
Key Findings:
Economic Indicators:
GDP Growth: There was a slight increase in GDP growth from 3.0% in 2012 to 3.1% in 2013.
GDP at Market Prices: The GDP at market prices saw a significant increase, indicating economic growth.
Gross Domestic Savings: Savings as a percentage of GDP remained relatively stable.
Health Indicators:
Health Expenditure: Both per capita and total health expenditure as a percentage of GDP increased slightly, reflecting a growing investment in health.
Mortality Rates: Infant, neonatal, and under-5 mortality rates showed a slight decrease, indicating improvements in healthcare.
Social Indicators:
Internet Users: The number of internet users per 100 people increased, highlighting the growing digital connectivity.
Improved Sanitation and Water Source: Access to improved sanitation facilities and water sources remained high, with slight improvements.
Plots and Graphs
To visually convey the trends and findings from our preliminary analyses, we have created several plots:
Comparison of Variables between 2012 and 2013:
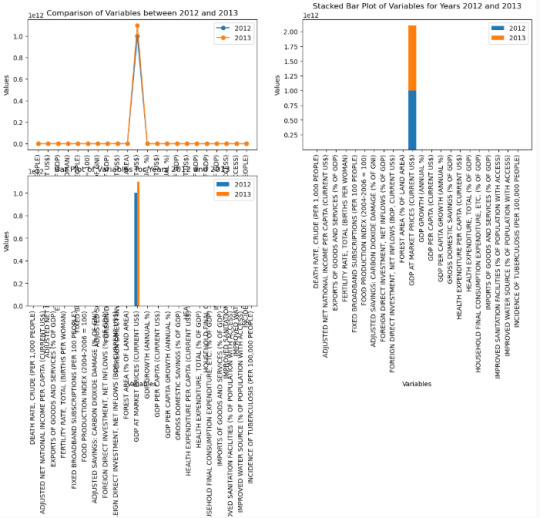
This line plot compares the values of key variables between 2012 and 2013. It shows the general trend of increasing values across most indicators.
Stacked Bar Plot of Variables for Years 2012 and 2013:
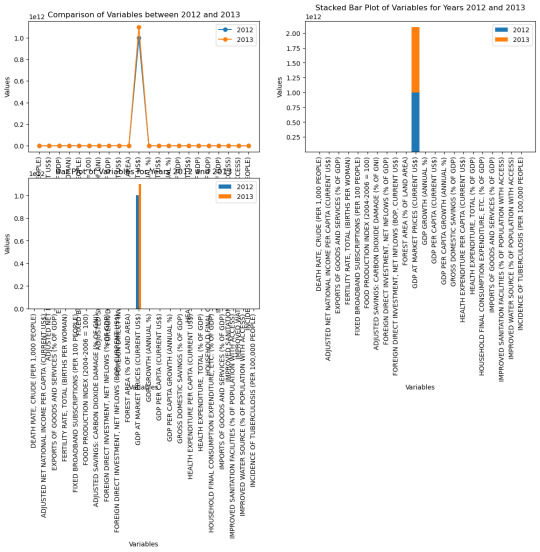
The stacked bar plot provides a clear comparison of the variables for the two years, highlighting the changes in each indicator.
Bar Plot of Variables for Years 2012 and 2013:
This bar plot offers a detailed view of the values for each variable, allowing for easy comparison between the two years.
These visualizations help in understanding the trends and changes in socio-economic indicators over the years. The dataset reveals important insights into global development, economic growth, health improvements, and social progress.
0 notes
Text
Comprehensive Analysis of Global Socio-Economic Indicators: Insights from the World Bank Data
Sample
Population: The sample was drawn from the World Bank dataset, which includes global data on various socio-economic indicators. The population consists of countries worldwide, with data spanning multiple years.
Sample Selection Criteria: The data was filtered to include countries with complete entries for critical variables such as GDP, population, health expenditure, and education expenditure. This ensures a comprehensive analysis of the selected indicators.
Sample Size: The dataset contains 248 observations, representing different countries and regions.
Description of the Sample: The sample includes countries from various geographical regions such as North America, Europe, Asia-Pacific, and Africa. Demographic characteristics include variables like population density, age distribution, and gender ratio.
Measures
Description of Variables:
Economic Indicators: GDP at market prices, GDP growth, GDP per capita, gross domestic savings, adjusted net national income, foreign direct investment, and inflation.
Health Indicators: Health expenditure per capita, mortality rates (infant, neonatal, under-5), life expectancy at birth (female, male, total), incidence of tuberculosis, and out-of-pocket health expenditure.
Education Indicators: Education expenditure, percentage of students in primary education who are female.
Environmental Indicators: Forest area, renewable electricity output, PM2.5 air pollution exposure, adjusted savings for carbon dioxide damage, energy depletion, and natural resources depletion.
Social Indicators: Internet users, mobile cellular subscriptions, improved sanitation facilities, improved water source, labor force participation (female), and proportion of seats held by women in national parliaments.
Management of Variables:
Composite Scores: Variables such as health expenditure and education expenditure may be combined to create a composite score representing overall investment in human capital.
Binning: Quantitative variables like GDP growth and inflation rates can be binned into categories (e.g., low, medium, high) to facilitate categorical analysis.
Normalization: Variables such as population density and GDP per capita may be normalized to ensure comparability across countries with different sizes and economic scales.
Analyses
Statistical Methods:
Descriptive Statistics: To summarize the central tendencies, dispersion, and distribution of the variables.
Correlation Analysis: To identify relationships between different indicators, such as the correlation between health expenditure and life expectancy.
Regression Analysis: To model the impact of various predictors (e.g., GDP, health expenditure) on outcomes like life expectancy and education levels.
Cluster Analysis: To group countries with similar socio-economic profiles and identify patterns in the data.
Data Splitting:
Training and Test Sets: The data will be split into training and test sets to validate the models. Typically, 70% of the data will be used for training, and 30% for testing.
Cross-Validation: K-fold cross-validation will be used to ensure the robustness of the models. This involves dividing the data into k subsets and using each subset as a test set while the remaining k-1 subsets are used for training.
Cross-Validation:
K-Fold Cross-Validation: This method will be employed to assess the performance of the statistical models. It helps in minimizing overfitting and provides a more accurate estimate of model performance.
1 note
·
View note