
Don't wanna be here? Send us removal request.
Statistics
We looked inside some of the posts by d-janney and here's what we found interesting.
Average Info
Notes Per Post
2
Likes Per Post
2
Reblog Per Post
0
Reply Per Post
0
Time Between Posts
6 days
Number of Posts By Type
Text
12
Link
2
Photo
1
Last Seen Tumblr Blogs


Fun Fact
Tumblr was named as a finalist in Lead411’s New York City Hot 125 in Aug 2010.
Text
Assignment 12
Let me start off by saying that the data I am using in my R package is work-related and work this past week has been a nightmare. I did manage to collect fourteen days worth of data and am ready to analyze it--and what is a better way to start doing so than in a Markdown?
My first obstacle: Make at least one nice looking scatterplot for the Markdown. It took me many attempts to ggplot my data how I wanted it to look.
My second obstacle: Getting my data on the Markdown file. I quickly realized that any code I had done in the RStudio console and saved in the global environment was not transferring to my RMarkdown file. I turned to the internet and came across this solution.
Once I got the Markdown to return an HTML file, it was satisfying to see my work look so polished.
Check out my Markdown so far on on RPubs and GitHub.
1 note
·
View note
Text
Assignment 11
This assignment will look at debugging code, specifically this one:

I pasted the code into my RStudio script for reference, then ran it in the console. It got this error:
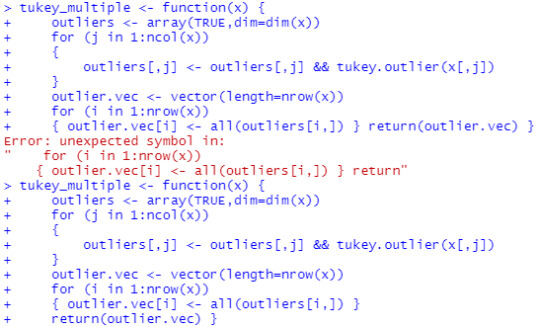
All it took was a new line for the return() to successfully input the function to the global environment. Now that I have tukey_multiple where I want it, I can test the debug(), but first I created an array:

“tukey.outlier” does not exist in my global environment, and does not have any value assigned to it within the function, therefore the tukey_multiple function will not execute successfully.
If I remove code that includes the tukey.outlier function:
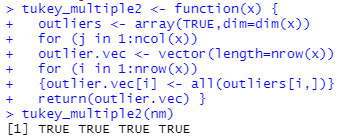
I at least get a return of TRUEs. Based on the code, I got a TRUE for every row in the array. I’m not entirely sure what was supposed to happen. Maybe I could create the tukey.outlier function?
0 notes
Text
Assignment 10
Oh boy, this assignment takes the first step toward my first R package: creating a description.
I want my package to be useful in some way and use original data, so I have started to collect my daily delivery log from work. I am a part-time delivery driver at a restaurant on Friday, Saturday, and Sunday. Sometimes I pick up or cover other shifts. Since I do not collect my tip money (unless it is cash) until my paycheck drops in my bank account every two weeks, I try not pay attention to the tips I make. With this package, I would like to analyze the numbers more closely.
My description file on GitHub.
0 notes
Text
Assignment 9
This assignment will explore visualizations in R. I will look at basic R graphs, and the lattice and ggplot2 packages.
To start, I downloaded a dataset from this website. Because I am grossly interested in true crime lately, I chose “wmurders”:Average female murder rate by decade (per 100,000 standard population). After importing the dataset into RStudio, I executed plot(wmurders) just to see what it looked like and it was undesirable in showing any relationships. The dataset is relatively simple, it has two utilizable columns that list time and value for 55 rows. Here is a glimpse of the data:

Following along the graph examples on this site, I went on and created the various plots, bar charts, histograms, a pie chart, and a boxplot. I used par() for the first time to display the multiple plot graphs. I will use it here to show the variety of plot() graphs:


I had the most fun creating a pie chart. In order to create a more coherent barplot and pie chart, I needed to calculate the average rates by decade (that code can be seen on my GitHub).


The lattice package is interesting in how it can display multiple frames in one go without using par(). I experimented with a few graphs, and I appreciate the output it is capable of. For instance, here is a scatterplot and its code:

I think exploring the lattice package is most valuable with at least three variables to analyze. The 3D aspects look pretty cool.
I am a bit familiar with ggplot2. At the beginning of this course I was keen to follow examples in RStudio. I am able to discern its abilities from simple R graphs (which I once thought were interchangeable), most notably subtitling a graph.

Looking over these R visualizations, I am most drawn to the basics--probably because I am still learning and am quite the amateur--but I can see the appeal of ggplot2′s refined looks and lattice’s strength to compare. As I think about creating my own R package I will keep in mind what these models offer.
View all my codes and data on GitHub
0 notes
Text
Assignment 8
Given the dataset “Assignment 6 Dataset.txt” to work with, this assignment will look at input/output, string manipulation, and the plyr package.
First step, download the dataset from Canvas and import it into RStudio. I imported it by way of File > Import Dataset > From Text (base) and selected the downloaded .txt file. The file may also be imported through the Environment. I renamed the dataset to “Assignment.8.Dataset” upon importing to be consistent with the current assignment number.
Here is what the dataset looks like:

Then, I selected the plyr package in RStudio. I also elected to use dplyr.

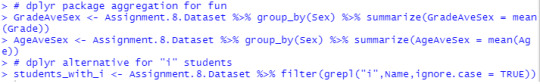
Now I want to find the mean grade and age by sex. Given the example code:
StudentAverage = ddply(Student,"Sex",transform,Grade.Average=mean(Grade))
I adjusted the above code to fit my data names:

A column is added at the end of the original dataset to include the new Grade.Average and Age.Average. I put the two dataframes side by side to show the output and their similarities:

These dataframes can be saved as files by applying write.table():

These files were saved to My Documents and could be seen and accessed from the Files tab in RStudio.
The next step in the assignment is to filter the original dataframe to include only rows with names that includes the letter “I/i” and write the dataframe to file and CSV.


I would like to note subset() and grepl() as arguments given in an example for me to use, but I needed to further understand them so I looked to the RStudio Help tab. Subset() returns subsets of vectors, matrices or dataframes which meet conditions. Grepl() searches for matches of its argument’s pattern (also, grepl() is a variant of grep() that is used for list objects). In my head I see:
Subset #returns table of#(DataToUse, grepl#looks for pattern of __#(Pattern, DataToUse$LookForPatternHere))
It makes sense to me.
I have also been working through lessons in R on Codecademy and just finished with aggregating data with the dplyr package. I was curious to apply what I have practiced with dplyr to this assignment.
Here’s what the dataframes look like:

I think it’s an interesting comparison.
View my codes on Github. I also uploaded the dataset used,
0 notes
Text
Assignment 7
This week’s assignment is to look at S3 vs S4 in R.
I have little background in coding in general, so trying to grasp the qualities and differences of S3 and S4 is challenging. The readings are abstract to me at this point, but I will do my best to better understand.
To begin my journey exploring S3, I selected “airquality” from the R package “datasets” and tested otype(), isS4(), and mode() to respectively check its object type, make sure it is S4 (or not), and the types of objects it stores.
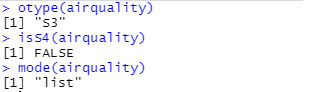
“airquality” is a list of the S3 class. Let’s see if generic functions can be applied to it. A generic function holds a series of methods to enable a result; or as I’ve come to understand it: a generic function is the whole and methods are the pieces that make it work the way it does. Familiar examples of a generic function include summary() and plot():


I wanted to view an S4 class object to get a better visualization and I got as far as installing Bioconductor (because packages within it have S4 class objects) as a package in RStudio and could not come across any datasets to look at (yet). Instead, I can theoretically examine the differences between S3 and S4 classes. Most notably, class attributes can be changed by the user in S3 objects and that class can be anything. Kind of reminds me of hashtagging on social media. In S4, the class is not changed so easily. After looking at this example of an attempt to change an S4 object’s class, its data slots turn into attributes of data--which is interesting, though I don’t completely understand it. Slots are a big thing in S4, which is not seen in S3 objects.
S4 objects are created by using new(), as I explore below:

The class didn’t exist. I am beginning to understand the difficulty. setClass() is used to create a class in S4 and here is my struggle to get a result:

Now, I can create my new object:


I am an S4 object! How cool.
Another difference between S3 and S4 objects is how data is called by elements/slots. S3 uses the $ and S4 uses the @. Below I call the info from the S4 “Danielle” and Wind from the S3 “airquality”

Also, S3 can only dispatch the first argument of a function whereas S4 can dispatch multiple arguments. This is something I realize is true, but have yet to fully grasp what it means.
Overall, S3 is the older and more casual OOP to the newer, more formal and structured S4.
0 notes
Text
Assignment 6
1. Consider A=matrix(c(2,0,1,3), ncol=2) and B=matrix(c(5,2,4,-1), ncol=2). a) Find A + B b) Find A - B

2. Using the diag() function to build a matrix of size 4 with the following values in the diagonal 4,1,2,3.

3. Generate the following matrix:
## [,1] [,2] [,3] [,4] [,5] ## [1,] 3 1 1 1 1 ## [2,] 2 3 0 0 0 ## [3,] 2 0 3 0 0 ## [4,] 2 0 0 3 0 ## [5,] 2 0 0 0 3

The 5 by 5 matrix of zeros is not essential to generating the result, but I included it for myself as a “blank canvas” to work with.
I referenced an example on page 63 in Matloff’s Art of R Programming to assign the vectors to matrix elements.
0 notes
Text
Assignment 5 Part 2
This is the second part to my fifth assignment of R that focuses on matrices and mathematical functions.
I will use the given values:
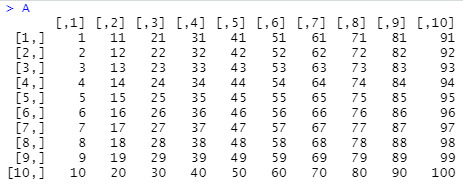
A=matrix(1:100, nrow=10) B=matrix(1:1000, nrow=10)
And assign them in R as:
> A <- matrix(1:100, nrow=10) > B <- matrix(1:1000, nrow=10)
Transposed using t(), the matrices are:
> t(A) > t(B)
It was discovered in the first part of this assignment that matrix A has a determinant of 0 and matrix B is not a square shape, and therefore will not have inverses. To find the inverse and determinant of one (A) and perform mathematical functions with both, we will first create two vectors:
> a <- c(1:5) # 1,2,3,4,5 > b <- c(1,.5) # 1, .5
Multiply the matrices by the vectors:
> A*a > B*b
Let’s look at matrix A and vector a:

Above, you can see the data of matrix A, followed by the data of vector a, and then A and a multiplied. The vector values multiply their way down the columns and repeat until the end of the matrix. Matrix B is a bit expansive to display, so just imagine matrix A continuing to 1000 with 100 columns and when matrix B is multiplied by vector b (1, .5), the values either stay the same or reduce by half.
Now let’s turn the vector data into matrices with dimensions to match their respective counterpart:
> a <- matrix(1:5, nrow=10, ncol=10) > b <- matrix(c(1,.5), nrow=10, ncol=100)
Here is what the matrices a and b look like printed (imagine b with 1000 columns, not just 14):

Now that a and b have identical dimensions as A and B, let’s multiply them as matrices:
> A %*% a > B %*% b

Interestingly, “A multiplied by a” is not the same as “a multiplied by A.” Although the matrices B and b have 10 rows and 100 columns, R tells me I they are non-conformable arguments. I am investigating this.
Looking at the determinant values of matrix A and a… they both return 0. Even their products return 0:

I watched this video to better understand determinants. I immediately reassigned matrix a to 100 random numbers instead and printed its products with A:
a <- matrix(c(60:68,22:18,90:101,130:133,1:70), nrow=10, ncol=10)

And how about a determinant that is not 0?
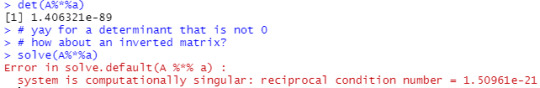
I have run into another error. After reading this post, I believe that the values I entered for matrix a are too linear dependent. I think the example I produced in Assignment 5 Part 1 yields a better result regarding the inverted matrix and determinant value.
0 notes
Text
Assignment 5 Part 1
Assignment 5 has two parts. This first part is my interpretation of the assignment, the second part is a more true version of the assignment’s expectations.
Find the value of inverse of a matrix, determinant of a matrix by using the following values:
A=matrix(1:100, nrow=10) B=matrix(1:1000, nrow=10)
Assign letters to their respective matrix values:
>A <- matrix(1:100, nrow=10) >B <- matrix(1:1000, nrow=10)
First thoughts: looks like A will be 10 columns and 10 rows with values 1-100; and B will be 100 columns and 10 rows with values 1-1000. In my reading of matrices and their inversion I noted that a matrix must be a square to have an inverse, so I will not be finding the determinant or inverse of matrix B. Here is what matrix A looks like:
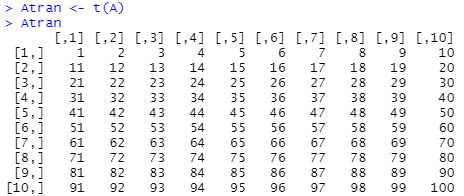
Looking at the “Inverse of a matrix” leaflet, I understand that to find the inverse the adjoint matrix and the determinant are needed.
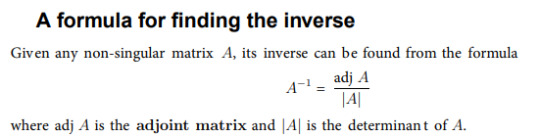
The adjoint matrix is found by transposing the matrix and creating a matrix of minors and then cofactors. Luckily, R makes this easy to do. To transpose the matrix A, I can include byrow=T to assign the order of values by row instead of column:
Atran <- matrix(1:100, nrow=10, byrow=T)
Or simply use t() to transpose the matrix:
I installed the matlib package in RStudio to help with the matrix functions, especially to find the determinant of matrix A.
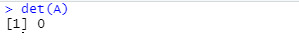
Turns out, matrix A (as it is 1:100) has a determinant of 0, which means its inverse cannot be calculated. So, instead of having an ordered matrix of 1:100, I want to randomize the values to execute the inverse of a matrix and the components related to it. I did this by using sample() and assigned the new matrix values to A2:
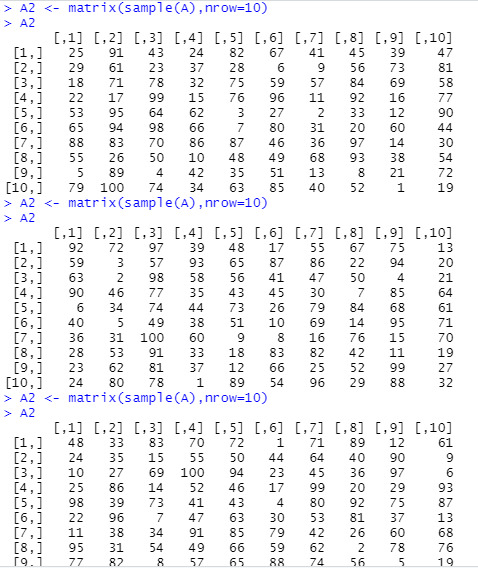
In the graphic above, I ran and printed matrix A2 three separate times to show that each time a different sample of values was made. I encountered this phenomena while experimenting with codes and wanted to show its effects on the data.
To secure a random sample, I assigned a matrix A3 to a set of A2 data values:
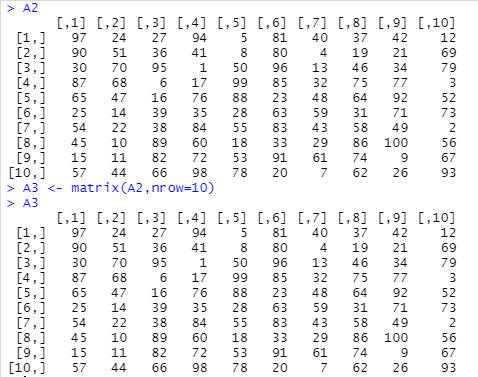
With the A3 matrix, I can find the determinate and inverse using det() and solve():
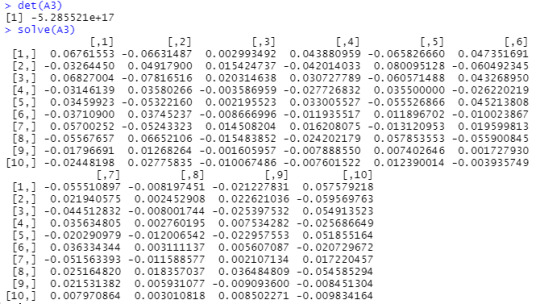
In the determinant value is an “e” and I didn’t know what that meant right away. An internet search has led me to understand -5.285521e+17 as -528,552,100,000,000,000. I think e more likely represents exponent over Euler’s number.
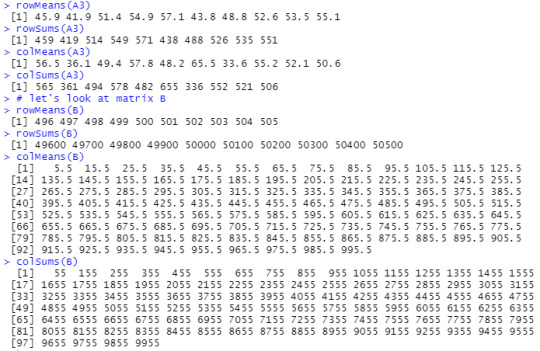
Other mathematical functions that can be applied to a matrix are rowMeans(), rowSums(), colMeans(), and colSums.
1 note
·
View note
Text
Assignment 4
Given values for ten patients include their frequency to the hospital over 12 months, blood pressure, a first doctor’s assessment (1=bad,0=good), a second doctor’s assessment and final head of emergencies decision(0=low,1=high):
> Frequency <- c(0.6,0.3,0.4,0.4,0.2,0.6,0.3,0.4,0.9,0.2) > BP <- c(103,87,32,42,59,109,78,205,135,176) > First <- c(1,1,1,1,0,0,0,0,NA,1) > Second <- c(0,0,1,1,0,0,1,1,1,1) > FinalDecision <- c(0,1,0,1,0,1,0,1,1,1)
I created a matrix and data.frame of the above data:
> assessments <- cbind(Frequency,BP,First,Second,FinalDecision) > assessments.df <- data.frame(Frequency,BP,First,Second,FinalDecision)
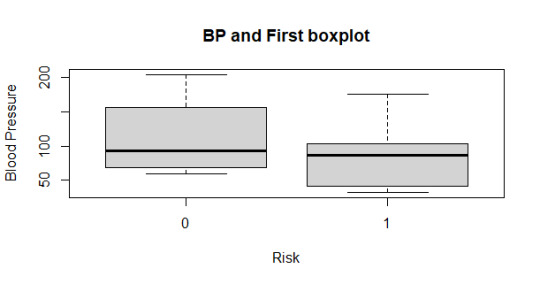
Since the assignment asks to create side-by-side boxplots and histograms, I want to create a boxplot that shows the relationship between BP and FinalDecision. I did an internet search for boxplots to help me visuallyunderstand the result I desired and referenced this site, which helped me code:
> boxplot(BP~FinalDecision, data=assessments.df, main="BP and Final Decision boxplot", xlab="Risk", ylab="Blood Pressure")

The above boxplot code makes it simple to replace “FinalDecision” with “First” and “Second” to further analyze doctor’s assessments compared to blood pressure:

My biggest challenge is creating the histogram I envision. I want to include all three assessments (First,Second,FinalDecision) in one display that will reflect the 0 and 1 counts for each. After creating a histogram in RStudio, I realized that my vision is of a bar chart not a histogram, and that I wanted to graph quantities of variables instead of quantities on a range.
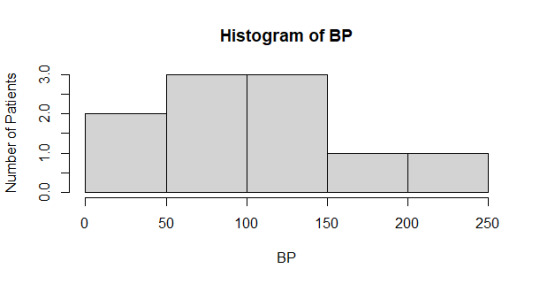
So, I think of what data can put into a histogram? What variables have range beyond just 0 and 1. I could view the distribution of hospital visits and the distribution of BP among the 10 patients.
> hist(Frequency, xlab = "Frequency of Hospital Visits per Year", ylab = "Number of Patients")

> hist(BP, ylab = "Number of Patients", breaks = 5)
Analyzing the side-by-side boxplots and histograms The “First” boxplot shows the BP range and median of both 0 and 1 to be pretty even. The “Second” boxplot shows an extreme change in assessment, the 0 shrunk in BP range as the 1 contained the extremes of BP. In both the “First” and “Second” boxplots, the median BP for both 0 and 1 were about 100. In the “FinalDecision” boxplot, the median shifts down for 0 and up for 1; as well the body of the BP data for 1 is overall higher in range, which appropriately reflects the higher risk of those patients.
I had to do a quick internet search for blood pressure to find out it generally should not exceed 120. The histogram of BP shows at least half of the patients are under 100, potentially 8 (without looking at the raw data). To me, this suggests that blood pressure may not be related to a patient’s admittance to the hospital, though the two patients in the 150-250 range would definitely need immediate attention.
View my code on GitHub.
0 notes
Link
I just stumbled upon this website and it looks like it’s R programming language?
0 notes
Text
Assignment 3
Given data sets: > Name <- c("Jeb", “Donald”, "Ted”, “Marco” “Carly”, “Hillary”, “Berine”) > ABC political poll results <- c(4, 62 51, 21, 2, 14, 15) > CBS political poll results <- c(12, 75, 43, 19, 1, 21, 19)
To start, I copy-and-pasted the above data from Canvas in RStudio and tried to run them. No dice. Errors galore. I learned that copy and pasting is not always so reliable when using R... it didn’t like the more stylized “” apostrophes at all. So I changed all the apostrophes, added a comma to the ABC set, fixed Bernie, and added underscores to the poll results’ identifiers (because R didn’t like the spaces either). Data ready for input:
>Name <- c("Jeb", "Donald", "Ted", "Marco", "Carly", "Hillary", "Bernie") >ABC_political_poll_results <- c(4, 62, 51, 21, 2, 14, 15) >NBC_political_poll_results <- c(12, 75, 43, 19, 1, 21, 19)
Following along with the “Mixed Modes Matrix and data.frame” worksheet, I column bind the data as “polls” to form a matrix and then run it:
>polls <- cbind(Name,ABC_political_poll_results,NBC_political_poll_results) >polls
Name ABC_political_poll_results NBC_political_poll_results [1,] "Jeb" "4" "12" [2,] "Donald" "62" "75" [3,] "Ted" "51" "43" [4,] "Marco" "21" "19" [5,] "Carly" "2" "1" [6,] "Hillary" "14" "21" [7,] "Bernie" "15" "19"
I created the data frame, as well, and many attempts I made to get a mean out of any of the data led me to the same error message and the summary() showed me that all was being read as characters. It was frustrating. I want numeric values!
My goal at this point is to compute the mean for each candidate. To clear my headspace, I simplified “ ABC_political_poll_results” and “NBC_political_poll_results” to simply “ABC” and “NBC”:
>polls <-cbind(Name,ABC,NBC) >polls.df <- data.frame(Name,ABC,NBC)
Then, using the data.frame, I extracted columns 2 and 3 as polls.df[,2:3] and named it “polls_only” to return this:
ABC NBC 1 4 12 2 62 75 3 51 43 4 21 19 5 2 1 6 14 21 7 15 19
Finally, I used rowMeans(polls_only) to get the values: [1] 8.0 68.5 47.0 20.0 1.5 17.5 17.0 I am satisfied that I figured out one way to get the means (and am sure there is probably a more efficient way), but I am learning a new language so I am excited to have gotten a result I was looking for.
I learned of the summary() function, which when applied to polls_only, gives two sets of data for ABC and NBC:
ABC NBC Min. : 2.00 Min. : 1.00 1st Qu.: 9.00 1st Qu.:15.50 Median :15.00 Median :19.00 Mean :24.14 Mean :27.14 3rd Qu.:36.00 3rd Qu.:32.00 Max. :62.00 Max. :75.00
I looked forward most to plotting the data graphically. Given there were only two sets of data for each candidate, I figured a bar graph would show the data best. Using the Help on RStudio, I formulated: barplot(cbind(ABC,NBC) ~ Name, data = polls)

I am pleased with my results. View my code on GitHub.
0 notes
Link
0 notes
Photo

Followed a tutorial in my textbook in the R program and yielded some results! I’m not quite sure what I’m doing yet, but it’s exciting.
0 notes