
Don't wanna be here? Send us removal request.
Statistics
We looked inside some of the posts by datarebecca and here's what we found interesting.
Average Info
Notes Per Post
1
Likes Per Post
1
Reblog Per Post
0
Reply Per Post
0
Time Between Posts
52 minutes
Number of Posts By Type
Text
3
Last Seen Tumblr Blogs


Fun Fact
Tumblr Inc. is funded by 13 investors.
Text
Hadoop
Hadoop
What is Big Data?
There are three V’s in big data: volume, velocity, and variety. Volume is the amount of data, velocity is how fast the data is created, and variety means the types of data. Each of these features is more extreme in big data than in regular data. Big data has such large volumes and complexity that traditional processing systems cannot handle them, and other programs are necessary. Sometimes transactional data is collected that is updated so frequently that the volume of data is massive. It also may include a large variety of data types. This would overload a traditional system, so must be dealt with separately. Big data is very useful for decision making in businesses. Big data management and analysis has become popular, and using traditional data management and analysis practices aren’t suitable for such large volumes. Here, we will explore one common and cost-efficient way to manage big data.
Hadoop
One way to process big data is to use Hadoop. It becomes too expensive to simply purchase more storage to handle big data, so Hadoop is used by vertically scaling rather than horizontal scaling. Multiple commodity computers are connected so they can work together to process the large amounts of data. Hadoop implementation is offered by many companies, and it is possible for one to do on their own by using an open-source system, such as Yahoo’s Apache Hadoop. In regard to finances and efficiency, Hadoop is the best way to process big data.
HDFS
HDFS, or Hadoop Distributed File System, takes any type of data file and splits it into chunks that are replicated as they are written. This is done automatically by Hadoop. Because of this replication, disk failure does not result in permanent data loss. If more storage is needed because of a high volume of data, simply adding more computers does the job. HDFS files have a global view, rather than the typical local view that a single computer has.
Within HDFS, there are Name Nodes and Master Nodes. A Name Node is the server that holds all the data regarding the files and manages incoming file operations. It has an extensive memory. Data Nodes continuously loop waiting for instructions involving reading or writing requests or dealing with data blocks. They have extensive disk storage. The number of name and data nodes can vary based on set up.
MapReduce
MapReduce is a simplified programming model that can be used to write programs and is done across all the computers being used for Hadoop. It is used in Apache Hadoop and has become popular. It is not a programming language; it is just the distributer across the cluster of computers. Any programming language can be used in MapReduce.
One way MapReduce is distributed is through Yet Another Resource Negotiator (YARN). This coordinates the program across different nodes and has three primary services: ResourceManager, JobHistoryServer, and NodeManager. ResourceManger receives and runs the
Application (MapReduce in this case). JobHistoryServer stores a history of each completed job. Finally, NodeManager oversees the ways that nodes use resources.
0 notes
Text
Data Warehouse Design
Data Warehouse Design
Of course it is important to understand how to maintain and query data, but where is this data coming from? It resides in data warehouses. This is where the data can be queried from for analysis. Much thought goes into the design of a data warehouse before it is created. In this post, designs and concepts related to data warehouses will be explored in depth.
Fact and Dimension Tables
The most basic parts of a data warehouse are the facts and the dimensions of the warehouse. Fact tables consist of measurements of a business process, and there is one fact per transaction. On the other hand, dimension tables give more information on that measurement, often based on the 5 W’s and 2 H’s (Who, What, When, Where, Why, How, and How often). These two types of tables are the foundation for various designs of warehouses. More specific types of facts and dimensions are provided below. Another important concept to mention is surrogate keys. These are attributes in a table with the purpose of acting as a unique identifier. They distinguish each row in the table from all other rows. Some tables already have naturally occurring unique identifiers, like social security number, but many don’t. Fact tables contain the surrogate keys if they are used in dimension tables. The decision on whether or not to use surrogate keys varies person by person.
Factless Fact Table: A fact table that has no facts; it just has surrogate keys to relate the dimension tables.

Additive fact: A numeric fact that can be added across all dimensions. An example of this would be the number of medications prescribed by a doctor monthly in a database about medications, assuming this is part of the fact table.
Semi-additive facts: Facts that can be added across some, but not all dimensions. One common example of this is the headcount of an organization.
Non-additive facts: A numeric fact that is a percentage or ratio. These cannot be added across any dimensions. For example, the percent of a county that has been infected with a disease.
Junk dimensions: A dimension that is essentially Boolean. There are two options. For example, a dimension could be “Married” with options yes or no.
Degenerate dimensions: This is a dimension that is a key and is stored in the fact table because it is not part of any other dimensions. An example would be a check number.
Role-playing dimensions: A dimension that is in multiple dimension tables in a database. For example, a date dimensions.
Slowly changing dimensions: This is a dimension that will have some changes over time and need to be updated in the table. There are various methods for updating the tables. One example of a slowly changing dimension is an address. If someone moves, it will need to be updated.
Star Schema
The Star Schema was first created by Ralph Kimball in the 1990s, meaning it is relatively new. The Star Schema is one of the most common and simple conceptual models of a data warehouse. Also known as a dimensional model, the Star Schema includes a centralized fact table with surrounding dimension tables each related to the fact table by at least one attribute. The dimensions in Star Schemas are denormalized. A more complicated version of the Star Schema is the Snowflake Schema. In this Shema, not all dimension tables are related to the fact table. Dimension tables may just be related to other dimension tables, which are related to the fact table. They are often hierarchical. The branching appearance of this model is what gives it the name “Snowflake Schema”. Dimensions in this type of Schema are normalized. Finally, a Fact Constellation can be used when there are multiple fact tables in the data warehouse. These fact tables must either be related to each other or share a common dimension table. The dimensions in Fact Constellations are normalized. It is also possible to have hybrid Fact Constellation with Snowflake Schema.
Star Schema:

Snowflake Schema:

Fact Constellation:

0 notes
Text
Introduction to SQL
Introduction to SQL
One of the key concepts involved in data management is the programming language SQL (Structured Query Language). This language is widely known and used for database management by many individuals and companies around the world. SQL is used to perform creation, retrieval, updating, and deletion (CRUD) tasks on databases, making it very easy to store and query data. SQL was developed in the 1970’s by Raymond Boyce and Donald Chamberlin. It was initially created for use within IBM’s database management system but has since been developed further and become available to the public. Oracle has released an open-source system called MySQL where individuals in the public can write their own SQL to perform queries, which is a great place to start!
Types of Commands
There are three types of commands in SQL:
Data Definition Language (DDL)- DDL defines a database through create, drop, and alter table commands, as well as establishing keys (primary, foreign, etc.)
Data Control Language (DCL)- DCL controls who has access to the data.
Data Manipulation Language (DML)- DML commands are used to query a database.
Steps to Create a Table
The first step to creating a table is making a plan of what variables will be in the table as well as the type of variable. Once a plan is in place, the CREATE TABLE command is used and the variables are listed with their type and length. Then, one must identify which attributes will allow null values and which columns should be unique. At the end, all primary and foreign keys need to be identified. INSERT INTO commands are then used to fill the empty table with rows of data. If a table need to be edited, the ALTER TABLE command can be used. If it needs to be deleted, then DROP TABLE can be used to do so. Sometimes it is helpful to drop a table at the beginning of a session in case there has already been a table created with the table name one is trying to use.
SQL Query Hierarchy
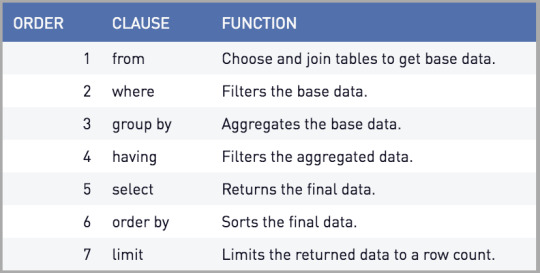
Querying data is essentially asking it a question or asking it for a specified output. Nearly all DML queries begin with the same commands. First, one must identify which columns they would like to the output to contain. This is established by listing the column names after SELECT with commas in between. Aggregate function may be used in this part as well, such as SUM or COUNT. However, if an aggregate function is used, a GROUP BY must also be used (expanded upon later). Next, one must identify the table from which these columns are coming from. To do this, the table name is written after the clause FROM, and an alias may be used if multiple tables are being joined, or just to stay organized. This is also the location where one would identify any tables that are being joined, as well as the column on which they are being joined. SELECT and FROM are the two commands necessary to query data. If there are any filters one would like to use on the data that do not require an aggregation, the WHERE clause comes next. This is where the filter can be applied to the data. If aggregate functions were used in the SELECT command, a GROUP BY command would be used after WHERE. One or more columns can be used in a GROUP BY to group the data by a field (or multiple). Next, a HAVING clause is used to filter data if the filter is based on an aggregate, such as AVG. If one wants the query returned in a sorted manner, the ORDER BY command can be used to sort it in ascending or descending order. If one wants the order to be descending, DESC must be written after ORDER BY. Finally, LIMIT can be used to the limit the number of rows of data returned. These are the steps one would take when writing a query, however, the clauses are processed in a different order by the computer. The order in which they are processed by the computer is as follows: FROM, WHERE, GROUP BY, HAVING, SELECT, ORDER BY, LIMIT. It is also important to note that all these commands are used to query data, so the tables must already be created to perform these operations.
Is it Worth Learning SQL?
The short answer is- absolutely! SQL is a very commonly used programming language across the world; it is universal. Also, it is subjectively easy to learn, especially compared to coding. It is incredibly powerful when dealing with databases. The steps provided above are only for simple queries, though they are very useful. Much more advanced queries are possible with SQL, such as nested queries. If you want to get started with SQL, Data Camp offers excellent beginner courses as well as other online platforms. Because Oracle’s MySQL is open-source and easy to use, it is a great place to practice.
1 note
·
View note