
Gregory W. Harmon, CMT, CFA, is founder and president of Dragonfly Capital Management, a company that offers Managed Accounts and a Premium Trading Service. He has more than 30 years of trading experience.
Don't wanna be here? Send us removal request.
Statistics
We looked inside some of the posts by dragonflycap and here's what we found interesting.
Average Info
Notes Per Post
65
Likes Per Post
60
Reblog Per Post
4
Reply Per Post
1
Time Between Posts
2 days
Number of Posts By Type
Text
17
Last Seen Tumblr Blogs


Fun Fact
Tumblr posted its first advertisements in May 2012 and subsequently earned $13M in revenue.
Text
4 Trade Ideas for Lockheed Martin: Bonus Idea

Lockheed Martin, $LMT, comes into the week rising to resistance. It has a RSI on the cusp of a move into the bullish zone with the MACD flat and positive. There is resistance above at 491 and 500 then 507 and 520 before 531 and 540. Support lower is at 480 and 475. Short interest is low under 1%. The stock pays a dividend with an annual yield of 2.71% and went ex-dividend June 2nd.
The company is expected to report earnings next on July 21st. The June options chain shows biggest open interest at the 490 strike then 470 on the put side. On the call side it is biggest at 500 then 480. In the July chain open interest is big at the 445 and 440 put strikes and much bigger at the 500 call strike. Finally, the August chain shows low open interest so far but biggest at the 460 and 445 puts while at the 500 call strike.

Trade Idea 1: Buy the stock on a move over 491 with a stop at 474.
Trade Idea 2: Buy the stock on a move over 491 and add a July 480/460 Put Spread ($7.40) while selling the July 515 Call ($7.20).
Trade Idea 3: Buy the July/August 500 Call Calendar ($7.90) while selling the July 460 Put ($6.00).
Trade Idea 4: Buy the August 455/495/520 Call Spread Risk Reversal ($1.70).
If you like what you see sign up for more ideas and deeper analysis using this Get Premium link.
After reviewing over 1,000 charts, I have found some good setups for the week. These were selected and should be viewed in the context of the broad Market Macro picture reviewed Friday which with the FOMC meeting coming up next week, saw equity markets showed continued resilience until bombs started flying in the Middle East.
Elsewhere look for Gold to continue its uptrend while Crude Oil is close to testing a reversal of the trend lower. The US Dollar Index continues a short term move to the downside at 3 year lows while US Treasuries consolidate in their downtrend. The Shanghai Composite looks to continue in consolidation while Emerging Markets break to the upside.
The Volatility Index looks to continue in the normal range making life easier for equity markets to the upside. Their charts show short term strength on the longer timeframe with strength also returning into the shorter timeframes. The IWM continues to lag the SPY and QQQ in recovery in price and the shift to bullish momentum on the longer timeframe. The classic “V” recovery continues to build in all 3 Index ETFs as the SPY and QQQ close in on their all-time highs but with possible short term pauses. Use this information as you prepare for the coming week and trad’em well.
4 notes
·
View notes
Text
5 Trade Ideas for Monday: Antero, Cencora, CVS, J&J and Marathon Petroleum
5 Trade ideas excerpted from the detailed analysis and plan for premium subscribers:

Antero Resources, $AR, comes into the week approaching resistance. It has a RSI in the bullish zone with the MACD positive. Look for a push over resistance to participate…
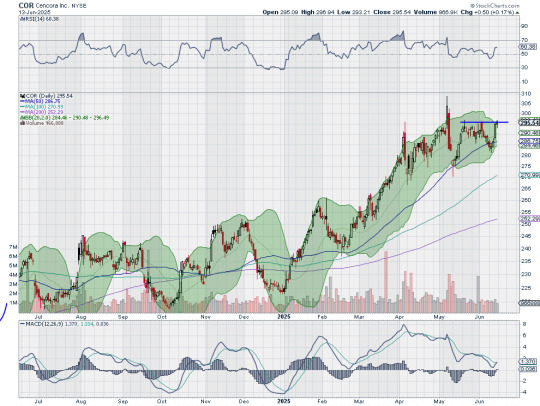
Cencora, $COR, comes into the week at resistance. It has a RSI in the bullish zone with the MACD crossing up. Look for a push over resistance to participate…
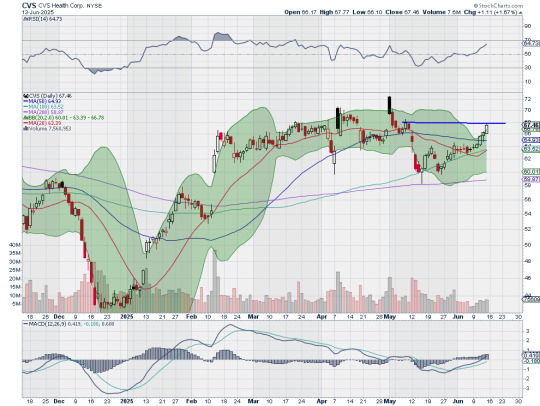
CVS Health, $CVS, comes into the week approaching resistance. It has a RSI in the bullish zone with the MACD positive. Look for a push over resistance to participate…
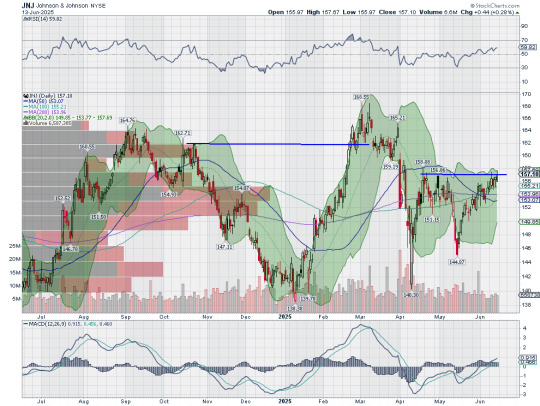
Johnson & Johnson, $JNJ, comes into the week at resistance. It has a RSI on the edge of the bullish zone with the MACD positive. Look for a push over resistance to participate…
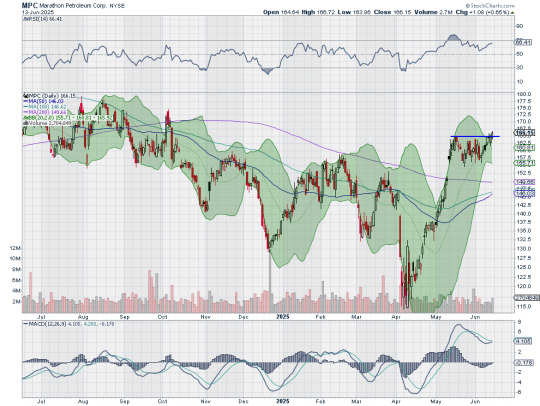
Marathon Petroleum, $MPC, comes into the week at resistance. It has a RSI in the bullish zone with the MACD positive. Look for continuation to participate…
If you like what you see sign up for more ideas and deeper analysis using this Get Premium link.
After reviewing over 1,000 charts, I have found some good setups for the week. These were selected and should be viewed in the context of the broad Market Macro picture reviewed Friday which with the FOMC meeting coming up next week, saw equity markets showed continued resilience until bombs started flying in the Middle East.
Elsewhere look for Gold to continue its uptrend while Crude Oil is close to testing a reversal of the trend lower. The US Dollar Index continues a short term move to the downside at 3 year lows while US Treasuries consolidate in their downtrend. The Shanghai Composite looks to continue in consolidation while Emerging Markets break to the upside.
The Volatility Index looks to continue in the normal range making life easier for equity markets to the upside. Their charts show short term strength on the longer timeframe with strength also returning into the shorter timeframes. The IWM continues to lag the SPY and QQQ in recovery in price and the shift to bullish momentum on the longer timeframe. The classic “V” recovery continues to build in all 3 Index ETFs as the SPY and QQQ close in on their all-time highs but with possible short term pauses. Use this information as you prepare for the coming week and trad’em well.
1 note
·
View note
Text
What to expect from the stock market this week

Last week, the review of the macro market indicators saw with the June non-farm payroll report in the rearview mirror, equity markets showed continued progress moving back towards their all-time highs. Elsewhere looked for Gold ($GLD) to continue its uptrend while Crude Oil ($USO) continued to trend lower. The US Dollar Index ($DXY) continued a short term move to the downside while US Treasuries ($TLT) consolidated in their downtrend. The Shanghai Composite ($ASHR) looked to continue in consolidation while Emerging Markets ($EEM) broke to the upside.
The Volatility Index ($VXX) looked to continue in the normal range making life easier for equity markets to the upside. Their charts showed short term strength on the longer timeframe with strength also returning into the shorter timeframes. The $IWM continued to lag the $SPY and $QQQ in recovery in price and the shift to bullish momentum on the longer timeframe. The classic “V” recovery continued to build in all 3 Index ETFs as the SPY and QQQ closed in on their all-time highs.
The week played out as benign until an Israeli attack on Iran changed that Friday. It saw Gold pushing to the upside and settling near the all-time high while Crude Oil broke its consolidation in the downtrend to the upside as well to close at a 2 month high. The US Dollar dropped to a new 3 year low while Treasuries rose in their consolidation range. The Shanghai Composite met resistance at the top of the consolidation range while Emerging Markets met late week resistance and sold off Friday.
The Volatility Index held in the teens until it ticked up Friday. Equities held in a narrow range but saw a downside drift to end the week. This was not enough to end the uptrend for the SPY and QQQ, but as has been the case the past few years, caused more damage to the IWM. What does this mean for the coming week? Let’s look at some charts.
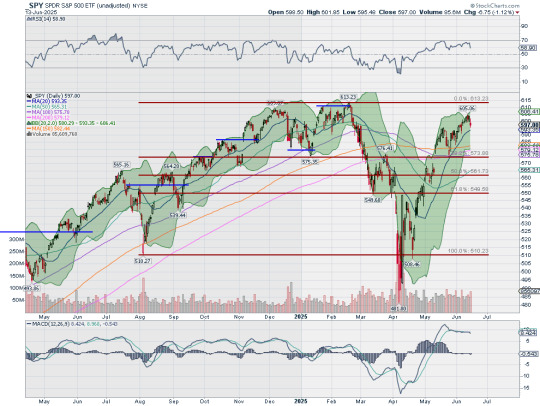
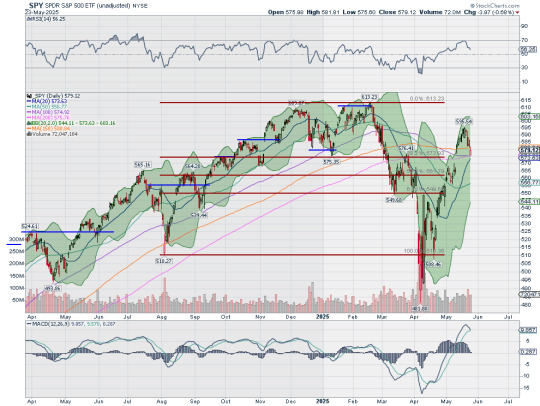
The SPY came into the week at a 3½ month high and just short of the all-time high. It continued higher Monday and Tuesday and then stalled as it opened higher Wednesday but fell back. Thursday saw the drop reversed but then it ended the week giving up all the gains as we learned that Israel was being bombed. The RSI is level in the bullish zone with the MACD also level and positive.
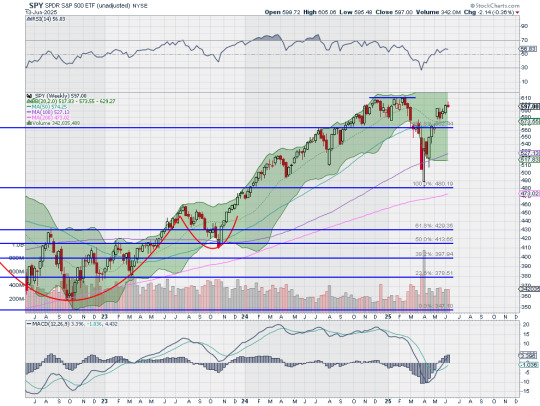
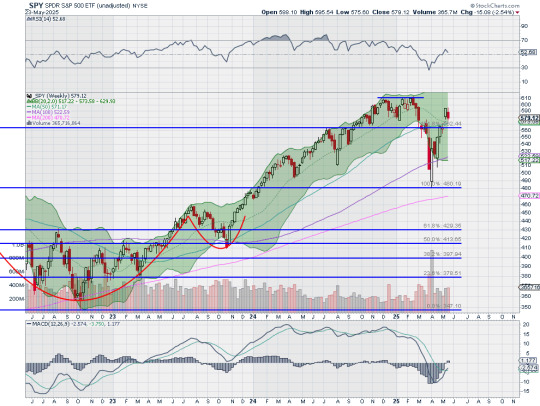
The weekly chart shows a upper shadow, a possible topping candle. The RSI is holding over the midline just under the bullish zone with the MACD positive and rising. There is support lower at 593 and 590 then 586 and 581 before 574.50 and 571.50. Resistance above is at 600 then 604 and 609 before 613. Short Term Uptrend.
With the FOMC meeting coming up next week, equity markets showed continued resilience until bombs started flying in the Middle East. Elsewhere look for Gold to continue its uptrend while Crude Oil is close to testing a reversal of the trend lower. The US Dollar Index continues a short term move to the downside at 3 year lows while US Treasuries consolidate in their downtrend. The Shanghai Composite looks to continue in consolidation while Emerging Markets break to the upside.
The Volatility Index looks to continue in the normal range making life easier for equity markets to the upside. Their charts show short term strength on the longer timeframe with strength also returning into the shorter timeframes. The IWM continues to lag the SPY and QQQ in recovery in price and the shift to bullish momentum on the longer timeframe. The classic “V” recovery continues to build in all 3 Index ETFs as the SPY and QQQ close in on their all-time highs but with possible short term pauses. Use this information as you prepare for the coming week and trad’em well.
Join the Premium Users and you can view the Full Version with 20 detailed charts and analysis: Macro Week in Review/Preview June 13, 2025
4 notes
·
View notes
Text
4 Trade Ideas for Bank of America: Bonus Idea

Bank of America, $BAC, comes into the week at resistance with the Bollinger Bands® squeezed, often a precursor to a move. It has a RSI rising in the bullish zone with the MACD positive and reset lower. There is resistance at 45 then 46 and 47 before 48 and 50 and the all-time high at 55 from 2006. Support lower is at 44.25 and 43.75 then 43 and 42.50. Short interest is low at 1.3%. The stock pays a dividend with an annual yield of 2.31% and went ex-dividend Friday.
The company is expected to report earnings next on July 16th. The June options chain shows biggest open interest at the 40 put strike and the 45 call strike. In the July chain open interest is spread from 44 to 36 on the put side, biggest at 40. On the call side it builds from 40 to a peak at 46 then fades to 52.50. Finally, in the August chain, open interest is biggest at the 37 put strike and at 50 on the call side.

Trade Idea 1: Buy the stock on a move over 45 with a stop at 43.50.
Trade Idea 2: Buy the stock on a move over 45 and add a June 44 Put (35 cents) while selling the July 49 Call (31 cents).
Trade Idea 3: Buy the June/July 47 Call Calendar (70 cents) while selling the July 42 Put (57 cents).
Trade Idea 4: Buy the August 42/46/50 Call Spread Risk Reversal (35
If you like what you see sign up for more ideas and deeper analysis using this Get Premium link.
After reviewing over 1,000 charts, I have found some good setups for the week. These were selected and should be viewed in the context of the broad Market Macro picture reviewed Friday which with the June non-farm payroll report in the rearview mirror, saw equity markets show continued progress moving back towards their all-time highs.
Elsewhere look for Gold to continue its uptrend while Crude Oil continues to trend lower. The US Dollar Index continues a short term move to the downside while US Treasuries consolidate in their downtrend. The Shanghai Composite looks to continue in consolidation while Emerging Markets break to the upside.
The Volatility Index looks to continue in the normal range making life easier for equity markets to the upside. Their charts show short term strength on the longer timeframe with strength also returning into the shorter timeframes. The IWM continues to lag the SPY and QQQ in recovery in price and the shift to bullish momentum on the longer timeframe. The classic “V” recovery continues to build in all 3 Index ETFs as the SPY and QQQ close in on their all-time highs. Use this information as you prepare for the coming week and trad’em well.
1 note
·
View note
Text
5 Trade Ideas for Monday: Abbvie, Amazon, Fastenal, Gilead and IBM
5 Trade ideas excerpted from the detailed analysis and plan for premium subscribers:

Abbvie, $ABBV, comes into the week at resistance. It has a RSI rising off the midline with the MACD positive. Look for a push over resistance to participate…

Amazon, $AMZN, comes into the week breaking resistance. It has a RSI in the bullish zone and a MACD positive. Look for continuation to participate…
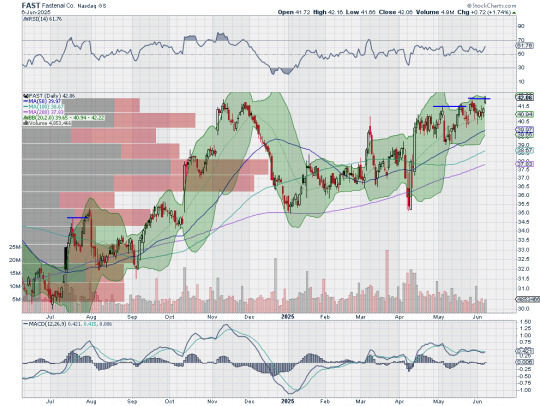
Fastenal, $FAST, comes into the week at resistance. It has a RSI in the bullish zone with the MACD level and positive. Look for a push over resistance to participate…

Gilead Sciences, $GILD, comes into the week at resistance. It has a RSI in the bullish zone with the MACD positive. Look for a push over resistance to participate…

IBM, $IBM, comes into the week at resistance. It has a RSI in the bullish zone with the MACD positive. Look for a push over resistance to participate…
If you like what you see sign up for more ideas and deeper analysis using this Get Premium link.
After reviewing over 1,000 charts, I have found some good setups for the week. These were selected and should be viewed in the context of the broad Market Macro picture reviewed Friday which with the June non-farm payroll report in the rearview mirror, saw equity markets show continued progress moving back towards their all-time highs.
Elsewhere look for Gold to continue its uptrend while Crude Oil continues to trend lower. The US Dollar Index continues a short term move to the downside while US Treasuries consolidate in their downtrend. The Shanghai Composite looks to continue in consolidation while Emerging Markets break to the upside.
The Volatility Index looks to continue in the normal range making life easier for equity markets to the upside. Their charts show short term strength on the longer timeframe with strength also returning into the shorter timeframes. The IWM continues to lag the SPY and QQQ in recovery in price and the shift to bullish momentum on the longer timeframe. The classic “V” recovery continues to build in all 3 Index ETFs as the SPY and QQQ close in on their all-time highs. Use this information as you prepare for the coming week and trad’em well.
1 note
·
View note
Text
What to expect from the stock market this week

Last week, the review of the macro market indicators saw with the month of May in the books, equity markets showed a budding recovery from the prior week. Elsewhere looked for Gold ($GLD) to continue its uptrend while Crude Oil ($USO) continued to trend lower. The US Dollar Index ($DXY) continued a short term move to the downside while US Treasuries ($TLT) consolidated in their downtrend. The Shanghai Composite ($ASHR) looked to continue in consolidation while Emerging Markets ($EEM) fell from the cusp of a break to the upside.
The Volatility Index ($VXX) looked to continue in the normal range making life easier for equity markets to the upside. Their charts showed short term strength on the longer timeframe with digestion in the shorter timeframes. The $IWM continued to lag the $SPY and $QQQ in recovery in price and the shift to bullish momentum on the longer timeframe. The classic “V” recovery continued to build in all 3 Index ETFs as the SPY and QQQ closed in on their all-time highs.
The week played out with Gold breaking the bull flag higher to resistance while Crude Oil rose to short term resistance in the downtrend. The US Dollar back retesting 3 year lows while Treasuries bounced higher from support. The Shanghai Composite continued in consolidation riding the short term moving average while Emerging Markets reversed to rise to 7 month highs.
The Volatility Index ticked lower in the normal range. This took pressure off of equities but they held in a tight range ahead of with the non-farm payroll report. Friday saw some upside with the SPY and the QQQ closing in on all-time highs and the IWM at a 3 month high. What does this mean for the coming week? Let’s look at some charts.

The SPY came into the week just below the May 19 top in a short consolidation over the 20 day SMA. Monday it rose to the top of consolidation and then continued higher Tuesday. After a 2 day hold it made another move up to touch 600 before profit taking. The RSI is level in the bullish zone with the MACD also level and positive.
The weekly chart shows a break of the short consolidation to the upside. The RSI is holding over the midline just under the bullish zone with the MACD now positive and rising. There is support lower at 593 and 590 then 586 and 581 before 574.50 and 571.50. Resistance above is at 600 then 604 and 609 before 613. Short Term Uptrend.

With the June non-farm payroll report in the rearview mirror, equity markets showed continued progress moving back towards their all-time highs. Elsewhere look for Gold to continue its uptrend while Crude Oil continues to trend lower. The US Dollar Index continues a short term move to the downside while US Treasuries consolidate in their downtrend. The Shanghai Composite looks to continue in consolidation while Emerging Markets break to the upside.
The Volatility Index looks to continue in the normal range making life easier for equity markets to the upside. Their charts show short term strength on the longer timeframe with strength also returning into the shorter timeframes. The IWM continues to lag the SPY and QQQ in recovery in price and the shift to bullish momentum on the longer timeframe. The classic “V” recovery continues to build in all 3 Index ETFs as the SPY and QQQ close in on their all-time highs. Use this information as you prepare for the coming week and trad’em well.
Join the Premium Users and you can view the Full Version with 20 detailed charts and analysis: Macro Week in Review/Preview June 6, 2025
5 notes
·
View notes
Text
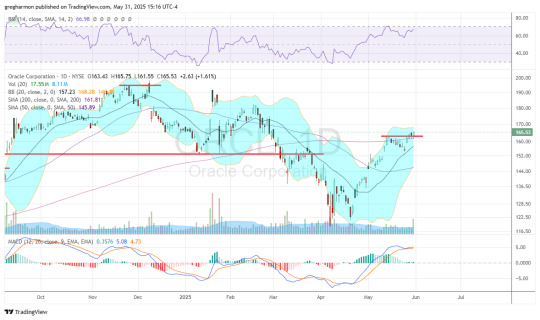
4 Trade Ideas for Oracle: Bonus Idea

Oracle, $ORCL, comes into the week breaking short term resistance and above the 200 day SMA. The Bollinger Bands® are squeezing in, often a precursor to a big move. The RSI is deep in the bullish zone with the MACD avoiding a cross down and positive. There is resistance at 167.50 and 172 then 177.75 and 1181.50 before 191 and 195. Support lower is at 163 and 155. Short interest is low at 1.5%. The stock pays a dividend with an annual yield of 1.21% and has traded ex-dividend since April 10th.
The company is expected to report earnings next on June 9th after the close. The June 13 Expiry options chains shows an expected move of about $15 by expiry with biggest open interest at the 160 put and then the 165 and 1810 call strikes. The June monthly chain has biggest open interest at the 140 put then 150, and at the 165 and 160 call strikes followed by 185. Open interest is biggest at the 130 put then 140 in the July chain and on the call side at 155 then 180 and 150. Finally, in the August chain open interest is biggest at the 145 and 130 put strikes and at the 185 and 180 calls.
Trade Idea 1: Buy the stock on a move over 166 with a stop at 160.
Trade Idea 2: Buy the stock on a move over 166 and add a June 160/150 Put Spread ($3.20) while selling the July 185 Call ($3.00).
Trade Idea 3: Buy the June/July 180 Call Calendar ($1.50) while selling the June 13 Expiry 145 Put ($1.10).
Trade Idea 4: Buy the August 145/170/185 Call Spread Risk Reversal ($1.65).
If you like what you see sign up for more ideas and deeper analysis using this Get Premium link.
After reviewing over 1,000 charts, I have found some good setups for the week. These were selected and should be viewed in the context of the broad Market Macro picture reviewed Friday which With the month of May in the books, saw that equity markets showed a budding recovery from last week.
Elsewhere look for Gold to continue its uptrend while Crude Oil continues to trend lower. The US Dollar Index continues a short term move to the downside while US Treasuries consolidate in their downtrend. The Shanghai Composite looks to continue in consolidation while Emerging Markets fall from the cusp of a break to the upside.
The Volatility Index looks to continue in the normal range making life easier for equity markets to the upside. Their charts show short term strength on the longer timeframe with digestion in the shorter timeframes. The IWM continues to lag the SPY and QQQ in recovery in price and the shift to bullish momentum on the longer timeframe. The classic “V” recovery continues to build in all 3 Index ETFs as the SPY and QQQ close in on their all-time highs. Use this information as you prepare for the coming week and trad’em well.
2 notes
·
View notes
Text
5 Trade Ideas for Monday: Allstate, Air Products, Astrazeneca, Costco and Visa
5 Trade ideas excerpted from the detailed analysis and plan for premium subscribers:
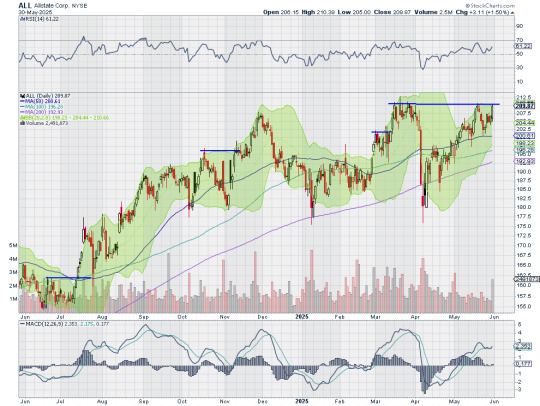
Allstate, $ALL, comes into the week at resistance. It has a RSI in the bullish zone with the MACD positive and rising. Look for a push over resistance to participate…
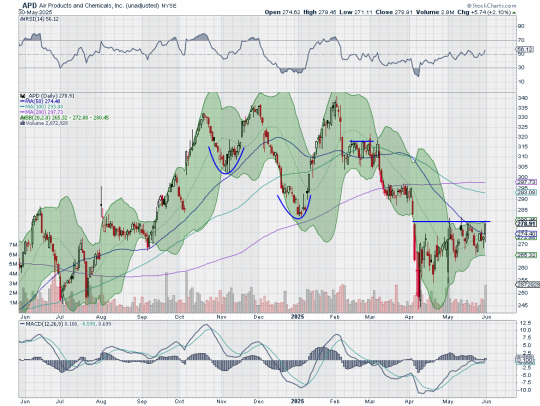
Air Products, $APD, comes into the week at resistance. It has a RSI rising off the midline with the MACD turning positive. Look for a push over resistance to participate…

Astrazeneca, $AZN, comes into the week pressing resistance at the 200 day SMA. It has a RSI in the bullish zone with the MACD positive. Look for a push over resistance to participate…

Costco, $COST, comes into the week at resistance. It has a RSI in the bullish zone with the MACD positive. Look for a push over resistance to participate…

Visa, $V, comes into the week approaching resistance. It has a RSI in the bullish zone with the MACD positive. Look for a push over resistance to participate…
If you like what you see sign up for more ideas and deeper analysis using this Get Premium link.
After reviewing over 1,000 charts, I have found some good setups for the week. These were selected and should be viewed in the context of the broad Market Macro picture reviewed Friday which With the month of May in the books, saw that equity markets showed a budding recovery from last week.
Elsewhere look for Gold to continue its uptrend while Crude Oil continues to trend lower. The US Dollar Index continues a short term move to the downside while US Treasuries consolidate in their downtrend. The Shanghai Composite looks to continue in consolidation while Emerging Markets fall from the cusp of a break to the upside.
The Volatility Index looks to continue in the normal range making life easier for equity markets to the upside. Their charts show short term strength on the longer timeframe with digestion in the shorter timeframes. The IWM continues to lag the SPY and QQQ in recovery in price and the shift to bullish momentum on the longer timeframe. The classic “V” recovery continues to build in all 3 Index ETFs as the SPY and QQQ close in on their all-time highs. Use this information as you prepare for the coming week and trad’em well.
5 notes
·
View notes
Text
What to expect from the stock market this week

Last week, the review of the macro market indicators saw heading into the unofficial start of summer, equity markets showed they could use a long weekend to recover. Elsewhere looked for Gold ($GLD) to continue its uptrend while Crude Oil ($USO) continued to trend lower. The US Dollar Index ($DXY) continued a short term move to the downside while US Treasuries ($TLT) consolidated in their downtrend. The Shanghai Composite ($ASHR) looked to continue in consolidation while Emerging Markets ($EEM) remained on the cusp of breaking consolidation to the upside.
The Volatility Index ($VXX) looked to continue in the normal range, but with an upside bias, removing the stimulus for equity markets to the upside. Their charts showed short term strength on the longer timeframe with digestion in the shorter timeframes. The $IWM continued to lag the $SPY and $QQQ in recovery in price and the shift to bullish momentum on the longer timeframe. The classic “V” recovery continued to build in all 3 Index ETFs as the SPY and QQQ closed in on their all-time highs.
The week played out with Gold consolidating consolidating in the uptrend while Crude Oil found support and held in a narrow range. The US Dollar attempted to rebound but failed and stayed in a narrow range as well while Treasuries moved higher in in consolidation. The Shanghai Composite continued to move sideways while Emerging Markets did break consolidation, but to the downside.
The Volatility Index dropped early, giving up that upside bias and then held in the normal range. This gave equities a pop early in the week but they stalled after that 1 day move. This resulted in the SPY, the QQQ and the IWM little changed but with positive weekly candles continuing the bull case. What does this mean for the coming week? Let’s look at some charts.

The SPY came into the week pulling back from a 2½ month high and at the 20 day SMA. It launched higher Tuesday and held there through Friday. It ended the week just below the May 19 top. The RSI is level in the bullish zone with the MACD rolling over towards a cross down and positive.
The weekly chart shows an inside week holding over the 20 and 50 week SMA’s. The RSI is holding over the midline with the MACD negative but crossed up. There is support lower at 586 and 581 before 574.50 and 571.50. Resistance above is at 590 followed by 593 and 600 then 604 and 609 before 613. Short Term Uptrend.

With the month of May in the books, equity markets showed a budding recovery from last week. Elsewhere look for Gold to continue its uptrend while Crude Oil continues to trend lower. The US Dollar Index continues a short term move to the downside while US Treasuries consolidate in their downtrend. The Shanghai Composite looks to continue in consolidation while Emerging Markets fall from the cusp of a break to the upside.
The Volatility Index looks to continue in the normal range making life easier for equity markets to the upside. Their charts show short term strength on the longer timeframe with digestion in the shorter timeframes. The IWM continues to lag the SPY and QQQ in recovery in price and the shift to bullish momentum on the longer timeframe. The classic “V” recovery continues to build in all 3 Index ETFs as the SPY and QQQ close in on their all-time highs. Use this information as you prepare for the coming week and trad’em well.
Join the Premium Users and you can view the Full Version with 20 detailed charts and analysis: Macro Week in Review/Preview May 30, 2025
10 notes
·
View notes
Text
4 Trade Ideas for JP Morgan: Bonus Idea

JP Morgan, $JPM, comes into the week pulling back to support at what was both prior support and resistance, and the 20 day SMA. This pullback comes after a reversal at the 50% retracement of the move up off the October 2023 low. It has a RSI level in the bullish zone with the MACD possibly crossing down and positive. There is resistance at 264 and 270 then 277.25 and 281. Support lower sits at 256 and 252 then 248.50 and 245 before 240 and 236.50.0 Short interest is low 1%. The stock pays a dividend with an annual yield of 2.15% and will start to trade ex-dividend July 3rd.
The company is expected to report earnings next on July 15th. The June options chain shows large open interest at every 5’s strike from 260 to 235 on the put side, but focused at the 250 strike on the call side. In the July chain it is biggest at the 230 put strike and spread from the 260 to 285 strikes on the call side. Finally, the August chain has biggest open interest at the 220 put and 280 call strikes.

Trade Idea 1: Buy the stock on a move over 262 with a stop at 254.
Trade Idea 2: Buy the stock on a move over 262 and add a 255/245 Put Spread ($2.25) while selling a July 285 Call ($2.35).
Trade Idea 3: Buy the June/July 280 Call Calendar ($2.75) while selling the June 245 Put ($2.00).
Trade Idea 4: Buy the August 240/265/280 Call Spread Risk Reversal ($1.35).
If you like what you see sign up for more ideas and deeper analysis using this Get Premium link during the Memorial Day Sale!
After reviewing over 1,000 charts, I have found some good setups for the week. These were selected and should be viewed in the context of the broad Market Macro picture reviewed Friday which heading into the unofficial start of summer, saw equity markets showing they could use a long weekend to recover.
Elsewhere look for Gold to continue its uptrend while Crude Oil continues to trend lower. The US Dollar Index continues a short term move to the downside while US Treasuries consolidate in their downtrend. The Shanghai Composite looks to continue in consolidation while Emerging Markets remain on the cusp of breaking consolidation to the upside.
The Volatility Index looks to continue in the normal range, but with an upside bias, removing the stimulus for equity markets to the upside. Their charts show short term strength on the longer timeframe with digestion in the shorter timeframes. The IWM continues to lag the SPY and QQQ in recovery in price and the shift to bullish momentum on the longer timeframe. The classic “V” recovery continues to build in all 3 Index ETFs as the SPY and QQQ close in on their all-time highs. Use this information as you prepare for the coming week and trad’em well.
0 notes
Text
5 Trade Ideas for Tuesday: GE Aerospace Howmet, Monster, Nasdaq and Nutrien
5 Trade ideas excerpted from the detailed analysis and plan for premium subscribers:

GE Aerospace, $GE, comes into the week with a bullish engulfing candle under resistance. It has a RSI in the bullish zone with the MACD positive. Look for a push over resistance to participate…

Howmet Aerospace, $HWM, comes into the week at resistance. It has a RSI in the bullish zone with the MACD positive. Look for a push over resistance to participate…
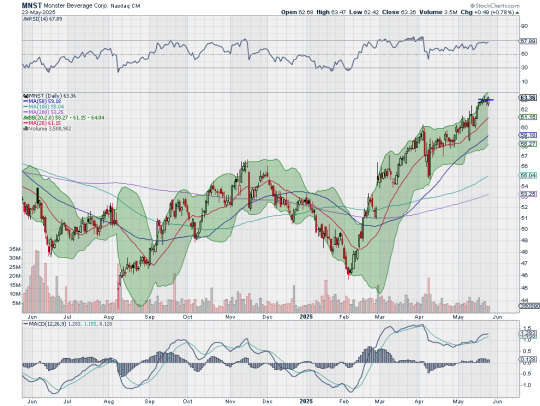
Monster Beverage, $MNST, comes into the week at resistance. It has a RSI in the bullish zone with the MACD positive. Look for a push over resistance to participate…
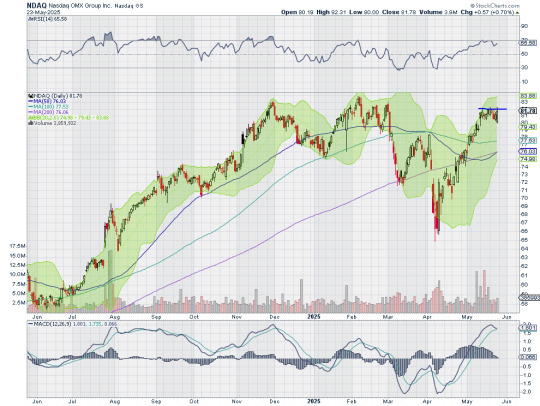
Nasdaq, $NDAQ, comes into the week at resistance. It has a RSI in the bullish zone with the MACD positive. Look for a push over resistance to participate…

Nutrien, $NTR, comes into the week at resistance. It has a RSI in the bullish zone with the MACD positive. Look for a push over resistance to participate…
If you like what you see sign up for more ideas and deeper analysis using this Get Premium link during the Memorial Day Sale!
After reviewing over 1,000 charts, I have found some good setups for the week. These were selected and should be viewed in the context of the broad Market Macro picture reviewed Friday which heading into the unofficial start of summer, saw equity markets showing they could use a long weekend to recover.
Elsewhere look for Gold to continue its uptrend while Crude Oil continues to trend lower. The US Dollar Index continues a short term move to the downside while US Treasuries consolidate in their downtrend. The Shanghai Composite looks to continue in consolidation while Emerging Markets remain on the cusp of breaking consolidation to the upside.
The Volatility Index looks to continue in the normal range, but with an upside bias, removing the stimulus for equity markets to the upside. Their charts show short term strength on the longer timeframe with digestion in the shorter timeframes. The IWM continues to lag the SPY and QQQ in recovery in price and the shift to bullish momentum on the longer timeframe. The classic “V” recovery continues to build in all 3 Index ETFs as the SPY and QQQ close in on their all-time highs. Use this information as you prepare for the coming week and trad’em well.
2 notes
·
View notes
Text
What to expect from the stock market this week

Last week, the review of the macro market indicators saw with the May Options Expiration in the books, equity markets showed strength gapping up and then running higher. Elsewhere looked for Gold ($GLD) to continue its digestion in the uptrend while Crude Oil ($USO) continued to trend lower. The US Dollar Index ($DXY) continued a short term move to the upside while US Treasuries ($TLT) consolidated in their downtrend. The Shanghai Composite ($ASHR) looked to continue in consolidation while Emerging Markets ($EEM) were on the cusp of breaking consolidation to the upside.
The Volatility Index ($VXX) looked to continue to drop and was in the normal range, making the path easier for equity markets to the upside. Their charts showed short term strength on both timeframes. On the shorter timeframe the $IWM, the $QQQ and the $SPY were breaking higher with a shift to bullish momentum. On the longer timeframe the classic “V” recovery continued to build in all 3 Index ETFs as the SPY and QQQ closed in on their all-time highs.
The week played out with Gold moving back towards its record highs while Crude Oil consolidated at the lows. The US Dollar weakened while Treasuries fell back to the 2023 lows. The Shanghai Composite continued in consolidation while Emerging Markets continued higher.
The Volatility Index found a bottom and held until a bounce Friday. This took away from the support of equities and they moved lower. This resulted in the SPY and the QQQ falling back to the gaps from 2 weeks ago with the IWM leading lower, closing its gap. What does this mean for the coming week? Let’s look at some charts.
The SPY came into the week at a 2½ month high. It inched higher Monday and then started a 4 day pullback to the 200 day SMA Friday morning. It ended the week with a strong move higher all day after a gap down open. The RSI is pulling back in the bullish zone with the MACD rolling over towards a cross down and positive.
The weekly chart shows a consolidation candle in the range of last week’s holding over the 20 week SMA. The RSI is holding over the midline with the MACD negative but crossed up. There is support lower at 581 and 574.50 then 571.50 and 565.50 before 556.50 and 549.50. Resistance above is at 585 and 590 then 593 and 600 before 604 and 609. Short Term Uptrend.
Heading into the unofficial start of summer, equity markets showed they could use a long weekend to recover. Elsewhere look for Gold to continue its uptrend while Crude Oil continues to trend lower. The US Dollar Index continues a short term move to the downside while US Treasuries consolidate in their downtrend. The Shanghai Composite looks to continue in consolidation while Emerging Markets remain on the cusp of breaking consolidation to the upside.
The Volatility Index looks to continue in the normal range, but with an upside bias, removing the stimulus for equity markets to the upside. Their charts show short term strength on the longer timeframe with digestion in the shorter timeframes. The IWM continues to lag the SPY and QQQ in recovery in price and the shift to bullish momentum on the longer timeframe. The classic “V” recovery continues to build in all 3 Index ETFs as the SPY and QQQ close in on their all-time highs. Use this information as you prepare for the coming week and trad’em well.
Join the Premium Users and you can view the Full Version with 20 detailed charts and analysis: Macro Week in Review/Preview May 23, 2025
4 notes
·
View notes
Text
Top Trade Ideas for the Week of May 19, 2025: Bonus Idea

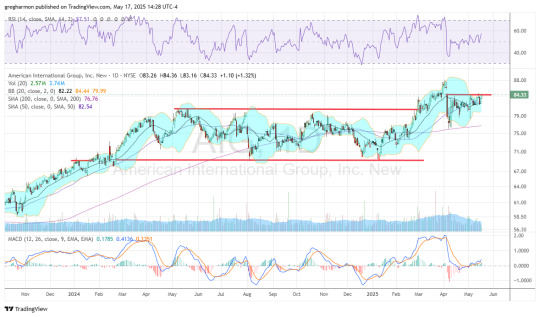
AIG, $AIG, comes into the week at resistance in an ascending triangle. The target move on a break higher would be to 92.50. The Bollinger Bands® are shifted to the upside to allow a move. The RSI is coiling just under the bullish zone with the MACD positive and rising. There is resistance at 84.50 and 86 then 87.75 and back to 2008 at 94 and 125 before 208. Support lower is at 83 and 81.50. Short interest is low at 1.6%. The stock pays a dividend with an annual yield of 2.13% and will trade ex-dividend starting June 13th.
The company is expected to report earnings next on July 29th. The June options chain shows the biggest open interest at 70 then 65 strikes on the put side. On the call side it is also biggest at 70 then 85. In the July chain there is little open interest as of yet. Finally, the August chain has biggest open interest at the 82.50 strike on both the put and call sides.
Trade Idea 1: Buy the stock on a move over 85 with a stop at 81.50.
Trade Idea 2: Buy the stock on a move over 85 and add a June 82.50/77.50 Put Spread ($1.05) while selling the August 92.50 Calls (85 cents).
Trade Idea 3: Buy the July/August 90 Call Calendar ($1.05) while selling the July 77.50 Puts (80 cents).
Trade Idea 4: Buy the August 77.50/87.50/92.50 Call Spread Risk Reversal (40 cents).
If you like what you see sign up for more ideas and deeper analysis using this Get Premium link.
After reviewing over 1,000 charts, I have found some good setups for the week. These were selected and should be viewed in the context of the broad Market Macro picture reviewed Friday which with the May Options Expiration in the books, saw equity markets display strength gapping up and then running higher.
Elsewhere look for Gold to continue its digestion in the uptrend while Crude Oil continues to trend lower. The US Dollar Index continues a short term move to the upside while US Treasuries consolidate in their downtrend. The Shanghai Composite looks to continue in consolidation while Emerging Markets are on the cusp of breaking consolidate to the upside.
The Volatility Index looks to continue to drop and now is in the normal range, making the path easier for equity markets to the upside. Their charts show short term strength on both timeframes. On the shorter timeframe the IWM, the QQQ and the SPY are breaking higher with a shift to bullish momentum. On the longer timeframe the classic “V” recovery continues to build in all 3 Index ETFs as the SPY and QQQ close in on their all-time highs. Use this information as you prepare for the coming week and trad’em well.
4 notes
·
View notes
Text
5 Trade Ideas for Monday: Alcoa, Coinbase, eBay, McKesson and Walmart
5 Trade ideas excerpted from the detailed analysis and plan for premium subscribers:
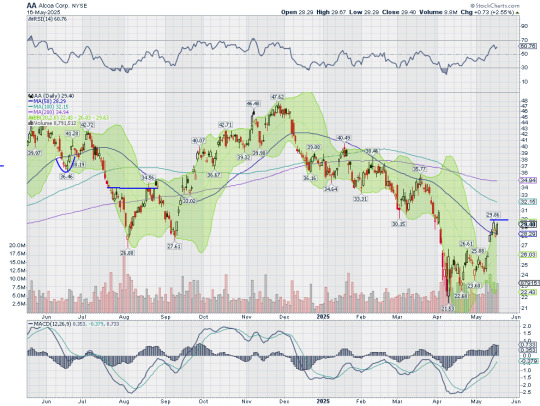
Alcoa, $AA, comes into the week at resistance. It has a RSI in the bullish zone with the MACD positive. Look for a push over resistance to participate…
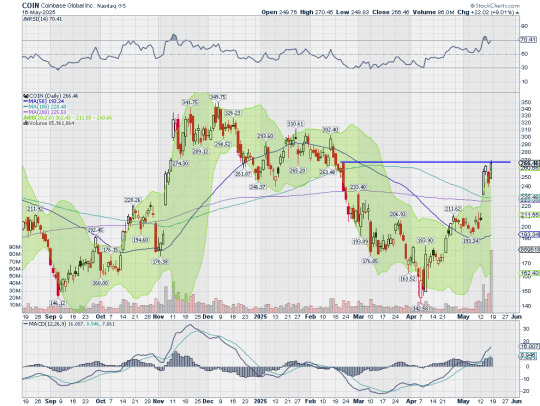
Coinbase, $COIN, comes into the week at resistance. It has a RSI in the bullish zone with the MACD positive. Look for a push over resistance to participate…

eBay, $EBAY, comes into the week at resistance. It has a RSI in the bullish zone with the MACD positive. Look for a push over resistance to participate…
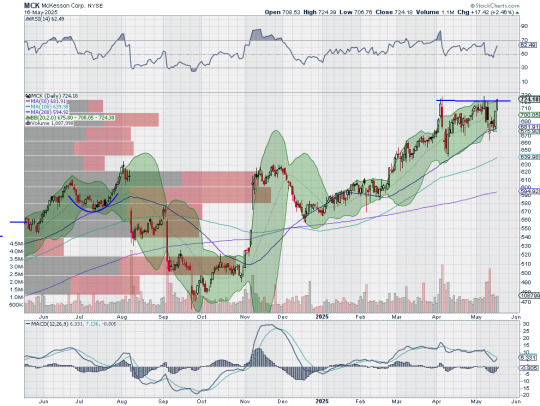
McKesson, $MCK, comes into the week at resistance. It has a RSI in the bullish zone with the MACD positive. Look for a push over resistance to participate…

Walmart, $WMT, comes into the week approaching resistance. It has a RSI in the bullish zone with the MACD positive. Look for a push over resistance to participate…
If you like what you see sign up for more ideas and deeper analysis using this Get Premium link.
After reviewing over 1,000 charts, I have found some good setups for the week. These were selected and should be viewed in the context of the broad Market Macro picture reviewed Friday which with the May Options Expiration in the books, saw equity markets display strength gapping up and then running higher.
Elsewhere look for Gold to continue its digestion in the uptrend while Crude Oil continues to trend lower. The US Dollar Index continues a short term move to the upside while US Treasuries consolidate in their downtrend. The Shanghai Composite looks to continue in consolidation while Emerging Markets are on the cusp of breaking consolidate to the upside.
The Volatility Index looks to continue to drop and now is in the normal range, making the path easier for equity markets to the upside. Their charts show short term strength on both timeframes. On the shorter timeframe the IWM, the QQQ and the SPY are breaking higher with a shift to bullish momentum. On the longer timeframe the classic “V” recovery continues to build in all 3 Index ETFs as the SPY and QQQ close in on their all-time highs. Use this information as you prepare for the coming week and trad’em well.
4 notes
·
View notes
Text
What to expect from the stock market this week

Last week, the review of the macro market indicators saw With the May FOMC meeting in the books, equity markets showed resilience holding up in their short term rises. Elsewhere look for Gold ($GLD) to continue its consolidation in the uptrend while Crude Oil ($USO) continues to trend lower. The US Dollar Index ($DXY) continues to drift to the upside in a bear flag while US Treasuries ($TLT) consolidate in their downtrend. The Shanghai Composite ($ASHR) looks to continue in consolidation while Emerging Markets ($EEM) consolidate in a broad range just under resistance.
The Volatility Index ($VXX) looks to continue moving back to normal, making the path easier for equity markets to the upside. Their charts show short term strength on both timeframes. On the shorter timeframe the $IWM, the $QQQ and the $SPY are on the verge of breaking higher and a shift to bullish momentum. On the longer timeframe the classic “V” recovery continues to build in all 3 Index ETFs.
The week played out with Gold dropping back to a 1 month low in digestion while Crude Oil met resistance in a bounce in the downtrend. The US Dollar also met resistance and dropped back while Treasuries found support at a retest of the 2025 lows and bounced. The Shanghai Composite stalled at thee top on the consolidation range while Emerging Markets rose to 7 month highs.
Volatility continued to move lower on the week, back into the teens. This eased pressure off equities and they continued to rise. This resulted in the SPY and the QQQ ending less than 4% off their highs, but the IWM losing some momentum and stalling. What does this mean for the coming week? Let’s look at some charts.
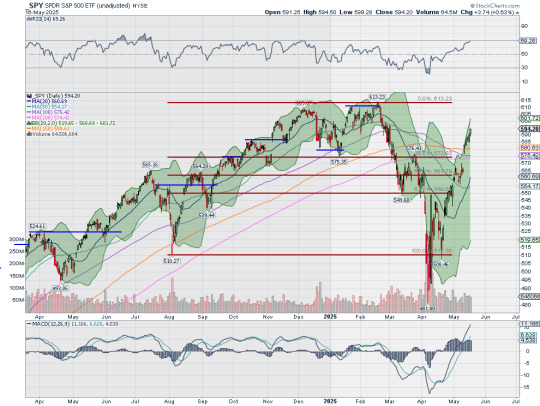
The SPY came into the week at a 6 week high and the 161.8% extension of the retracement of the 2022 drop, despite the FOMC decision to continue waiting. It gapped up Monday over both the 100 and 200 day SMA’s, the latter for the first time since early March. It then continued higher all week to end at a 2½ month high. The RSI is deep in the bullish zone with the MACD rising and positive as price rides the Bollinger Bands® higher.
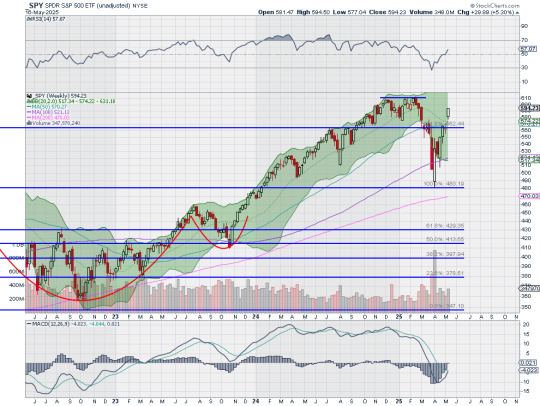
The weekly chart shows the doji candle from last week resolving to the upside and over the 20 week SMA. The RSI is rising off the midline with the MACD negative but crossing up. There is support lower at 593 and 590 then 585 and 581 before 574.50 and 571.50. Resistance above is at 600 and 604 then 609 and 610.25 before 613. Short Term Uptrend.
With the May Options Expiration in the books, equity markets showed strength gapping up and then running higher. Elsewhere look for Gold to continue its digestion in the uptrend while Crude Oil continues to trend lower. The US Dollar Index continues a short term move to the upside while US Treasuries consolidate in their downtrend. The Shanghai Composite looks to continue in consolidation while Emerging Markets are on the cusp of breaking consolidate to the upside.
The Volatility Index looks to continue to drop and now is in the normal range, making the path easier for equity markets to the upside. Their charts show short term strength on both timeframes. On the shorter timeframe the IWM, the QQQ and the SPY are breaking higher with a shift to bullish momentum. On the longer timeframe the classic “V” recovery continues to build in all 3 Index ETFs as the SPY and QQQ close in on their all-time highs. Use this information as you prepare for the coming week and trad’em well.
Join the Premium Users and you can view the Full Version with 20 detailed charts and analysis: Macro Week in Review/Preview May 16, 2025
0 notes
Text
4 Trade Ideas for Caterpillar: Bonus Idea

Caterpillar, $CAT, comes into the week at resistance with the Bollinger Bands® opening higher. It moved back over the 50 day SMA last week for the first time since January. It has a RSI moving into the bullish zone with the MACD rising and positive. There is resistance at 327 and 330 then 336 and 343.50 before 350.75 and 358. Support lower comes at 318.50 and 308.50. Short interest is low at 1.7%. The stock pays a dividend with an annual yield of 1.73% and has traded ex-dividend since April 21st.
The company is expected to report earnings next on August 4th. The May options chain shows biggest open interest the 310 and 300 put strikes and then much bigger on the call side at the 340 strike. The June chain has open interest spread from 350 to 270 on the put side and focused from 330 to 360 on the call side. The July chain has biggest open interest at the 300 put strike and then 340 then 360 call strikes. Finally, in the August chain, open interest is spread from 360 to 280 on the put side and biggest at 400 on the call side.

Trade Idea 1: Buy the stock on a move over 327 with a stop at 315.
Trade Idea 2: Buy the stock on a move over 327 and add a June 320/310 Put Spread ($3.35) while selling the July 370 Calls ($2.35).
Trade Idea 3: Buy the June/July 350 Call Calendar ($3.45) and sell the June 300 Put ($3.60).
Trade Idea 4: Buy the August 300/340/380 Call Spread Risk Reversal ($1.40).
If you like what you see sign up for more ideas and deeper analysis using this Get Premium link.
After reviewing over 1,000 charts, I have found some good setups for the week. These were selected and should be viewed in the context of the broad Market Macro picture reviewed Friday which with the May FOMC meeting in the books, equity markets showed resilience holding up in their short term rises.
Elsewhere look for Gold to continue its consolidation in the uptrend while Crude Oil continues to trend lower. The US Dollar Index continues to drift to the upside in a bear flag while US Treasuries consolidate in their downtrend. The Shanghai Composite looks to continue in consolidation while Emerging Markets consolidate in a broad range just under resistance.
The Volatility Index looks to continue moving back to normal, making the path easier for equity markets to the upside. Their charts show short term strength on both timeframes. On the shorter timeframe the IWM, the QQQ and the SPY are on the verge of breaking higher and a shift to bullish momentum. On the longer timeframe the classic “V” recovery continues to build in all 3 Index ETFs. Use this information as you prepare for the coming week and trad’em well.
16 notes
·
View notes
Text
5 Trade Ideas for Monday: ADP, Cummins, Interactive Brokers, Cloudflare and Visa
5 Trade ideas excerpted from the detailed analysis and plan for premium subscribers:
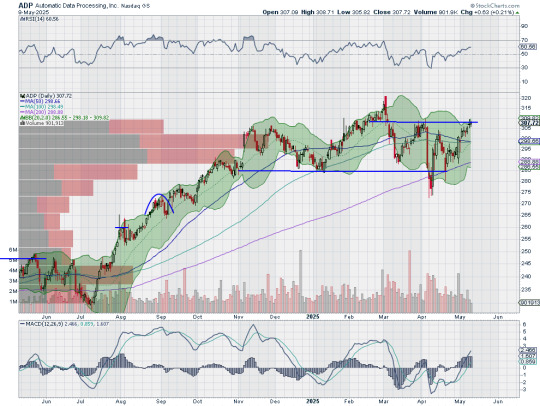
Automatic Data Processing, $ADP, comes into the week at resistance. It has a RSI in the bullish zone with the MACD positive. Look for a push over resistance to participate…

Cummins, $CMI, comes into the week approaching resistance. It has a RSI rising through the midline with the MACD about to turn positive. Look for a push over resistance to participate…

Interactive Brokers, $IBKR, comes into the week pushing away from resistance. It has a RSI in the bullish zone with the MACD positive. Look for continuation higher to participate…
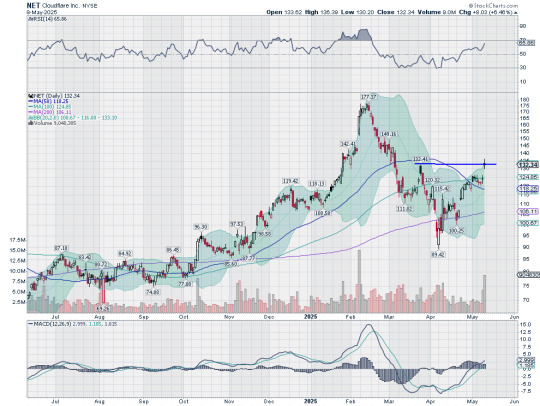
Cloudflare, $NET, comes into the week breaking resistance. It has a RSI in the bullish zone with the MACD positive. Look for continuation to participate…
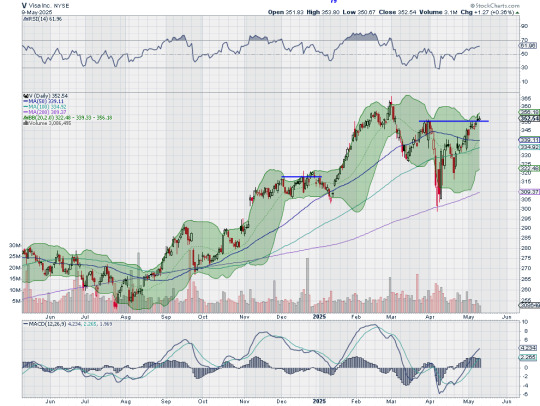
Visa, $V, comes into the week breaking resistance. It has a RSI in the bullish zone with the MACD positive. Look for continuation to participate…
If you like what you see sign up for more ideas and deeper analysis using this Get Premium link.
After reviewing over 1,000 charts, I have found some good setups for the week. These were selected and should be viewed in the context of the broad Market Macro picture reviewed Friday which with the May FOMC meeting in the books, equity markets showed resilience holding up in their short term rises.
Elsewhere look for Gold to continue its consolidation in the uptrend while Crude Oil continues to trend lower. The US Dollar Index continues to drift to the upside in a bear flag while US Treasuries consolidate in their downtrend. The Shanghai Composite looks to continue in consolidation while Emerging Markets consolidate in a broad range just under resistance.
The Volatility Index looks to continue moving back to normal, making the path easier for equity markets to the upside. Their charts show short term strength on both timeframes. On the shorter timeframe the IWM, the QQQ and the SPY are on the verge of breaking higher and a shift to bullish momentum. On the longer timeframe the classic “V” recovery continues to build in all 3 Index ETFs. Use this information as you prepare for the coming week and trad’em well.
2 notes
·
View notes