
Don't wanna be here? Send us removal request.
Statistics
We looked inside some of the posts by draxgod and here's what we found interesting.
Average Info
Notes Per Post
2
Likes Per Post
2
Reblog Per Post
0
Reply Per Post
0
Number of Posts By Type
Text
1
Last Seen Tumblr Blogs


Fun Fact
130K people were victims of a chain letter scam that affected Tumblr in May 2011.
Text
Titanic Passenger List
Survival EDA Report
Introduction:
The sinking of the Titanic is one of the most infamous shipwrecks in history.
On April 15, 1912, during her maiden voyage, the widely considered “unsinkable” RMS Titanic sank after colliding with an iceberg. Unfortunately, there weren’t enough lifeboats for everyone onboard, resulting in the death of 1502 out of 2224 passengers and crew.
While there was some element of luck involved in surviving, it seems some groups of people were more likely to survive than others.
About Dataset:
Dataset Overview:
The dataset contains 891 rows and 12 columns.
The columns include passenger information such as ID, survival status, class, name, sex, age, family information (SibSp, Parch), ticket details, fare, cabin, and embarkation point.
Missing Data:
Age has 177 missing values (19.9% of the data).
Cabin has 687 missing values (77.1% of the data).
Embarked has 2 missing values (0.2% of the data).
Survival Rate:
The overall survival rate is approximately 38.4% (mean of the 'Survived' column).
Passenger Class Distribution:
The mean of 'Pclass' is 2.31, indicating that there are more passengers in the lower classes (2nd and 3rd) than in the 1st class.
Age Distribution:
The average age of passengers is about 29.7 years, with a standard deviation of 14 years.
Fare Distribution:
The average fare is 32.2, with a large standard deviation of 49.7, suggesting a wide range of ticket prices.
Observations
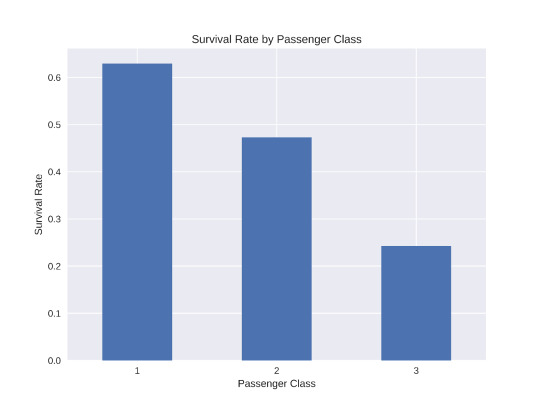
This bar plot clearly shows that passengers in higher classes had a better chance of survival:
1st class passengers had the highest survival rate, around 63%.
2nd class passengers had a survival rate of about 47%.
3rd class passengers had the lowest survival rate, approximately 24%.
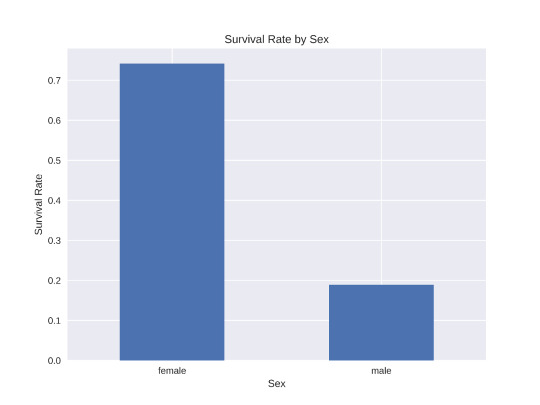
This visualization reveals a stark difference in survival rates between males and females:
Females had a much higher survival rate, around 74%.
Males had a significantly lower survival rate, about 19%.
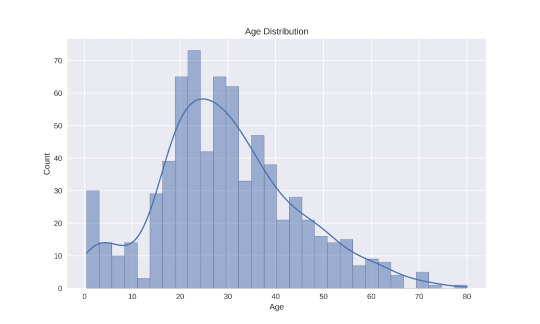
3.The histogram of age distribution shows:
The majority of passengers were between 20 and 40 years old.
There's a noticeable peak around age 30.
There were fewer children and elderly passengers compared to young and middle-aged adults.
Conclusion:
These visualizations provide valuable insights into the factors that influenced survival on the Titanic. The passenger's class, sex, and to some extent, age, all played roles in determining their chances of survival. This information could be useful for further analysis or building predictive models.
2 notes
·
View notes