
svbook.great-site.net publishes affordable books on data science and programming to help people get into the field. EMHAcademy.great-site.net teaches courses based on the books published. dstk2.sourceforge.io develops data science softwares. This is SVBook's Blogs. eDataScience also publishes at medium: https://medium.com/@gohminghui88 and edatascience.great-site.net. Subscribe to us at: edatascience.tumblr.com/subscribe
Don't wanna be here? Send us removal request.
Statistics
We looked inside some of the posts by edatascience and here's what we found interesting.
Average Info
Notes Per Post
9
Likes Per Post
9
Reblog Per Post
0
Reply Per Post
0
Time Between Posts
1 month
Number of Posts By Type
Text
17
Last Seen Tumblr Blogs


Fun Fact
In 2020, 27% of US Tumblr users had an annual household income of over $100,000.

Text
8 Programming Languages for Data Science
What is Data Science and Data Mining?
What is CRISP DM? For Data Mining process, we usually use CRISP DM data mining process:

Based on: https://www.datascience-pm.com/crisp-dm-2/
Data Mining process steps includes Business Understanding, Data Understanding, Data Preparation, Modeling, Evaluation, Deployment.
- Business Understanding step - we need to understand the business and establish the question we need to answer for the data mining
- Data Understanding step - we need to understand the data. We can use statistics such as descriptive, regression analysis to understand the data.
- Data Preparation step - it is the cleaning of the data and we can remove duplicates here.
- Modeling step - we create clustering models, prediction models, classification models.
- Evaluation step - we evaluate which models is more accurate and select.
- Deployment steps - we can create data products.
For Data Science, at the Deployment steps, we create data products for businesses. We can create softwares that predicts something. In the table, the goal is to build data products for a business.
For Data Mining, at the Deployment steps, we create reports or PowerPoints slides on our results. In the table, the goal is to extracting important information.
Read More on CRISP DM: http://edatascience.great-site.net/2023/03/08/what-is-crisp-dm/
Data Analysis Process
What is Data Analysis Process? The following is the summary of Data Analysis process:

Identify - You need to identify why you need data analysis in the first place?
Collect - As the name suggest, this is the step you collect data.
Analyse - To analyze data, you can use descriptive statistics (mean, median, …), inferential statistics, data visualizations (charts) to analyze the data.
Interpret - It is time to interpret your results. Write report.
Read more: http://edatascience.great-site.net/2023/03/09/what-is-data-analysis-process/
R
R is an open source, powerful scripting language, extensible and easy to learn. R is popular in academic and finance, and focus on statistical and graphics. R has a large community and is an alternative to SAS. R is an ideal choice for Data Science, Data Mining, Machine Learning. Here are some R libraries:
- dplyr
- caret
- ggplot2
You can read more: http://edatascience.great-site.net/2023/03/12/what-are-they-dplyr-ggplot2-caret-rmarkdown-r-libraries/
Book: https://link.springer.com/book/10.1007/978-1-4842-4200-1
Course: http://emhacademy.great-site.net/
Python
Python is an open source programming languages with broad applications. Python is programming, hence, if you are developing softwares and web application, Python is ideal. Python is ideal for deployment stage when you want to create software. There are many libraries. Python can also perform data preparation, data visualization and understanding, statistical analysis, machine learning, deep learning. Here are some Python Libraries:
- Pandas
- MatPlotLib
- Scikit-Learn
You can read more: http://edatascience.great-site.net/2023/03/12/92/
Book: https://leanpub.com/quickguidetodatasciencewithpython
Course: http://emhacademy.great-site.net/
Julia
Julia is a raising star in data science. Julia is another language designed for numerical analysis and focus on performance. Julia is referred to or as inheritor of Python, and is a highly effective tool for data analysis.
SAS
Statistical Analysis Software (SAS) is a software for business intelligence and analyzing data. The main purpose of SAS is to retrieve, report and analyze statistical data. SAS has been around for long time and is widely used in companies, great for SAS developers.
SQL
Much of the world data is stored in database. Every company has data and need data scientist. SQL (Structured Query Language) gives you access to database. Having skills of SQL will allow you to work with different relational database, including SQLite, MySQL, PostgreSQL. Despite the differences between SQLite, MySQL, PostgreSQL, SQL can be used to access data from these databases. When you choose R, Python to start, you should also consider SQL also.
Course: http://emhacademy.great-site.net/
MatLab
Matlab is a powerful software for mathematical and statistical computing. Matlab has libraries for creating plots for data understanding. Matlab is useful for learning data science and is great way to transit to deep learning. Open source alternative for Matlab is SciLab.
Java
Java is referred to write ounce, run anyway Programming language that has been used by companies for software development and web application development. Java can be used for data mining, text mining and etc. You can use Stanford POSTagger libraries and JUNG Library for Social Network Analysis.
Book: https://leanpub.com/javaprogrammingfortextminingandnlp
Course: http://emhacademy.great-site.net/
C#
C# programming is a programming language developed by Microsoft that runs on .Net Framework. C# is used for Web Application development, Desktop Application development and etc. C# is easy for desktop application development because of the GUI building (Microsoft created Windows, hence, GUI building is easy). C# programming has machine learning libraries form Microsoft ML.Net.
Book: https://leanpub.com/learnbyexamples_csharp_programming
Course: http://emhacademy.great-site.net/
If you want to learn more about data science, you can go to http://svbook.great-site.net/?i=1
SVBook Pte. Ltd. assists people to know What is Data Science, Text Analysis, Text Mining, Text Analytics, AI and Machine Learning, process of data, Data Mining to Insights Process using CRISP DM. Data Mining Process Steps includes Business Understanding, Data Understanding, Data Preparation, Modeling, Evaluation, Deployment.
DSTK.Tech (https://dstk2.sourceforge.io/) creates tools and technologies for Data Science, develops open source tools for data science.
EMHAcademy (http://emhacademy.great-site.net/) offers courses to help people become Certified Data Scientist.
Thanks for readings.
Kind Regards,
Eric Goh
Buy me a cup of coffee:https://www.buymeacoffee.com/gohminghui
Reference:
- https://flatironschool.com/blog/data-science-programming-languages/
- https://www.datacamp.com/blog/top-programming-languages-for-data-scientists-in-2022
- https://www.w3schools.com/cs/index.php
Read the full article
7 notes
·
View notes
Text
10 Data Science Book for Beginner?
What is Data Mining and Data Analysis?
What is CRISP DM? For Data Mining process, we usually use CRISP DM data mining process:

Based on: https://www.datascience-pm.com/crisp-dm-2/
Data Mining process steps includes Business Understanding, Data Understanding, Data Preparation, Modeling, Evaluation, Deployment.
- Business Understanding step - we need to understand the business and establish the question we need to answer for the data mining
- Data Understanding step - we need to understand the data. We can use statistics such as descriptive, regression analysis to understand the data.
- Data Preparation step - it is the cleaning of the data and we can remove duplicates here.
- Modeling step - we create clustering models, prediction models, classification models.
- Evaluation step - we evaluate which models is more accurate and select.
- Deployment steps - we can create data products.
For Data Science, at the Deployment steps, we create data products for businesses. We can create softwares that predicts something. In the table, the goal is to build data products for a business.
For Data Mining, at the Deployment steps, we create reports or PowerPoints slides on our results. In the table, the goal is to extracting important information.
Read More on CRISP DM: http://edatascience.great-site.net/2023/03/08/what-is-crisp-dm/
Data Analysis Process
What is Data Analysis Process? The following is the summary of Data Analysis process:

Identify - You need to identify why you need data analysis in the first place?
Collect - As the name suggest, this is the step you collect data.
Analyse - To analyze data, you can use descriptive statistics (mean, median, …), inferential statistics, data visualizations (charts) to analyze the data.
Interpret - It is time to interpret your results. Write report.
Read more: http://edatascience.great-site.net/2023/03/09/what-is-data-analysis-process/
Learn By Examples, A Quick Guide to Data Science with Python

This technical book aim to equip the reader with Python programming fundamentals in a fast and practical way. There will be many examples and explanations that are straight to the point. You will develop your own Python programs for Data Mining application.
Contents
- Introduction
- Language Essentials I (Variables, Lists, …)
- Language Essentials II (Loops, Conditions, …)
- OBject Essentials (Modules, Objects and Classes, …)
- Data Mining walkthrough with Python (Pandas, Scikit Learn, …)
- Conclusion
-
- Read More: https://leanpub.com/quickguidetodatasciencewithpython
Learn By Examples, A Quick Guide to Java Programming for Text Mining and NLP

This technical book aim to equip the reader with Java programming, Text Mining, and Natural Language Processing fundamentals in a fast and practical way. There will be many examples and explanations that are straight to the point. You will develop your own Text Mining Application at the end of the book.
Contents
- Introduction
- Getting Started (Installing IDE, …)
- Language Essentials I (variables, data types, …)
- Language Essentials II (loops, if… else…, methods)
- Object Essentials (classes, inheritance, polymorphism, encapsulation, …)
- Text Mining Essentials (Import Text Files, Text Transformation (lowercase, stopwords), Text Understanding (Stanford NLP), Text Classification (Stanford Classifier) )
- Conclusion
- Read More: https://leanpub.com/javaprogrammingfortextminingandnlp
Learn By Examples, A Quick Guide to Data Mining with RapidMiner and Weka Book
This technical book aim to equip the reader with RapidMiner and Weka, Data Mining in a fast and practical way. There will be many examples and explanations that are straight to the point.
Contents
- Introduction (What is data science, what is data mining, CRISP DM Model, what is text mining, three types of analytics, big data)
- Getting Started (INstall Weka and RapidMiner)
- Prediction and Classification (Prediction and Classification)
- Machine Learning Basics (KMeans Clustering, Decision Tree, Naive Bayes, KNN, Neural Network)
- Data Mining with Weka (Data Understanding using Weka, Data Preparation using Weka, Model Building and Evaluation using Weka)
- Data Mining with RapidMiner (Data Understanding using RapidMiner, Data Preparation using RapidMiner, Model Building and Evaluation using RapidMiner)
- Conclusion
- Read More: https://leanpub.com/aquickguidetodtaaminingusingrapidminerandweka
Learn By Examples, A Quick Guide to PowerApp and Power BI Book
This technical book aim to equip the reader with POwerApp and PowerBI in a fast and practical ways. There will be many examples and explanations that are straight to the point.
Contents
- Introduction
- Getting Started
- Work with PowerApp Template
- Create PowerApp from Scratch
- AI Builder
- Power BI
- Conclusion
- Read More: https://leanpub.com/learnbyexamples-aquickguidetopowerappandpowerbi
Learn R for Applied Statistics

Gain the R programming language fundamentals for doing the applied statistics useful for data exploration and analysis in data science and data mining. This book covers topics ranging from R syntax basics, descriptive statistics, and data visualizations to inferential statistics and regressions. After learning R’s syntax, you will work through data visualizations such as histograms and boxplot charting, descriptive statistics, and inferential statistics such as t-test, chi-square test, ANOVA, non-parametric test, and linear regressions.
Contents
- Discover R, statistics, data science, data mining, and big data
- Master the fundamentals of R programming, including variables and arithmetic, vectors, lists, data frames, conditional statements, loops, and functions
- Descriptive Statistics (Standard Deviation, Percentile, …)
- Create data visualizations, including bar charts, line charts, scatter plots, boxplots, histograms, and scatterplots (basic R plots, ggplot2)
- Use inferential statistics including t-tests, chi-square tests, ANOVA, non-parametric tests, linear regressions, and multiple linear regressions
- Conclusion
Read More: https://www.apress.com/in/book/9781484241998
Read the full article
1 note
·
View note
Text
10 Data Science Certificate for Beginner?
What is Data Mining and Data Analysis?
What is CRISP DM? For Data Mining process, we usually use CRISP DM data mining process:

Based on: https://www.datascience-pm.com/crisp-dm-2/
Data Mining process steps includes Business Understanding, Data Understanding, Data Preparation, Modeling, Evaluation, Deployment.
- Business Understanding step - we need to understand the business and establish the question we need to answer for the data mining
- Data Understanding step - we need to understand the data. We can use statistics such as descriptive, regression analysis to understand the data.
- Data Preparation step - it is the cleaning of the data and we can remove duplicates here.
- Modeling step - we create clustering models, prediction models, classification models.
- Evaluation step - we evaluate which models is more accurate and select.
- Deployment steps - we can create data products.
For Data Science, at the Deployment steps, we create data products for businesses. We can create softwares that predicts something. In the table, the goal is to build data products for a business.
For Data Mining, at the Deployment steps, we create reports or PowerPoints slides on our results. In the table, the goal is to extracting important information.
Read More on CRISP DM: http://edatascience.great-site.net/2023/03/08/what-is-crisp-dm/
Data Analysis Process
What is Data Analysis Process? The following is the summary of Data Analysis process:

Identify - You need to identify why you need data analysis in the first place?
Collect - As the name suggest, this is the step you collect data.
Analyse - To analyze data, you can use descriptive statistics (mean, median, …), inferential statistics, data visualizations (charts) to analyze the data.
Interpret - It is time to interpret your results. Write report.
Read more: http://edatascience.great-site.net/2023/03/09/what-is-data-analysis-process/
Create Your Calculator: Learn R Basics Fast Course
Have you ever wanted to build your own calculator program? This course is for you. This course is specially designed for you to quickly and easily gain all the fundamental skills of R to create your own calculator, regardless of your background. You can proceed to our "Fundamentals of R for Applied Statsitics Course " after this course.
Read More: https://www.udemy.com/course/create-your-calculator-learn-r-programming-basics-fast/learn/
Applied Statistics using R with Data Processing (Data Understanding and Data Preparation) Course
Have you ever wanted to learn data mining? Data Science is a very hot trend now. This course will equip you with applied statistics knowledge and Data Processing, with the use of R. This course is a step up from "Create Your Calculator: Learn R Basics Fast" Course.
Read More: https://www.udemy.com/course/applied-statistics-with-r/
Data Visualization using R with Data Processing (Data Understanding and Data Preparation) Course
Data Science is a very hot trend now. This course will equip you with Data Visualization and Data Processing knowledge, with the use of R. This course is a step up from "Create Your Calculator: Learn R Basics Fast" Course.
Read More: https://www.udemy.com/course/data-visualizations-using-r-with-data-processing/
Machine Learning with R Course (Modeling and Evaluation)
Data Science is a very hot trend now. This course will equip you with machine learning and Evaluation knowledge, with the use of R programming language. This course is a step up from "Create Your Calculator: Learn R Basics Fast" Course.
Read More: https://www.udemy.com/course/machine-learning-with-r-d/
Create Your Calculator: Learn Python Basics Fast Course
Have you ever wanted to build your own calculator program? This course is for you. This course is specially designed for you to quickly and easily gain all the fundamental skills of Python to create your own calculator, regardless of your background. This course is a step up from "Create Your Calculator: Learn Python Basics Fast" Course.
Read More: https://www.udemy.com/course/create-your-calculator-learn-python-programming-basics-fast/
Applied Statistics using Python with Data Processing (Data Understanding and Data Preparation) Course
Have you ever wanted to learn data mining? Data Science is a very hot trend now. This course will equip you with applied statistics and data processing knowledge, with the use of Python. This course is a step up from "Create Your Calculator: Learn Python Basics Fast" Course.
Read More: https://www.udemy.com/course/applied-statistics-and-data-preparation-with-python/
Data Visualization using Python with Data Processing (Data Understanding and Data Preparation) Course
Data Science is a very hot trend now. This course will equip you with Data visualization and data processing knowledge, with the use of Python. This course is a step up from "Create Your Calculator: Learn Python Basics Fast" Course.
Read More: https://www.udemy.com/course/data-visualizations-using-python-with-data-preparation/learn/
Machine Learning with Python Course (Modeling and Evaluation)
Data Science is a very hot trend now. This course will equip you with machine learning and Evaluation knowledge, with the use of Python programming language. This course is a step up from "Create Your Calculator: Learn Python Basics Fast" Course.
Read More: https://www.udemy.com/course/machine-learning-with-python-u/learn/
Learn Microsoft Excel Basics Fast
Have you ever wanted to learn Microsoft Excel, this course is for you. This course is specially designed for you to quickly and easily gain all the fundamental skills of Excel This is a bite sized course.
Read More: https://www.udemy.com/course/learn-microsoft-excel-basics-fast/learn/lecture/13992282
Learn Data Analysis using Microsoft Excel Basics Fast
Have you ever wanted to learn Microsoft Excel and Data Analysis. This course is specially designed for you to quickly and easily gain all the fundamental skills of Microsoft Excel This is a bite sized course.
Read More: https://www.udemy.com/course/learn-data-analysis-using-microsoft-excel-basics-fast/learn/
Read the full article
1 note
·
View note
Text
Data Science Certificates that is Low Cost
Before we look at the Certifications, we look at What is Data Science, Data Mining, Data Analysis.
What is Data Science and Data Mining?
What is CRISP DM? For Data Mining process, we usually use CRISP DM data mining process:

Based on: https://www.datascience-pm.com/crisp-dm-2/
Data Mining process steps includes Business Understanding, Data Understanding, Data Preparation, Modeling, Evaluation, Deployment.
- Business Understanding step - we need to understand the business and establish the question we need to answer for the data mining
- Data Understanding step - we need to understand the data. We can use statistics such as descriptive, regression analysis to understand the data.
- Data Preparation step - it is the cleaning of the data and we can remove duplicates here.
- Modeling step - we create clustering models, prediction models, classification models.
- Evaluation step - we evaluate which models is more accurate and select.
- Deployment steps - we can create data products.
For Data Science, at the Deployment steps, we create data products for businesses. We can create softwares that predicts something. In the table, the goal is to build data products for a business.
For Data Mining, at the Deployment steps, we create reports or PowerPoints slides on our results. In the table, the goal is to extracting important information.
Read More on CRISP DM: http://edatascience.great-site.net/2023/03/08/what-is-crisp-dm/
Data Analysis Process
What is Data Analysis Process? The following is the summary of Data Analysis process:
Identify - You need to identify why you need data analysis in the first place?
Collect - As the name suggest, this is the step you collect data.
Analyse - To analyze data, you can use descriptive statistics (mean, median, …), inferential statistics, data visualizations (charts) to analyze the data.
Interpret - It is time to interpret your results. Write report.
Read more: http://edatascience.great-site.net/2023/03/09/what-is-data-analysis-process/
Coursera and IBM Professional Certificate in Data Science (Python, SQL)
The author also have this certificate. This programme has 9 courses that will provide you with job ready skills, including open source tools, Python, SQL, data visualization, data analysis, statistic, predictive modeling, and machine learning. You will learn data science through hands-on practice. Upon completion of these courses, you will have built a portfolio to provide you with confidence to go into data science. In addition to earning a professional certificate, you will receive a digital badge from IBM. The courses are ACE® recommended, you can earn 12 college credits and the credits can transfer to your University, which is up to your University to approve.
https://www.coursera.org/professional-certificates/ibm-data-science
Coursera and IBM Professional Certificate Data Analysis
This professional certificate does not require prior programming skills, and is suitable for learners without degrees. Upon successful completion of this program, you will be able to analyze real world datasets, create interactive dashboards, present reports. It will give you the confidence and the portfolio to start a career as junior data analyst. This program is ACE® recommended - you can earn 12 college credits and the credits can transfer to your University, which is up to your University to approve.
Many university does not teach Microsoft Excel for Data Science, hence, this programme is good if you want to know more about Excel.
https://www.coursera.org/professional-certificates/ibm-data-analyst
Coursera and Google Professional Certificate in Data Analytics (Spreadsheets, SQL, Tableau, R)
Data Analysis has Identify, Collect, Clean, Analyze, Intepret. This programme has eight courses - Foundations: Data, Data Everywhere course, Ask Question to make Data Decision course (Identify), Prepare Data for Exploration course (Collect, Clean), Process Data from Dirty to Clean course (Clean), Analyze Data to Answer Question (Analyze), Share Data Through the Art of Visualization (Analyze), Data Analysis with R Programming, Google Data Analytics Capstone. You will learn from Google Employees and you can complete the certificate in less than 6 months. The certificate will prepare you for jobs that includes junior data analyst, data adminsitrator and more. Upon completion of the certificate, you can directly apply for jobs with Google, and over 150 US employers.
According to Google, 75% of Google Career Certificate Graduates in the United States report an improvement in their career trajectory (e.g. new job or career, promotion or raise) within 6 months of certificate completion²
https://www.coursera.org/professional-certificates/google-data-analytics
EdX and Harvard University Professional Certificate in Data Science (R Programming)
When we say case studies, we are studying MBA degree. Read more:
https://www.onlinemanipal.com/blogs/mba-case-studies This programme uses case study. In each course, Harvard University use motivating case studies, ask specific questions, and learn by answering these through data analysis. Case Studies include Trends in World Health and Economics, US Crime Rates, The Financial Crisis of 2007 to 2008, Election Forecasting.
The HarvardX Data Science program prepares you with necessary knowledge and skills to tackle real world challenges. The program consists of probability, inference, regression, machine learning, and R programming. Data wrangling with dplyr, data visualization with ggplot2, version control with GitHub, reproducible document preparation with RStudio.
Read More on dplyr, ggplot2: http://edatascience.great-site.net/2023/03/12/what-are-they-dplyr-ggplot2-caret-rmarkdown-r-libraries/
https://www.edx.org/professional-certificate/harvardx-data-science
EdX and Harvard University Professional Certificate in Learn Python for Data Science (Python)
This professional Certificate has three courses – CS50’s Introduction to Programming with Python course, Fat Chance: Probability form the Ground Up course, Introduction to Data Science with Python course. This profession Certificate focuses on hands-on learning, and each course will build upon each other, preparing you to solve complex challenges using data analysis. No Prior programming experience is required. Taught by experts in the field, you will learn the foundations of Python and statistics before moving to more advanced Python for machine learning and AI. You will use libraries such as Pandas, numPy, matplotlib, and SKLearn.
Read more on Pandas, matplotlib, sklearn: http://edatascience.great-site.net/2023/03/12/92/
https://www.edx.org/professional-certificate/harvardx-learning-python-for-data-science
EdX and Rochester Institute of Technology Professional Certificate in Data Analysis for Decision Making (Excel, Tableau)
This programme has three courses - Data Literacy Foundations course, Data Processing and Analysis with Excel course, and Data Representation and Visualization in Tableau course. Data Literacy Foundations course teaches about leader in data driven decision making. Data Processing and Analysis with Data course teaches Microsoft Excel to organize and clean data so that it can be analyzed. Data Representation and Visualization in Tableau course teaches Tableau to explore data and discovers insights.
Many university does not teach Microsoft Excel for Data Science, hence, this programme is good if you want to know more about Excel and Tableau.
https://www.edx.org/professional-certificate/ritx-data-analysis-for-decision-making
SVBook Certified Data Miner using Python
SVBook Certified Data Miner using Python are given to people who have completed the following courses:
- Create Your Calculator: Learn Python Programming Basics Fast (Python Basics)
- Applied Statistics using Python with Data Processing (Data Understanding and Data Preparation)
- Advanced Data Visualizations using Python with Data Processing (Data Understanding and Data Preparation)
- Machine Learning with Python (Modeling and Evaluation)
and passed a 50 questions. The four courses are created to help learner understand about Python programming basics, then applied statistics (descriptive, inferential, regression analysis) and data visualizations (bar chart, pie chart, boxplot, scatterplot matrix, advanced visualizations with seaborn, and Plotly interactive charts ) with data processing basics to understand more about the the data understanding and data preparation stage of IBM CRISP DM model. Learner will then learn about machine learning and confusion matrix, which is the modeling and evaluation stages of the IBM CRISP DM model. Learner will be able
http://emhacademy.great-site.net/?i=1
SVBook Certified Data Miner using R
SVBook Certified Data Miner using R are given to people who have completed the following courses:
- Create Your Calculator: Learn R Programming Basics Fast (R Basics)
- Applied Statistics using R with Data Processing (Data Understanding and Data Preparation)
- Advanced Data Visualizations using R with Data Processing (Data Understanding and Data Preparation)
- Machine Learning with R (Modeling and Evaluation)
and passed a 50 questions Exam. The four courses are created to help learner understand about R programming basics, then applied statistics (descriptive, inferential, regression analysis) and data visualizations (bar chart, pie chart, boxplot, scatterplot matrix, advanced visualizations with ggplot2) with data processing basics to understand more about the the data understanding and data preparation stage of IBM CRISP DM model. Learner will then learn about machine learning and confusion matrix, which is the modeling and evaluation stages of the IBM CRISP DM model. Learner will be able to do data mining project after learning the courses.
http://emhacademy.great-site.net/?i=1
If you want to learn more about data science, you can go to http://svbook.great-site.net/?i=1
SVBook Pte. Ltd. assists people to know What is Data Science, Text Analysis, Text Mining, Text Analytics, AI and Machine Learning, process of data, Data Mining to Insights Process using CRISP DM. Data Mining Process Steps includes Business Understanding, Data Understanding, Data Preparation, Modeling, Evaluation, Deployment.
DSTK.Tech (https://dstk2.sourceforge.io/) creates tools and technologies for Data Science, develops open source tools for data science.
EMHAcademy (http://emhacademy.great-site.net/) offers courses to help people become Certified Data Scientist.
Thanks for readings.
Kind Regards,
Eric Goh
Buy me a cup of coffee:https://www.buymeacoffee.com/gohminghui
Read the full article
0 notes
Text
Top 10 Data Science Tools
What is Data Science and Data Mining?
What is CRISP DM? For Data Mining process, we usually use CRISP DM data mining process:

Based on: https://www.datascience-pm.com/crisp-dm-2/
Data Mining process steps includes Business Understanding, Data Understanding, Data Preparation, Modeling, Evaluation, Deployment.
- Business Understanding step - we need to understand the business and establish the question we need to answer for the data mining
- Data Understanding step - we need to understand the data. We can use statistics such as descriptive, regression analysis to understand the data.
- Data Preparation step - it is the cleaning of the data and we can remove duplicates here.
- Modeling step - we create clustering models, prediction models, classification models.
- Evaluation step - we evaluate which models is more accurate and select.
- Deployment steps - we can create data products.
For Data Science, at the Deployment steps, we create data products for businesses. We can create softwares that predicts something. In the table, the goal is to build data products for a business.
For Data Mining, at the Deployment steps, we create reports or PowerPoints slides on our results. In the table, the goal is to extracting important information.
Read More on CRISP DM: http://edatascience.great-site.net/2023/03/08/what-is-crisp-dm/
Data Analysis Process
What is Data Analysis Process? The following is the summary of Data Analysis process:

Identify - You need to identify why you need data analysis in the first place?
Collect - As the name suggest, this is the step you collect data.
Analyse - To analyze data, you can use descriptive statistics (mean, median, …), inferential statistics, data visualizations (charts) to analyze the data.
Interpret - It is time to interpret your results. Write report.
Read more: http://edatascience.great-site.net/2023/03/09/what-is-data-analysis-process/
SPSS Statistics
SPSS Statistics is a statistical software developed by IBM for data management, advanced analytics, business intelligence. It was released by SPSS Inc., and acquired by IBM in 2009. The software name was originally stood for Statistcal Package for the Social Science (SPSS), and later changed to Statistical Products and Service Solutions (SPSS).
SPSS Modeler
SPSS Modeler is a data mining and text analytics software applications that is able to build predictive models and conduct analysis tasks. It has a visual interface which allows users to leverage on statistical and machine learning algorithms without programming. SPSS Modeler was originally named Clementine and SPSS later changed the name to SPSS Clementine, and then later PASW Modeler. IBM acquisition of SPSS in 2009, the product is renamed
SPSS Modeler.
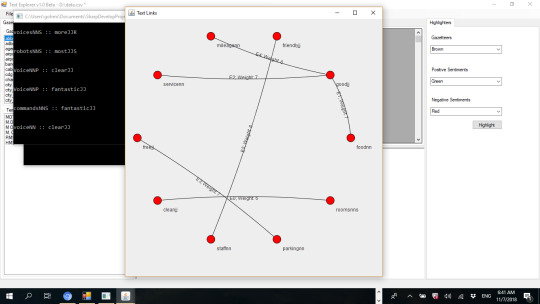
Text Link Analysis in SPSS Modeler.

Extracted from: https://beyondthearc.com/ai-ml-nlp-consulting/ibm-spss-modeler
The author developed DSTK – Data Science Toolkit software which includes text link analysis also:
SAS Enterprise Miner
SAS Enterprise Miner is a software that reveal insights develop models quickly, understand key relationships, find the patterns that matters most. Business users and subject matters experts with limited skill in programming and statistics can generate their own models and analytics results are displayed in easy to understand charts. Create better preforming models using algorithms, and automate model deployment.
RapidMiner
RapidMiner is a popular data science platform that has ability in data preparation, data understanding, prediction modeling and Evaluation, deployment. Weka can be integrated into RapidMiner. You can acquire and load and analyze any data format, structured or unstructured, and data preparation ability can deliver refined dataset for prediction modeling. RapidMiner has data understanding and data visualization abilities, and can use Weka for prediction modeling.
Course: http://emhacademy.great-site.net/
Book: https://leanpub.com/aquickguidetodtaaminingusingrapidminerandweka
KNIME
Konstanz Information Miner, KNIME, is an open source platform that has the abilities of data analysis, integration, and reporting. KNIME has two aspects – create data science and productize data science. Creating data science involves data analysis and visualizations, productize involves create software from models.
The KNIME comes with two tools – KNIME Analytics Platform and KNIME server.
The KNIME Analytics Platform is opens source and allows to analyze data and develop data science workflow.
The KNIME server is commercial platform allows to automate, manage and deploy data science workflows.
WEKA
Waikato Environment for Knowledge Analysis (WEKA) is an open source software that has features of data processing, machine learning, and data visualization. Weka allows you to build solutions by successful implementation of machine learning algorithms in real world problems. Weka machine learning algorithms known as classifier, can be implemented to data using GUI without programming. Weka can be integrated into R, Python, RapidMiner, Java. I would suggest using Tableau for data visualizations. Weka is best for machine learning.
Course: http://emhacademy.great-site.net/
Book: https://leanpub.com/aquickguidetodtaaminingusingrapidminerandweka
Tableau
Tableau is a data visualization software that has features for data understanding and Analysis by creating interactive charts. You can use Plotly to create interactive charts, but you need to programming. Tableau can connect to OLAP, databases, Excel and other data sources and includes analytics tools for forecasting and getting business insights. You can create graphs, charts or other types of visualizations for your data science projects.
MatLab
Matlab is a powerful software for mathematical and statistical computing. Matlab has libraries for creating plots for data understanding. Matlab is useful for learning data science and is great way to transit to deep learning. Open source alternative for Matlab is SciLab.
DSTK – Data Science Toolkit 3
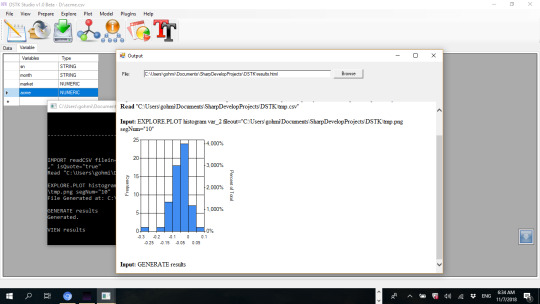
DSTK - Data Science Toolkit 3 is a set of data and text mining softwares, following the CRISP DM model. DSTK offers data understanding using statistical and text analysis, data preparation using normalization and text processing, modeling and evaluation for machine learning and statistical learning algorithms. It is based on the old version DSTK at https://sourceforge.net/projects/dstk2/ ChartPlotter is a New Addition to the DSTK softwares, and it allows you to build interactive Plotly JS charts and dashboards in minutes, using only mouse clicks. DSTK Studio allows you to build recommendation and prediction data products.
Read More: https://dstk2.sourceforge.io/
If you want to learn more about data science, you can go to http://svbook.great-site.net/?i=1
SVBook Pte. Ltd. assists people to know What is Data Science, Text Analysis, Text Mining, Text Analytics, AI and Machine Learning, process of data, Data Mining to Insights Process using CRISP DM. Data Mining Process Steps includes Business Understanding, Data Understanding, Data Preparation, Modeling, Evaluation, Deployment.
DSTK.Tech (https://dstk2.sourceforge.io/) creates tools and technologies for Data Science, develops open source tools for data science.
EMHAcademy (http://emhacademy.great-site.net/) offers courses to help people become Certified Data Scientist.
Thanks for readings.
Kind Regards,
Eric Goh
Buy me a cup of coffee:https://www.buymeacoffee.com/gohminghui
Reference:
- https://www.projectpro.io/article/most-popular-data-science-tools/586
- https://www.sas.com/en_us/software/enterprise-miner.html
- https://en.m.wikipedia.org/wiki/SPSS
- https://en.m.wikipedia.org/wiki/SPSS_Modeler
- https://beyondthearc.com/ai-ml-nlp-consulting/ibm-spss-modeler
Read the full article
0 notes
Text
Welcome to eDataScience.
Welcome to eDataScience.
Through this blog, I want to create a community which dedicates itself in the study of Data Science. I will share my learning and tips on Data Science through this blog.
Why study Data Science?
Have you ever wonder how your mobile phone suggests you the news to read? How can YouTube use the data in your mobile phone to suggest videos for you to watch? How can Lazada store suggests you the products?
All these are data science at work in real time. Prediction models and classifications models trained using your mobile phone data is used to predict the news, videos and products.
According to SAS, the five reasons to learn Data Science are:
Gain problem solving skills
The ability to think analytically and approach problems in the right way is a skill that is very useful in the professional world and everyday life.
High demand
Data Analysts and Data Scientists are valuable. With a looming skill shortage as more and more businesses and sectors work on data, the value is going to increase.
Analytics is everywhere
Data is everywhere. All company has data and need to get insights from the data. Many organizations want to capitalize on data to improve their processes. It's a hugely exciting time to start a career in analytics.
It's only becoming more important
With the abundance of data available for all of us today, the opportunity to find and get insights from data for companies to make decisions has never been greater. The value of data analysts will go up, creating even better job opportunities.
A range of related skills
The great thing about being an analyst is that the field encompasses many fields such as computer science, business, and maths. Data analysts and Data Scientists also need to know how to communicate complex information to those without expertise.
According to Harvard Business Review (October 2012 edition), job of a data scientist is the sexiest job of 21st century.
There is a shortage of Data Scientist in the World.
According to the McKinsey Global Institute (In a May 2011 report): “By 2018, the United States alone could face a shortage of 140,000 to 190,000 people with deep analytical skills as well as 1.5 million managers and analysts with the know-how to use the analysis of big data to make effective decisions.”
I aim to provide as many resources to learn Data Science. These resource can be:
- Training and Tutorials (http://www.emhacademy.great-site.net)
- Books (http://www.SVBook.great-site.net)
- Softwares (http://dstk2.sourceforge.io)
- Tips and Tricks
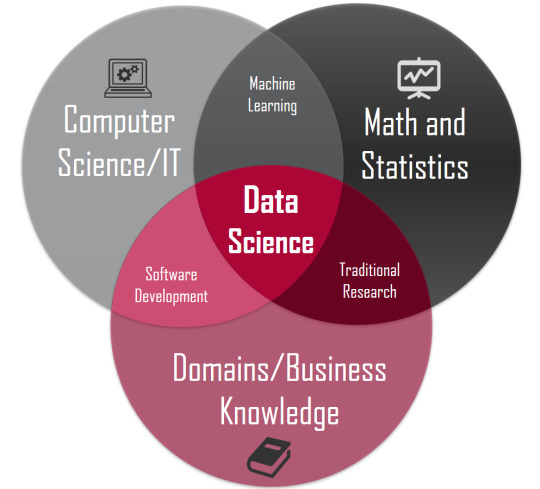
According to Indian Institute of Technology, IIT Madras, Data Science is a blend of Computer Science, Statistics, and Business.

Extracted from: https://ge.iitm.ac.in/I2MP/data-science/
Computer Science, the author has Masters of Technology degree from National University of Singapore (ranked top 11 in QS World University Ranking)
Opencert file: Click here
Business, the author has Executive Masters of Business Administration degree in IT Management from U21Global and IGNOU (World largest University)
Click here
Statistics, the author has Rice University and Coursera Specialization Certificate in Business Statistics and Analysis. Rice University is the Top 15 University in USA ranked by U.S. News and World Report
Click here
For experience, the author is a data science lecturer at Kaplan and faculty at the University of the People, and has been in QS World University Ranking project in Nanyang Technological University (NTU). From 2015 to 2018, when the author was in Nanyang Technological University, NTU's QS World University Ranking did not fall. NTU is ranked top 12 in QS World University Ranking.
The author profile: https://gohminghui88.github.io
CRISP DM

If you want to learn more about data science, you can go to http://svbook.great-site.net/?i=1
SVBook Pte. Ltd. assists people to know What is Data Science, Text Analysis, Text Mining, Text Analytics, AI and Machine Learning, process of data, Data Mining to Insights Process using CRISP DM. Data Mining Process Steps includes Business Understanding, Data Understanding, Data Preparation, Modeling, Evaluation, Deployment.
DSTK.Tech (https://dstk2.sourceforge.io/) creates tools and technologies for Data Science, develops open source tools for data science.
EMHAcademy (http://emhacademy.great-site.net/) offers courses to help people become Certified Data Scientist.
Thanks for readings.
Kind Regards,
Eric Goh
References:
- https://www.sas.com/en_au/insights/articles/analytics/5-reasons-why-everybody-should-learn-data-analytics.html
- https://www.analyticsvidhya.com/blog/2013/04/analytics-vidhya/
Read the full article
0 notes
Text
What are they? Data Science, Data Mining, Text Mining, Data Analysis, Big Data…
When you first go into data science, you will hear terminologies or words like data science, data mining, text mining, data analysis, and big data. What are they? They are confusing.
This article will describe on what is Data Science, Data Mining, Text Mining, Data Analysis, and Big Data and what are their differences.
The first part of this article will be on definitions of Data Science, Data Mining, Text Mining, Data Analysis, Big Data. The second part of this article will then look into Data Science vs Data Mining, Data Mining vs Text Mining, Data Mining vs Data Analysis, then Data Analysis vs Text Analysis. The third will be a conclusion.
Data Science Definition
According to Amazon, Data Science is the study of data to extract insights from data. It is a multidisciplinary field that combines statistics, computer science and business. The data science analysis helps data scientist to ask and answer questions like what happened (descriptive), why it happened, what will happened (predictive).

Extracted: https://ge.iitm.ac.in/I2MP/data-science/
Data Mining Definition
Data Mining is the process of sorting through datasets to get insights that can solve business problems. Data mining techniques enable enterprises to predict future trends and make business decisions. Data Mining usually deals with numbers, but you may argue that text data is also in data mining. The data mining to insights process is usually the CRISP DM. The data mining process steps for CRISP DM are Business Understanding, Data Understanding, Data Preparation, Modeling, Evaluation, Deployment.

You can read more on CRISP DM: What is CRISP DM?
Text Mining Definition
Text Mining, also known as text data mining, is the process of transforming unstructured text into structured format to get insights that can solve business problems. While data mining usually deals with numerical data, text mining deals with text data. Text mining also enables enterprises to predict future tends.
Data Analysis Definition
Exploratory Data Analysis, EDA and Data Science are dealing with data. According to Simplilearn and EduCBA, Data Analysis is the process of cleaning, processing of data, and extracting relevant information that helps business to make informed decisions. Methodologies involved in doing so can be Descriptive Analysis and Exploratory Analysis.
Big Data Definition
According to Oracle, Big Data means data contains greater Variety, arriving in increasing Volumes, and with more Velocity.
3 Vs of Big Data
Volume:
It means the data is high volume. For some organizations, this can be tens of terabyes of data, for others, it can be hundreds of petabytes.
Velocity:
Velocity is the fast rate at which data is received. Some internet enabled smart products operate in real time and data is received in real time.
Variety:
Variety refers to many types of data. Big Data comes in unstructured data types such as text, audio, video and etc.
Extracted: http://napitupulu-jon.appspot.com/posts/hadoop-bigdata-ud617/
Data Science vs Data Mining
Data Science usually has a goal of creating data products for businesses. Data Mining usually has a goal of extracting important information.
According to Geeks for Geeks, Data Science and Data Mining can summarized as follows:
S/N Data ScienceData Mining1Data Science is an AreaData Mining is a Technique2It is about collection, processing, analyzing of data. It is more conceptual. It is about extracting the information from the data.3It is a field of study just like the Computer Science. It is a multidisciplinary field that contains Computer Science, Business, Statistics.It is a technique.4The goal is to build data products for a business.The goal is to extracting important information.5It deals with the all types of data, structured, unstructured or semi structured.It deals with structured forms of data.6It is a super set of data mining.It is a subset of Data Science.7It is mainly used for scientific purposes.It is mainly used for business purposes.8It broadly focuses on the science of the data.It is more involved with the processes.
For more simple, the author will usually use the CRISP DM to explain data science and data mining.
For Data Mining process, we usually use CRISP DM data mining process:
Extracted from: https://www.datascience-pm.com/crisp-dm-2/
Data Mining process steps includes Business Understanding, Data Understanding, Data Preparation, Modeling, Evaluation, Deployment.
- Business Understanding step - we need to understand the business and establish the question we need to answer for the data mining
- Data Understanding step - we need to understand the data. We can use statistics such as descriptive, regression analysis to understand the data.
- Data Preparation step - it is the cleaning of the data and we can remove duplicates here.
- Modeling step - we create clustering models, prediction models, classification models.
- Evaluation step - we evaluate which models is more accurate and select.
- Deployment step - we can create reports.
For Data Science, at the Deployment steps, we create data products for businesses. We can create softwares that predicts something. In the table, the goal is to build data products for a business.
For Data Mining, at the Deployment steps, we create reports or PowerPoints slides on our results. In the table, the goal is to extracting important information.
Data Mining vs Data Analysis
To know more about data mining and data analysis, we can look into data mining process and data analysis process.
Data Mining process, we usually use CRISP DM:
Extracted from: https://www.datascience-pm.com/crisp-dm-2/
Data Mining process steps includes Business Understanding, Data Understanding, Data Preparation, Modeling, Evaluation, Deployment.
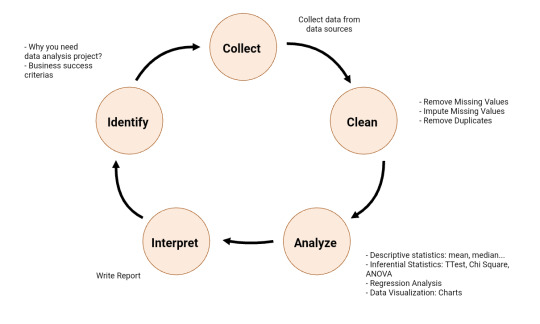
Data Analysis Process

Extracted from: https://www.datapine.com/blog/data-analysis-methods-and-techniques/
In Data Analysis Process, “Identify” step is to establish the question you need to answer for the data analysis, “Collect” step is to collect needed data, “Clean” step is the cleaning of the data with remove duplicates and etc., “Analyze” step is to analyze the data with statistics such as descriptive statistics (mean, median, …), and “Interpret” step is to write report for analysis.
In DM, if we change from “Business Understanding -> Data Understanding -> Data Preparation” to “Business Understanding -> Data Preparation -> Data Understanding”, meaning we do data cleaning first then analyze the data, it will be like Data Analysis Process “Clean -> Analyze”.
So from CRISP DM, we see that Data Mining has modeling step, which means data mining enables enterprises to predict future tends. Data Analysis do not have prediction.
Data Analysis vs Text Analysis
You can say Data Analysis is the large category that encapsulates Text Analysis. To make it simple, Data Analysis is usually for numerical data. Text Analysis is usually for textual data. Data Analysis get insights that can solve business problems. Text Analysis also get insights to solve business problems. Text Analysis, however, does not predict future trends. Data Analysis, however, also do not predict future trends.
Data Mining vs Text Mining
You can say Data Mining is the large category that encapsulates Text Mining. To make it simple, Data Mining is usually for numerical data. Text Mining is usually for textual data. Data Mining get insights that can solve business problems. Data mining techniques enable enterprises to predict future trends and make business decisions. Text Mining also get insights from textual data. Text Mining techniques enable enterprises to predict future trend. Text Analysis, however, does not predict future trends. Data Analysis, however, also do not predict future trends.
If you want to learn more about data science, you can go to http://svbook.great-site.net/?i=1
SVBook Pte. Ltd. assists people to know What is Data Science, Text Analysis, Text Mining, Text Analytics, AI and Machine Learning, process of data, Data Mining to Insights Process using CRISP DM. Data Mining Process Steps includes Business Understanding, Data Understanding, Data Preparation, Modeling, Evaluation, Deployment.
DSTK.Tech (https://dstk2.sourceforge.io/) creates tools and technologies for Data Science, develops open source tools for data science.
EMHAcademy (http://emhacademy.great-site.net/) offers courses to help people become Certified Data Scientist.
Thanks for readings.
Kind Regards,
Eric Goh
References:
- https://aws.amazon.com/what-is/data-science/
- https://www.ibm.com/topics/text-mining
- https://www.datapine.com/blog/data-analysis-methods-and-techniques/
- https://www.oracle.com/sg/big-data/what-is-big-data/
- https://www.simplilearn.com/data-analysis-methods-process-types-article
- https://www.educba.com/types-of-data-analysis/
- https://www.geeksforgeeks.org/difference-between-data-science-and-data-mining/
- http://napitupulu-jon.appspot.com/posts/hadoop-bigdata-ud617/
Read the full article
0 notes
Text
What is CRISP DM?
CRISP-DM is created by IBM, stands for Cross-Industry Standard Process for Data Mining, is an industry proven way for data mining. Data Mining to insights process is CRISP DM.

Extracted from: https://www.ibm.com/docs/it/spss-modeler/saas?topic=dm-crisp-help-overview
The CRISP DM’s 6 data mining process steps are Business Understanding, Data Understanding, Data Preparation, Modeling, Evaluation, and Deployment. The arrows indicates frequent dependencies between the steps, but the sequence of the steps is not strict and can move back and forth between steps when necessary. Hence, you can change from “Data Understanding -> Data Preparation” to “Data Preparation -> Data Understanding”, meaning we do data cleaning first then analyze the data.
Business Understanding Step
Before working on the CRISP DM, you should explore what your organization expect to gain from the data mining project. Try to involve as many key people as possible and the final step is to produce a project plan.
- Determine Business Objectives: Describe the problem you want to solve, specify all business questions as precise as possible, Determine any other business requirements, specify expected benefits in business
- Assessing the situations
- Determining Data Mining Goals: business success criterias
- Producing a Project Plan: Sample Project Plan - https://www.ibm.com/docs/en/spss-modeler/saas?topic=plan-sample-project
Data Understanding
The Data Understanding Step involves taking a closer look at the data available.
- Collecting Initial Data: Data come from existing data, purchased data, additional data
- Describing Data: Amount of Data, Variables Types (numeric, categorical, boolean)
- Exploring Data: Data Visualizations, Descriptive Statistics (mean, median, …) , Inferential Statistics (TTest, ANOVA, …), Regression Analysis
- Verify Data Quality:Missing Values, Duplicates, Data Errors, Measurement Errors
Data Preparation
Data Preparation is most time consuming aspects in data mining. In fact, it is estimated 50% to 70% of a project time and effort is on data preparation data mining process steps. Devoting adequate time on Business Understanding step and Data Understanding step can minimize the time in Data Preparation step.
- Selecting Data: Random sampling on data, select attributes, select items….
- Cleaning Data: remove missing values, remove duplicates, coding inconsistencies, …
- Constructing new Data: create new data, deriving attributes, generating records
- Integrating Data: Extract, Transform and create new data, merging data, appending data
- Formatting Data: Format the data to be ready for modeling. Does the prediction models require a particular data Format or order?
Is the data ready for modeling.
Modeling
Data miners usually run several models using default parameters and fine tune parameters or go to data preparation step to create a model. Models can be classification models, prediction models or clustering models. Clustering groups data together into clusters, can be in data understanding. Clustering can also be in modelings.
- Selecting models: machine learning algorithm selection is based on data types available, data mining goals, specific modeling requirements.
- Generating test designs: Consider how the models results will be tested. describe the criteria for “goodness” of a model, defining data on which these criteria will be tested
- Building models: Experiment with a number of different models.
- Assessing models: take a closer look at the models, which are accurate or effective to be final.
Models are built correct and effective according to data mining success criteria defined in previous step.
Evaluation
Evaluate results of your models using business success criterias. Two types of results can be models selected or inferences drawn from models.
- Evaluating the results: project results meets business success criterias in Business understanding step?
- Review Process: time for reflection on the successes and weaknesses of the project
- Determining the next steps: continue to deployment phase? Go back and refine models?
Deployment
Deployment can be create a software for company using the prediction models. Create software is usually for data science. Deployment can also be writing reports with insights gained from data mining. Writing reports with insights are usually for data mining.
- Planning for deployment
- Planning Monitoring and Maintainence: full-fledged deployment, your data mining models may be ongoing.
- Producing final report
- Conducting a Final project review: Reflect on lessons learned during the data mining process
If you want to learn more about data science, you can go to http://svbook.great-site.net/?i=1
SVBook Pte. Ltd. assists people to know What is Data Science, Text Analysis, Text Mining, Text Analytics, AI and Machine Learning, process of data, Data Mining to Insights Process using CRISP DM. Data Mining Process Steps includes Business Understanding, Data Understanding, Data Preparation, Modeling, Evaluation, Deployment.
DSTK.Tech (https://dstk2.sourceforge.io/) creates tools and technologies for Data Science, develops open source tools for data science.
EMHAcademy (http://emhacademy.great-site.net/) offers courses to help people become Certified Data Scientist.
Thanks for readings.
Kind Regards,
Eric Goh
References
https://www.ibm.com/docs/en/spss-modeler/saas?topic=guide-introduction-crisp-dm
Read the full article
0 notes
Text
What is Data Analysis Process?

Based on: https://www.datapine.com/blog/data-analysis-methods-and-techniques/
Identify
You need to identify why you need data analysis in the first place? The identification step is the you establish the question you need to answer. Identify step is like Business Understanding step in CRISP DM Process. To know more about CRISP DM, you can see: http://edatascience.great-site.net/2023/03/08/what-is-crisp-dm/
- Determine Business Objectives: Describe the problem you want to solve, specify all business questions as precise as possible, Determine any other business requirements, specify expected benefits in business
- Assessing the situations
- Determining Data Mining Goals: business success criterias
- Producing a Project Plan: Sample Project Plan - https://www.ibm.com/docs/en/spss-modeler/saas?topic=plan-sample-project
Collect
As the name suggest, this is the step you collect data. The collection of data can come from internal or external sources, survey, interviews, questionnaires, and focus groups. The data can also come from ETL - Extract data from difference databases, Transform the data, and Load the data into data warehouse.
Clean
Once you have data, you can clean it and leave it ready for analysis. In Clean step, you can remove missing values, remove duplicates, it is like data preparation step in CRISP DM.
- Selecting Data: Random sampling on data, select attributes, select items….
- Cleaning Data: remove missing values, remove duplicates, coding inconsistencies, …
- Constructing new Data: create new data, deriving attributes, generating records
- Integrating Data: Extract, Transform and create new data, merging data, appending data
- Formatting Data: Format the data to be ready for modeling. Does the prediction models require a particular data Format or order?
Analyse
To analyze data, you can use descriptive statistics (mean, median, …), inferential statistics, data visualizations (charts) to analyze the data. You can use the three analytics: descriptive analytics, predictive analytics, prescriptive analytics. Descriptive Analytics is used to answer the question of what happened. You can use descriptive statistics in descriptive analytics. Predictive Analytics is used to answer What will happen. You can use modeling step in data mining to create prediction models. Predictive Analytics is usually for data mining. Prescriptive Analytics is use to answer How will it happen. Lets say you have a regression model y = 3x1 + 4x2 +12, and you want outcome y = 456. You try to find the value for x1 and x2.
Interpret
It is time to interpret your results. You can review the results to see whether it meets business success criterias. Identify the best results to demonstrate insights based on analysis and communicate results. To write good report, you can see: https://www.modernanalyst.com/Resources/Articles/tabid/115/ID/6070/Writing-a-Good-Data-Analysis-Report-7-Steps.aspx
If you want to learn more about data science, you can go to http://svbook.great-site.net/?i=1
SVBook Pte. Ltd. assists people to know What is Data Science, Text Analysis, Text Mining, Text Analytics, AI and Machine Learning, process of data, Data Mining to Insights Process using CRISP DM. Data Mining Process Steps includes Business Understanding, Data Understanding, Data Preparation, Modeling, Evaluation, Deployment.
DSTK.Tech (https://dstk2.sourceforge.io/) creates tools and technologies for Data Science, develops open source tools for data science.
EMHAcademy (http://emhacademy.great-site.net/) offers courses to help people become Certified Data Scientist.
Thanks for readings.
Kind Regards,
Eric Goh
Reference
https://www.datapine.com/blog/data-analysis-methods-and-techniques/
https://www.modernanalyst.com/Resources/Articles/tabid/115/ID/6070/Writing-a-Good-Data-Analysis-Report-7-Steps.aspx
https://www.slideteam.net/data-analysis-process-for-visualization-and-presentation.html

Read the full article
0 notes
Text
What are they? Pandas, MatPlotLib, Scikit-Learn, Jupyter Notebook... Python Libraries
When you first go into data science, you will hear terminologies or words like Pandas, MatPlotLib, Scikit-Learn, Jupyter Notebook… What are they? They are confusing. They are Python Libraries.
This article will describe on what is Pandas, MatPlotLib, Scikit-Learn, Jupyter Notebook and what are their differences.
For Data Mining process, we usually use CRISP DM data mining process:

Extracted from: https://www.datascience-pm.com/crisp-dm-2/
Data Mining process steps includes Business Understanding, Data Understanding, Data Preparation, Modeling, Evaluation, Deployment.
- Business Understanding step - we need to understand the business and establish the question we need to answer for the data mining
- Data Understanding step - we need to understand the data. We can use statistics such as descriptive, regression analysis to understand the data.
- Data Preparation step - it is the cleaning of the data and we can remove duplicates here.
- Modeling step - we create clustering models, prediction models, classification models.
- Evaluation step - we evaluate which models is more accurate and select.
- Deployment steps - we can create data products.
For Data Science, at the Deployment steps, we create data products for businesses. We can create softwares that predicts something. In the table, the goal is to build data products for a business.
For Data Mining, at the Deployment steps, we create reports or PowerPoints slides on our results. In the table, the goal is to extracting important information.
Read More on CRISP DM: http://edatascience.great-site.net/2023/03/08/what-is-crisp-dm/
Pandas
Pandas is a open source tools for data science. Pandas is a fast, powerful, flexible data manipulation libraries for Python Programming. Pandas is used in Data Preparation step of CRISP DM data mining process steps.
Pandas:
- has fast and efficient dataframe object for data manipulation
- can read and write csv file, excel, sql, databases files
- can reshape and pivot dataset
- can slice, index, subset dataset
- can be allow columns be inserted or deleted
- can aggregate and transform dataset
- can merge and join of dataset
SciPy
- SciPy is a open source tools for data science. SciPy is a Python Library provides algorithms for optimization, integration, interpolation, algebraic equations, differential equation, statistics. SciPy is used in Data Understanding step of CRISP DM data mining process steps.
SciPy allows us to calculate:
- Descriptive statistics (mean, kurtosis, mode, skew, standard deviation, pearson correlation, …)
- Inferential statistics (TTest, Chi Square, Wilcoxon, Kruskal, friedman, shapiro test for normality)
MatPlotLib
- MatPlotLib is a open source tools for data science. MatPlotLib is a Python library for creating interactive data visualizations. MatPlotLib is used in Data Understanding step of CRISP DM data mining process steps.
MaPlotLib:
- can create publication quality plots
- create interactive plots that can zoom and pan
- customize visual and style of plots
- export plots to many file formats.
Scikit Learn
Scikit Learn is a open source tools for data science. Scikit Learn is a Python library for predictive analytics. Scikit Learn is used in Modeling and Evaluation step of CRISP DM data mining process steps.
Scikit Learn:
- Classification: SVM, KNN, Naïve Bayes, Decision Trees
- Regression: Linear Regression, Logistics Regression, KNN
- Clustering: KMeans, Hierarchical Clustering
Jupyter Notebook
Jupyter Notebook is a open source tools for data science. Jupyter Notebook is for Python for creating reports. Jupyter Notebook is used in Deployment step of CRISP DM data mining process steps.
If you want to learn more about data science, you can go to http://svbook.great-site.net/?i=1
SVBook Pte. Ltd. assists people to know What is Data Science, Text Analysis, Text Mining, Text Analytics, AI and Machine Learning, process of data, Data Mining to Insights Process using CRISP DM. Data Mining Process Steps includes Business Understanding, Data Understanding, Data Preparation, Modeling, Evaluation, Deployment.
DSTK.Tech (https://dstk2.sourceforge.io/) creates tools and technologies for Data Science, develops open source tools for data science.
EMHAcademy (http://emhacademy.great-site.net/) offers courses to help people become Certified Data Scientist.
Thanks for readings.
Kind Regards,
Eric Goh
Reference
- https://pandas.pydata.org/about/
- https://matplotlib.org/
- https://scipy.org/
- https://docs.scipy.org/doc/scipy/reference/stats.html
- https://scikit-learn.org/stable/model_selection.html
- https://jupyter.org/
Read the full article
0 notes
Text
What are they? dplyr, ggplot2, caret, RMarkDown… R Libraries
When you first go into data science, you will hear terminologies or words like dplyr, ggplot2, caret, RMarkDown… What are they? They are confusing. They are R libraries.
This article will describe on what is dplyr, ggplot2, caret, RMarkDown and what are their differences.
For Data Mining process, we usually use CRISP DM data mining process:

Based on: https://www.datascience-pm.com/crisp-dm-2/
Data Mining process steps includes Business Understanding, Data Understanding, Data Preparation, Modeling, Evaluation, Deployment.
- Business Understanding step - we need to understand the business and establish the question we need to answer for the data mining
- Data Understanding step - we need to understand the data. We can use statistics such as descriptive, regression analysis to understand the data.
- Data Preparation step - it is the cleaning of the data and we can remove duplicates here.
- Modeling step - we create clustering models, prediction models, classification models.
- Evaluation step - we evaluate which models is more accurate and select.
- Deployment steps - we can create data products.
For Data Science, at the Deployment steps, we create data products for businesses. We can create softwares that predicts something. In the table, the goal is to build data products for a business.
For Data Mining, at the Deployment steps, we create reports or PowerPoints slides on our results. In the table, the goal is to extracting important information.
Read More on CRISP DM: http://edatascience.great-site.net/2023/03/08/what-is-crisp-dm/
dplyr
dplyr is a open source tools for data science. Dplyr is a data manipulation libraries for R Programming. Dplyr is a grammar for data manipulation, and provides a set of verbs to solve the most common data manipulation challenges. dplyr is used in Data Preparation step of CRISP DM data mining process steps.
Verbs of dplyr:
- mutate() add new variables based on some inputs
- select() picks variables based on some inputs
- filter() picks cases based on some inputs.
- summarise() reduces multiple values down to a single summary
- arrange() changes the rows
These all combine with group_by() which allows perform any operation by group.
Statistics
R is a open source tools for data science. R provides algorithms for statistics. R is used in Data Understanding step of CRISP DM data mining process steps.
R allows us to calculate:
- Descriptive statistics (mean, kurtosis, mode, skew, standard deviation, pearson correlation, …)
- Inferential statistics (TTest, Chi Square, Wilcoxon, Kruskal, friedman, shapiro test for normality)
Ggplot2
Ggplot2 is a open source tools for data science. Ggplot2 is a R library for creating data visualizations. GGplot2 is used in Data Understanding step of CRISP DM data mining process steps.
Ggpplot2:
- Is based on Grammar of Graphics
- can create publication quality plots
- customize visual and style of plots
- export plots to many file formats.
Caret
Caret is a open source tools for data science. Caret is a R library for predictive analytics. Caret is used in Modeling and Evaluation step of CRISP DM data mining process steps.
Caret, short for Classification And Regression Training, contains tools for:
- data splitting
- pre-processing
- variable selection
- model tuning using resamling
- variable importance estimation
Models:
- Classification: SVM, KNN, Naïve Bayes, Decision Trees
- Regression: Linear Regression, Logistics Regression, KNN
RMarkDown
RMarkDown is a open source tools for data science. RMarkDown is for R for creating reports. RMarkDown is used in Deployment step of CRISP DM data mining process steps.
Reference:
-
If you want to learn more about data science, you can go to http://svbook.great-site.net/?i=1
SVBook Pte. Ltd. assists people to know What is Data Science, Text Analysis, Text Mining, Text Analytics, AI and Machine Learning, process of data, Data Mining to Insights Process using CRISP DM. Data Mining Process Steps includes Business Understanding, Data Understanding, Data Preparation, Modeling, Evaluation, Deployment.
DSTK.Tech (https://dstk2.sourceforge.io/) creates tools and technologies for Data Science, develops open source tools for data science.
EMHAcademy (http://emhacademy.great-site.net/) offers courses to help people become Certified Data Scientist.
Thanks for readings.
Kind Regards,
Eric Goh
Reference:
- https://ggplot2.tidyverse.org/
- https://topepo.github.io/caret/
- https://www.analyticsvidhya.com/blog/2016/12/practical-guide-to-implement-machine-learning-with-caret-package-in-r-with-practice-problem/
- http://topepo.github.io/caret/available-models.html
- https://rmarkdown.rstudio.com/
Read the full article
0 notes
Text
How to start a Career in Data Science? Data Scientist, Data Analysis, Data Engineer, Machine Learning Engineer. What are they?
What is Data Science?
According to Indian Institute of Technology, IIT Madras, Data Science is a blend of Computer Science, Statistics, and Business.
Extracted from: https://ge.iitm.ac.in/I2MP/data-science/
Data science combines computer science, statistics, business to uncover insights in data. These insights can be used in decision making. In data science, we usually create application or softwares. You can know more about data science, data mining, text mining, data analysis and big data at:
http://edatascience.great-site.net/2023/03/07/what-are-they-data-science-data-mining-text-mining-data-analysis-big-data/
Why Data Science?
Have you ever wonder how your mobile phone suggests you the news to read? How can YouTube use the data in your mobile phone to suggest videos for you to watch? How can Lazada store suggests you the products? All these are data science at work in real time. Prediction models and classifications models trained using your mobile phone data is used to predict the news, videos and products.
According to Harvard Business Review (October 2012 edition), job of a data scientist is the sexiest job of 21st century.
There is a shortage of Data Scientist in the World.
According to the McKinsey Global Institute (In a May 2011 report): “By 2018, the United States alone could face a shortage of 140,000 to 190,000 people with deep analytical skills as well as 1.5 million managers and analysts with the know-how to use the analysis of big data to make effective decisions.”
Data Science Jobs Roles
There are plenty of Data Science Jobs to choose from, all of them are in making business decisions leveraging on data.
Data Scientists
Data Scientist builds models using programming languages like Python, and they can transform models into applications or softwares. This role is advanced version of data analysis. For data scientist, we usually use CRISP DM data mining process.
CRISP DM Process

Based on: https://www.datascience-pm.com/crisp-dm-2/
Read more: http://edatascience.great-site.net/2023/03/08/what-is-crisp-dm/
Skills needed: statistics, machine learning, programming skills,
Education: Bachelor degree
Data Analyst
Data Analyst, unlike data scientist, use data to solve business problems. Using tools like SQL, R, Python, and data visualization, data analyst acquire, clean and analyse data to get insights. They usually bridge the gap between data scientist and business analyst. For data analyst, we usually use data analyst process. For Data Analyst, we usually use the data analysis process. From CRISP DM and Data Analysis Process, you can see what is the differences between Data Analyst and Data Scientist.
Data Analysis Process:

Based on: https://www.datapine.com/blog/data-analysis-methods-and-techniques/
Read More: http://edatascience.great-site.net/2023/03/09/what-is-data-analysis-process/
Skills needed: statistics, programming languages (Python, R, SQL), data visualization
Education: bachelor degree
Data Engineer
Data Engineer prepare and manage large amount of data. They get data ready for data scientist and data analyst to work with. Data Engineer make data accessible to businesses.
Skills needed: programming languages (Java), understanding of NoSQL , and frameworks like Apache Hadoop .
Education: a Bachelor degree
Machine Learning Engineer
This role is not entry level role. Machine Learning algorithm how humans learn and interpret data. As part of a data science team, machine learning engineer research, build and design artificial intelligence that facilitates machine learning.
Skills needed: knowledge of tools such as Spark, Hadoop, R, Python, Tensorflow, Google Cloud Machine Learning Engine. An understanding of data structure, modeling, and quantitative analysis, and computer Science basics is also helpful.
Education: masters’ degree or PhD
How to become Data Scientist?
Step 0: What role you want?
There are data scientist, data analyst, data engineer, machine learning engineer role to choose. They are all in data science. When working in a company, as a data science team, the data scientist and data analyst focus on analyzing data, the data engineer will focus on getting data ready, and machine learning engineer will focus on machine learning algorithms.
Step 1: Earn a Bachelor Degree
A great way to get started into data science is to get a bachelor degree in relevant field such as data science, computer science, business, and statistics.
Step 2: Learn Relevant Programming and Data Science Tools
It is essentials to brush up your programming skills such as Python, R, SQL, SAS, and etc. You should also learn SPSS Statistics, SPSS Modeler, SAS Enterprise Miner as SPSS and SAS are very normal in the industry. You may also learn Microsoft Excel as many companies are still using Microsoft Excel for data analysis.
Step 3: Learn Related Skills
Data Scientist should also have knowledge on Computer Science, Statistics, Business Skills. You may want to learn machine learning, statistics and business decision making skills. Project Management is also important as you will be doing data science projects.
Step 4: Earn Certifications
Tools and skill specified certifications are great way to show your knowledge and expertise. You can become certified data scientist by earning IBM Professional Certificate from Coursera. You can also earn SVBook Certified Data Miner using R, SVBook Certified Data Miner using Python at http://emhacademy.great-site.net/
Step 5: Create Portfolios
A data science portfolio will highlight your expertise in exploratory data analysis, programming, data science. You can create some data science softwares or do some analysis on dataset and put it into a portfolio. You can put on GitHub or Sourceforge. You can use VisualCV or EuroPass to create your CV. How to create data science portfolio: https://www.springboard.com/blog/data-science/data-science-portfolio/
Step 6: Internships
Seek jobs that includes keywords like data analysis, data engineer, data scientist. Internship are great ways to learn hand-ons what is data science jobs.
Step 7: Data Science Entry Level Jobs
Once your internship is over, you can join the company if they want. You can also start looking for entry level data science jobs like data scientist, data analysts, data engineers.
If you want to learn more about data science, you can go to http://svbook.great-site.net/?i=1
SVBook Pte. Ltd. assists people to know What is Data Science, Text Analysis, Text Mining, Text Analytics, AI and Machine Learning, process of data, Data Mining to Insights Process using CRISP DM. Data Mining Process Steps includes Business Understanding, Data Understanding, Data Preparation, Modeling, Evaluation, Deployment.
DSTK.Tech (https://dstk2.sourceforge.io/) creates tools and technologies for Data Science, develops open source tools for data science.
EMHAcademy (http://emhacademy.great-site.net/) offers courses to help people become Certified Data Scientist.
Thanks for readings.
Kind Regards,
Eric Goh
Reference
- https://www.coursera.org/articles/data-science-career
- https://www.simplilearn.com/tutorials/data-science-tutorial/how-to-become-a-data-scientist
- https://www.ibm.com/topics/data-science
Read the full article
0 notes
Text
Attributes, Variables, features, Columns, Observations, Rows, Dependent Variables, Independent Variables. What are they?
When you first go into data science, you will hear terminologies or words like Attributes, Variables, Features, Columns, Observations, Rows, Dependent Variables, Independent Variables… What are they? They are confusing.
For Data Mining process, we usually use CRISP DM data mining process:

Based on: https://www.datascience-pm.com/crisp-dm-2/
Data Mining process steps includes Business Understanding, Data Understanding, Data Preparation, Modeling, Evaluation, Deployment.
- Business Understanding step - we need to understand the business and establish the question we need to answer for the data mining
- Data Understanding step - we need to understand the data. We can use statistics such as descriptive, regression analysis to understand the data.
- Data Preparation step - it is the cleaning of the data and we can remove duplicates here.
- Modeling step - we create clustering models, prediction models, classification models.
- Evaluation step - we evaluate which models is more accurate and select.
- Deployment steps - we can create data products.
For Data Science, at the Deployment steps, we create data products for businesses. We can create softwares that predicts something. In the table, the goal is to build data products for a business.
For Data Mining, at the Deployment steps, we create reports or PowerPoints slides on our results. In the table, the goal is to extracting important information.
Read More on CRISP DM: http://edatascience.great-site.net/2023/03/08/what-is-crisp-dm/
When we say “attributes”, “variables”, “features”, “columns”, “observations”, “rows”, we are at Business Understanding step, Data Understanding step, Data Preparation step. When we say “Dependent Variables” and “Independent Variables”, we are at Modeling step.
When collecting data, each sampled form filled up by people is an observation, and each item in the form is an attribute. For example, in a feedback form:
Feedback Form
What is your age? (years)
What is your gender? (M/F)
Are you married? (Y/N)
Today’s Date
Feedbacks:
____________________________
____________________________
____________________________
Each people filled up the form is an observation, the item in the form is the attributes. Age, Gender, Married, Date is the attributes. Data from the forms are compiled into a data table with observations and attributes.

So, Definitions of data, attributes and observations are:
- Data: Data is a collection of observations and attributes
- Attributes: Attributes, feature, variable, column, or field is the characteristics of an observation.
- Observation: The scientist observed what is happening, collect information and put them as a row in Data.
- Other definitions that are also important
- Categorical variables: A variable used to store discrete, classified values. In shortcut, when there is text in the variable, the variable is usually categorical. For the above data, “Gender”, “Married”, “Date” are categorical variables. Please note, when you see that there is text in your data, or see that there is feedbacks, then you must use text mining. Statistics is maths, statistics is for numbers. You cannot use median formula for text. Categorical variable can be nominal variable, qualitative variable, discrete variable.
- Continuous variables: A variable used to store numerical values. Continuous variable can be quantitative variable, scale variable, interval variable.
- Population and Sample: In studies, we wish to quantify a population. We may wish to know the prevalence of diabetes in the population. When population is small, we can obtain information from the population. A study of entire population is census. However, performing a study of entire population is impractical. Hence, we can perform studies based on subset of population, sample. We can use Random Sampling to get samples.
- Hypothesis: The scientist put forth a educated explanations for observed findings and facts.
- Dependent Variable: the outcome variable of a study.
- Independent Variable: the variables that is thought to influence the outcome.
-
In my article on Modeling: Explain Prediction using Simple Linear Regression y = mx + c (http://edatascience.great-site.net/2023/03/13/modeling-explain-prediction-using-simple-linear-regression-y-mx-c/) , y is the Dependent Variable, x is the independent variable.
If you want to learn more about data science, you can go to http://svbook.great-site.net/?i=1
SVBook Pte. Ltd. assists people to know What is Data Science, Text Analysis, Text Mining, Text Analytics, AI and Machine Learning, process of data, Data Mining to Insights Process using CRISP DM. Data Mining Process Steps includes Business Understanding, Data Understanding, Data Preparation, Modeling, Evaluation, Deployment.
DSTK.Tech (https://dstk2.sourceforge.io/) creates tools and technologies for Data Science, develops open source tools for data science.
EMHAcademy (http://emhacademy.great-site.net/) offers courses to help people become Certified Data Scientist.
Thanks for readings.
Kind Regards,
Eric Goh
References
- https://www2.sjsu.edu/faculty/gerstman/StatPrimer/measure.htm
- https://online.stat.psu.edu/stat508/lesson/1b/1b.1
If you like my article, you can buy me a cup of coffee:https://www.buymeacoffee.com/gohminghui
Read the full article
0 notes
Text
Data Understanding and Data Analysis. What's the difference?
CRISP DM
What is CRISP DM? For Data Mining process, we usually use CRISP DM data mining process:

Based on: https://www.datascience-pm.com/crisp-dm-2/
Data Mining process steps includes Business Understanding, Data Understanding, Data Preparation, Modeling, Evaluation, Deployment.
- Business Understanding step - we need to understand the business and establish the question we need to answer for the data mining
- Data Understanding step - we need to understand the data. We can use statistics such as descriptive, regression analysis to understand the data.
- Data Preparation step - it is the cleaning of the data and we can remove duplicates here.
- Modeling step - we create clustering models, prediction models, classification models.
- Evaluation step - we evaluate which models is more accurate and select.
- Deployment steps - we can create data products.
For Data Science, at the Deployment steps, we create data products for businesses. We can create softwares that predicts something. In the table, the goal is to build data products for a business.
For Data Mining, at the Deployment steps, we create reports or PowerPoints slides on our results. In the table, the goal is to extracting important information.
Read More on CRISP DM: http://edatascience.great-site.net/2023/03/08/what-is-crisp-dm/
Data Analysis Process
What is Data Analysis Process? The following is the summary of Data Analysis process:

Identify - You need to identify why you need data analysis in the first place?
Collect - As the name suggest, this is the step you collect data.
Analyse - To analyze data, you can use descriptive statistics (mean, median, …), inferential statistics, data visualizations (charts) to analyze the data.
Interpret - It is time to interpret your results. Write report.
Read more: http://edatascience.great-site.net/2023/03/09/what-is-data-analysis-process/
Data Understanding and Data Analysis Process
According to IBM, the life cycle model consists of six phases with arrows indicating the most important and frequent dependencies between phases. The sequence of the phases is not strict. In fact, most projects move back and forth between phases as necessary. The CRISP-DM model is flexible and can be customized easily.
Read: https://www.ibm.com/docs/en/spss-modeler/saas?topic=dm-crisp-help-overview
Since the sequence of phases or steps is not strict and we can customize, if we change from “Business Understanding step -> Data Understanding step -> Data Preparation step “ to. “Business Understanding step -> Data Preparation step - > Data Understanding step “
We will get the following:
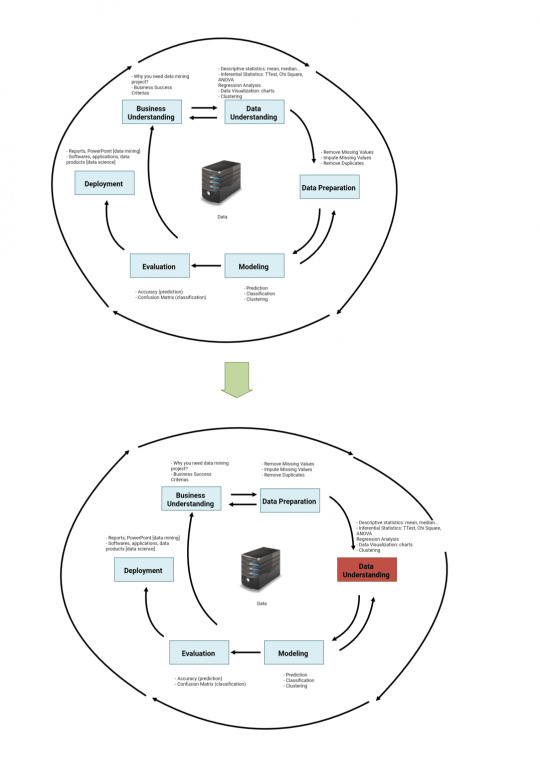
If we put customized CRISP DM to Data Analysis Process:

Do you realize that they are same?
Business Understanding step is the same as “Identify”: Why do we need the project. Business Success Criterias.
Data Preparation step is the same as “collect” and “clean”: Collect data from data sources, process or clean the data by doing remove missing values, impute missing values, remove duplicates.
Data Understanding step is the same as “Analyze”: analyze with descriptive statistics, Inferential Statistics, data visualization.
Write report in CRISP DM is same as “interpret”.

In CRISP DM, if we exit a Data Understanding step, Data Analysis. If we exit at Deployment, Data Mining or Data Science.
If you want to learn more about data science, you can go to http://svbook.great-site.net/?i=1
SVBook Pte. Ltd. assists people to know What is Data Science, Text Analysis, Text Mining, Text Analytics, AI and Machine Learning, process of data, Data Mining to Insights Process using CRISP DM. Data Mining Process Steps includes Business Understanding, Data Understanding, Data Preparation, Modeling, Evaluation, Deployment.
DSTK.Tech (https://dstk2.sourceforge.io/) creates tools and technologies for Data Science, develops open source tools for data science.
EMHAcademy (http://emhacademy.great-site.net/) offers courses to help people become Certified Data Scientist.
Thanks for readings.
Kind Regards,
Eric Goh
Buy me a cup of coffee:https://www.buymeacoffee.com/gohminghui
References:
- https://www.ibm.com/docs/en/spss-modeler/saas?topic=dm-crisp-help-overview
Buy me a cup of coffee:https://www.buymeacoffee.com/gohminghui
Read the full article
0 notes
Text
Categorical Variables and Numerical Variables. What are they?
Data Collection
When collecting data, each sampled form filled up by people is an observation, and each item in the form is an attribute. For example, in a feedback form:
Feedback Form
What is your age?
What is your gender?
Are you married?
Today’s Date
Feedbacks:
____________________________
____________________________
____________________________
Each people filled up the form is an observation, the item in the form is the attributes. Age, Gender, Married, Date is the attributes. Data from the forms are compiled into a data table with observations and attributes.
So, Definitions of data, attributes and observations are:
- Data: Data is a collection of observations and attributes
- Attributes: Attributes, feature, variable, column, or field is the characteristics of an observation.
- Observation: The scientist observed what is happening, collect information and put them as a row in Data.
Read More: http://edatascience.great-site.net/2023/03/16/attributes-variables-features-columns-observations-rows-dependent-variables-independent-variables-what-are-they/
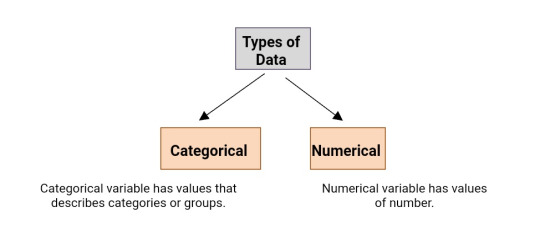
Categorical Variables
Categorical variable has values that describes categories or groups. In a simple technique, if you saw text in the variable, it is categorical variable. “Gender” and “Married” in above data are categorical variable.
Numerical Variables
Numerical variable has values of number. It is further divided into two subsets: discrete and continuous.
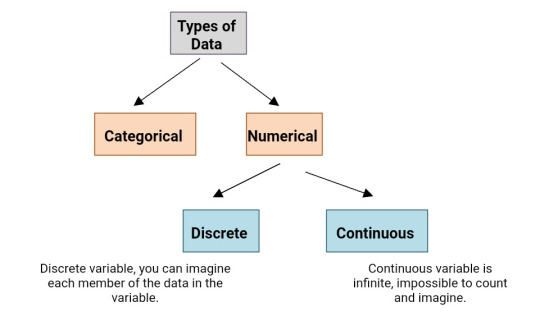
Discrete Variables
Another example is the SATS score, you may get 1000, 1560, 1570, 2400. Discrete variable, you can imagine each member of the data in the variable.
Continuous Variables
Continuous variable is infinite, impossible to count and imagine. For example, weight can take on every value in some range. Every drop of sweat decreases or increases your weight by the weight of that drop of sweat. The process of losing and gaining weight occurs all the time. Weight is a continuous variable – it can take an infinite amount of value sno matter how many digits there are after the dot.
If you want to learn more about data science, you can go to http://svbook.great-site.net/?i=1
SVBook Pte. Ltd. assists people to know What is Data Science, Text Analysis, Text Mining, Text Analytics, AI and Machine Learning, process of data, Data Mining to Insights Process using CRISP DM. Data Mining Process Steps includes Business Understanding, Data Understanding, Data Preparation, Modeling, Evaluation, Deployment.
DSTK.Tech (https://dstk2.sourceforge.io/) creates tools and technologies for Data Science, develops open source tools for data science.
EMHAcademy (http://emhacademy.great-site.net/) offers courses to help people become Certified Data Scientist.
Thanks for readings.
Kind Regards,
Eric Goh
Buy me a cup of coffee:https://www.buymeacoffee.com/gohminghui
Reference
https://365datascience.com/tutorials/statistics-tutorials/numerical-categorical-data/
Read the full article
0 notes
Text
What is the difference between prediction, classification, clustering?
CRISP DM
What is CRISP DM? For Data Mining process, we usually use CRISP DM data mining process:

Based on: https://www.datascience-pm.com/crisp-dm-2/
Data Mining process steps includes Business Understanding, Data Understanding, Data Preparation, Modeling, Evaluation, Deployment.
- Business Understanding step - we need to understand the business and establish the question we need to answer for the data mining
- Data Understanding step - we need to understand the data. We can use statistics such as descriptive, regression analysis to understand the data.
- Data Preparation step - it is the cleaning of the data and we can remove duplicates here.
- Modeling step - we create clustering models, prediction models, classification models.
- Evaluation step - we evaluate which models is more accurate and select.
- Deployment steps - we can create data products.
For Data Science, at the Deployment steps, we create data products for businesses. We can create softwares that predicts something. In the table, the goal is to build data products for a business.
For Data Mining, at the Deployment steps, we create reports or PowerPoints slides on our results. In the table, the goal is to extracting important information.
Read More on CRISP DM: http://edatascience.great-site.net/2023/03/08/what-is-crisp-dm/
Data Collection
When collecting data, each sampled form filled up by people is an observation, and each item in the form is an attribute. For example, in a feedback form:
Feedback Form
What is your age?
What is your gender?
Are you married?
Today’s Date
Feedbacks:
____________________________
____________________________
____________________________
Each people filled up the form is an observation, the item in the form is the attributes. Age, Gender, Married, Date is the attributes. Data from the forms are compiled into a data table with observations and attributes.
So, Definitions of data, attributes and observations are:
- Data: Data is a collection of observations and attributes
- Attributes: Attributes, feature, variable, column, or field is the characteristics of an observation.
- Observation: The scientist observed what is happening, collect information and put them as a row in Data.
Read More: http://edatascience.great-site.net/2023/03/16/attributes-variables-features-columns-observations-rows-dependent-variables-independent-variables-what-are-they/
Categorical Variables
Categorical variable has values that describes categories or groups. In a simple technique, if you saw text in the variable, it is usually categorical variable. “Gender” and “Married” in above data are categorical variable.
Numerical Variables
Numerical variable has values of number. It is further divided into two subsets: discrete and continuous.
Read More:
http://edatascience.great-site.net/2023/03/18/categorical-variables-and-numerical-variables-what-are-they/
Supervised Learning, Unsupervised Learning, Machine Learning
Supervised Learning, Unsupervised Learning, Machine Learning, Prediction/ regression, Classification, and Clustering it should be in the Modeling step.

Supervised Learning
Supervised Learning means the machine learn under supervision. In supervised Learning, the dataset is labelled Data. In y= mx + c, the data is supervised because there is y. Y is the labels.
http://edatascience.great-site.net/2023/03/13/modeling-explain-prediction-using-simple-linear-regression-y-mx-c/

Unsupervised Learning
Unsupervised Learning means the machine learn without supervision. In Unsupervised Learning, the dataset is unlabeled data.

Prediction or Regression
Prediction or Regression is for numerical variable. Linear regression is a method use to quantify the relationship between one or more independent variables and dependent variable.
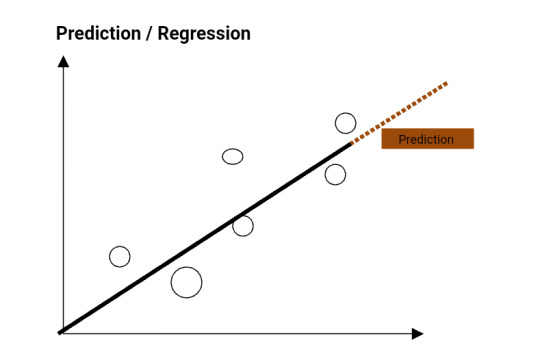
Step 1: collect data
Step 2: fit regression model to the data
Step 3: verify that the model fits the data well
Step 4: use regression model to predict the dependent variable of new observations
Classification
Classification is for categorical variable. Classification is predicting which set of categories an observation is. For example, classify an email to spam or not spam.

Clustering
Clustering means group data into groups or clusters. Clustering is unsupervised Learning that divides unlabeled data into different groups or clusters such that the data points are more similar in the same cluster or group. There are KMeans Clustering and Hierarchical Clustering. In KMeans Clustering, we need to state the k. We can look into KMeans Clustering and Hierarchical Clustering in later article. Cluster analysis is to find similar groups or subjects and is also called segmentation analysis. Hence, clustering can be in data understanding stage of CRISP DM.
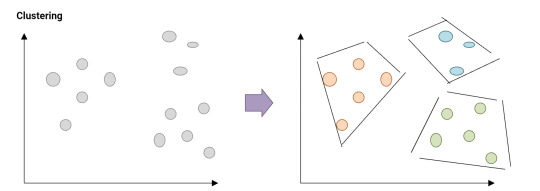
Evaluation for Classification
For classification, to evaluate the accuracy of the model, we use confusion Matrix. We use confusion Matrix because maths formula cannot be used to count accuracy for categorical variables.

Accuracy: How often the classifier is correct?
Accuracy= (TP+TN)/total
Precision: When it predicts yes, how often is it correct?
Precision = TP/predicted yes
F Score: F Score is a weighted average of true positive rate (recall) and precision.
F Score = 2TP / (2TP + FP + FN)
Evaluation for prediction or regression
For prediction or regression, to evaluate the accuracy, we use Root Mean Squared Error (RMSE). We can use RMSE because prediction is for numerical variable. We can use maths formula to count the accuracy.

Extracted from: https://blog.knoldus.com/machinex-evaluation-metrics-for-a-regression-ml-model/
How to Classification, Prediction/ Regression, or Clustering?
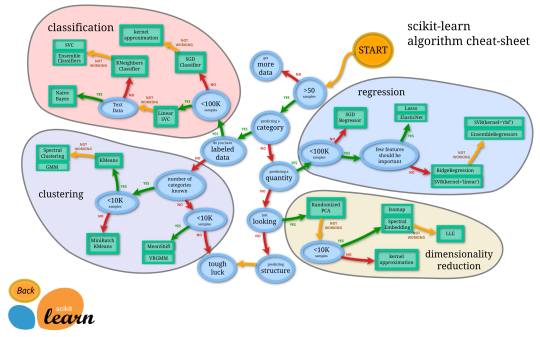
Extracted from: https://scikit-learn.org/stable/tutorial/machine_learning_map/index.html
If you want to learn more about data science, you can go to http://svbook.great-site.net/?i=1
SVBook Pte. Ltd. assists people to know What is Data Science, Text Analysis, Text Mining, Text Analytics, AI and Machine Learning, process of data, Data Mining to Insights Process using CRISP DM. Data Mining Process Steps includes Business Understanding, Data Understanding, Data Preparation, Modeling, Evaluation, Deployment.
DSTK.Tech (https://dstk2.sourceforge.io/) creates tools and technologies for Data Science, develops open source tools for data science.
EMHAcademy (http://emhacademy.great-site.net/) offers courses to help people become Certified Data Scientist.
Thanks for readings.
Kind Regards,
Eric Goh
Buy me a cup of coffee:https://www.buymeacoffee.com/gohminghui
Reference:
- https://www.simplilearn.com/tutorials/machine-learning-tutorial/supervised-and-unsupervised-learning
- https://www.analyticsvidhya.com/blog/2016/11/an-introduction-to-clustering-and-different-methods-of-clustering/
- https://www.statology.org/predictions-regression/
- https://www.dataschool.io/simple-guide-to-confusion-matrix-terminology/
- https://blog.knoldus.com/machinex-evaluation-metrics-for-a-regression-ml-model/
- https://en.m.wikipedia.org/wiki/Statistical_classification
Read the full article
0 notes