
Don't wanna be here? Send us removal request.
Statistics
We looked inside some of the posts by electricalstudent and here's what we found interesting.
Average Info
Notes Per Post
0
Likes Per Post
0
Reblog Per Post
0
Reply Per Post
0
Time Between Posts
22 days
Number of Posts By Type
Text
17
Last Seen Tumblr Blogs


Fun Fact
Tumblr has 4 main sources of revenue.
Text
There are two photolithography systems: one with light source of wavelength 𝜆 1 = 156 nm (System 1) and another with light source of wavelength 𝜆 2 = 325 nm (System 2). Both photolithography systems are otherwise identical. If the minimum feature sizes that can be realized using System1 and System2 are 𝐿 𝑚 𝑖 𝑛 1 𝑎 𝑛 𝑑 𝐿 𝑚 𝑖 𝑛 2 respectively, the ratio 𝐿 𝑚 𝑖 𝑛 1 / 𝐿 𝑚 𝑖 𝑛 2 (correct to two decimal places) is__________.
There are two photolithography systems: one with light source of wavelength λ1 = 156 nm (System 1) and another with light source of wavelength λ2 = 325 nm (System 2). Both photolithography systems are otherwise identical. If the minimum feature sizes that can be realized using System1 and System2 are Lmin1andLmin2 respectively, the ratio Lmin1/Lmin2(correct to two decimal places)…
0 notes
Text
Understanding Mechanical Systems: Translational vs Rotational
In this chapter, let us discuss the differential equation modeling of mechanical systems. There are two types of mechanical systems based on the type of motion. Translational mechanical systems Rotational mechanical systems Modeling of Translational Mechanical Systems Translational mechanical systems move along a straight line. These systems mainly consist of three basic elements. Those are…

View On WordPress
0 notes
Text
The following program is run on 8085 microprocessor :
The following program is run on 8085 microprocessor : Memory Address in hex Instruction 2000 LXI SP, 1000 2003 PUSH H 2004 PUSH D 2005 CALL 2050 2008 POP H 2009 HLT At the completion of execution of the program, the program Counter of the 8085 contains _________ and the Stack Pointeer contains ___________.
0 notes
Text
Key Characteristics of Ideal Op-Amps Explained
An ideal operational amplifier (op-amp) is a theoretical device that exhibits a set of perfect characteristics, which makes it an essential building block in analog electronics. Here are the primary characteristics of an ideal op-amp: Characteristics of an Ideal Op-Amp Infinite Open-Loop Gain (AAA): The open-loop gain of an ideal op-amp is infinite. This means that even a very small difference…
0 notes
Text
Master GATE EEE PYQ with Solutions
gate EEE pyq solved
0 notes
Text
A BJT common emitter amplifier is shown below using the small-signal T model with parameters α and re. If beta 120, Re 90 ohms, and gm - 200 mA/V, what is the value of the small signal input resistance, Rin, expressed in ohms?
#CE amplifier with emitter resistance#common emitter amplifier solved problems#input resistance of an amplifier
0 notes
Text
Label the sketches in Figure 2 (a) to (f) as either valid root locus sketches or invalid root locussketches. You do not need to redraw the diagrams; just number your answer appropriately and statewhether or not each figure is a valid root locus sketch. [4 points] Continue reading Untitled

View On WordPress
0 notes
Text
Assume the feedback system in Figure 1 now has a sensing device H(s) on its feedback path andH(s) has conjugate zeros located at 2 ± j2 on the s-plane.(a) If you had to recommend this system to a customer, what would you advise with respect toincreasing the feedback gain K indefinitely? Justify your response. [5 points](b) What value of K will yield a steady-state error of 12%? [5 points] Assume…
0 notes
Text
Consider the unity feedback control system in Figure 1, where K is a gain andG(s) = 1sand A(s) = 1as+ 1.Figure 1: A simple control system.(a) Assuming R is the unit step function, and the corresponding response overshoots the steady-state (final) value by 20%, determine the values of K and a. [5 points](b) For what value of K would the response be underdamped? [3 points](c) Assuming K = 1, for what value of a would the response be critically damped? Comment onthe relationship between a and the damping coefficient. [4 points]
Continue reading Consider the unity feedback control system in Figure 1, where K is a gain andG(s) = 1sand A(s) = 1as+ 1.Figure 1: A simple control system.(a) Assuming R is the unit step function, and the corresponding response overshoots the steady-state (final) value by 20%, determine the values of K and a. [5 points](b) For what value of K would the response be underdamped? [3 points](c)…

View On WordPress
0 notes
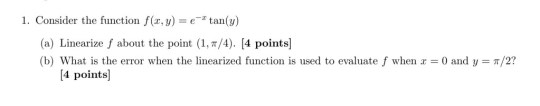
Text
Consider the function f(x,y) = e−x tan(y)(a) Linearize f about the point (1,π/4). [4 points](b) What is the error when the linearized function is used to evaluate f when x= 0 and y= π/2?[4 points] Continue reading Untitled
View On WordPress
0 notes
Text
1.- The figure shows the open-loop transfer function for:L(S) = K/[S(S+1)(S+2)], K=1, and H(S) = 1.Using the Nyquist criterion determine:a) Is the closed-loop system stable or unstable? Justify your answer. (25pts)b) What is the gain margin expressed in dB? (25 pts)

View On WordPress
0 notes
Text
3. In this question, we use MATLAB to implement a sampling and reconstruction of the signal f(t) = (5 sin(87t) + 6 sin(167t), Osts 0, otherwise a (a) Use MATLAB to plot the signal for
Auto Draft Continue reading Untitled

View On WordPress
0 notes
Text
generate AM signal in time domain and frequency spectrum using MATLAB
Below is a good starting point for your program: % Clear and initialize variables clearclose allhold offN=2^18; % Number of sample pointsFs=2^14; % sample frequency is 16,384 Hz is to be power of 2% because we are using the FFT and not the DFTTs=1/Fs;fc=1000; % carrier frequency is 1 kHzfm=100; Ac=10; % message frequency is 100 Hz, amplitude is 10mu2=1.0; % 100% modulationmu1=0.5; % 50%…
View On WordPress
0 notes
Text
P2.4Let x(n) = {2,4, -3, 1, -5, 4, 7}. Generate and plot the samples (use the stem function) of the following sequences.
P2.4Let x(n) = {2,4, -3, 1, -5, 4, 7}. Generate and plot the samples (use the stem function) ofthe following sequences. x1(n) = 2x(n – 3) + 3x(n + 4) – x(n) x2 (n) = 4x(4 + n) + 5x(n + 5) + 2x(n) x3 (n) = x(n + 3)x(n – 2) + x(1 – n)x(n + 1) x4 (n) = 2e0.5𝑛x(n) + cos(0.1πn) x(n + 2) , -10 ≤ n ≤ 10 sigshift.m is required for this which is attached here unction [y,n] = sigshift(x,m,n0) %…
View On WordPress
0 notes
Text
P2.3Generate the following periodic sequences and plot their samples (using the stem function)over the indicated number of periods.
P2.3Generate the following periodic sequences and plot their samples (using the stem function)over the indicated number of periods. 1 x (n) = {. . . , -2, -1, 0, 1, 2, . . .}periodic. Plot 5 periods 2x (n) = 𝑒0.1𝑛[u(n) – u(n – 20]periodic. Plot 3 periods. 3x (n) = sin(0.1πn)[u(n) – u(n – 10)]. Plot 4 periods. 4 x (n) = {. . . , 1, 2, 3, . . .}periodic + {. . . , 1, 2, 3, 4, . . .}periodic, 0…
View On WordPress
0 notes
Text
Generate the following random sequences and obtain their histogram using the hist function with 100 bins. Use the bar function to plot each histogram.
Generate the following random sequences and obtain their histogram using the hist function with 100 bins. Use the bar function to plot each histogram. x1(n) is a random sequence whose samples are independent and uniformly distributed over [0, 2] interval. Generate 100,000 samples. x2(n) is a Gaussian random sequence whose samples are independent with mean 10 and variance 10. Generate 10,000…
View On WordPress
0 notes
Text
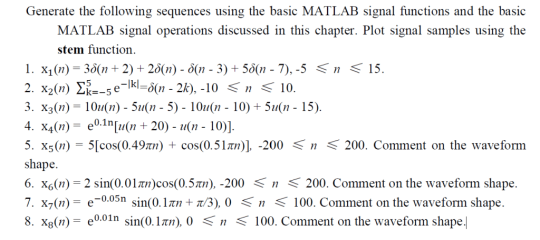
Generate the following sequences using the basic MATLAB signal functions and the basic MATLAB signal operations discussed in this chapter. Plot signal samples using the stem function.
x1(n) = 3δ(n + 2) + 2δ(n) – δ(n – 3) + 5δ(n – 7), -5 ≤ n ≤ 15. x2(n) Σe−|k|5k=−5=δ(n – 2k), -10 ≤ n ≤ 10. x3(n) = 10u(n) – 5u(n – 5) – 10u(n – 10) + 5u(n – 15). x4(n) = e0.1n[u(n + 20) – u(n – 10)]. x5(n) = 5[cos(0.49πn) + cos(0.51πn)], -200 ≤ n ≤ 200. Comment on the waveform shape. x6(n) = 2 sin(0.01πn)cos(0.5πn), -200 ≤ n ≤ 200. Comment on the waveform shape. x7(n) = e−0.05n sin(0.1πn +…
View On WordPress
0 notes