
Statistics
We looked inside some of the posts by hardik20sharma and here's what we found interesting.
Average Info
Notes Per Post
1
Likes Per Post
1
Reblog Per Post
0
Reply Per Post
0
Time Between Posts
6 days
Number of Posts By Type
Text
4
Last Seen Tumblr Blogs


Fun Fact
Women make up for the other 50% of Tumblr’s audience.
Text
Peer graded Assignment: Creating graphs for your data
The program I have written :-
import pandas as p import numpy as n import seaborn as sb import matplotlib.pyplot as plt
data_set = p.read_csv('Modified_DataSet.csv', low_memory = False) print("\nRows in data set: ", len(data_set)) # Number of rows in data set print("Cols in data set: ", len(data_set.columns)) # Number of cols in data set
state_count = data_set["State"].value_counts(sort=False) state_count_percentage = data_set["State"].value_counts(sort=False, normalize=True)
print("\nDistribution of patients in each state: ", end="\n\n") print(state_count)
print("\nDistribution of patients in each state (in %): ", end="\n\n") print(state_count_percentage * 100)
gender_count = data_set["Gender"].value_counts(sort=False) gender_count_percentage = data_set["Gender"].value_counts(sort=False, normalize=True)
print("\nGender distribution of patients: ", end="\n\n") print(gender_count)
print("\nGender distribution of patients (in %): ", end="\n\n") print(gender_count_percentage * 100)
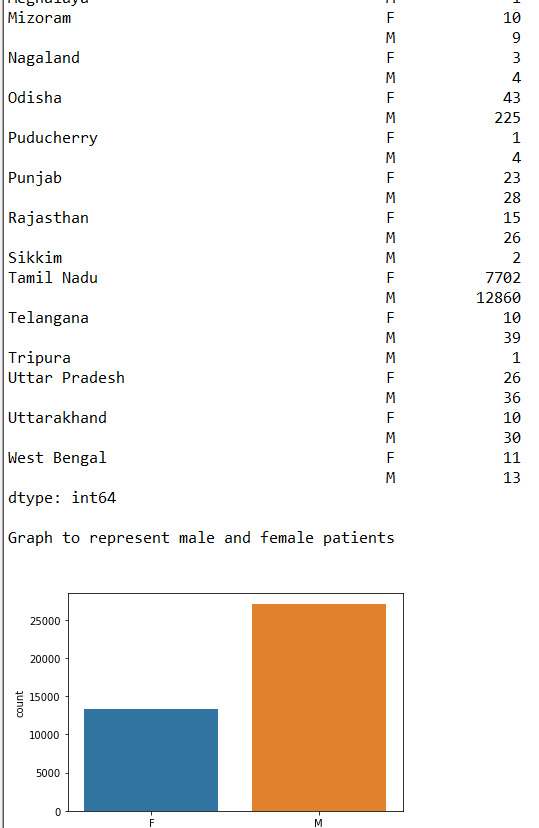
s1 = p.DataFrame(data_set).groupby(["State", "Gender"]) states_gender_distribution = s1.size() print("\nNumber of female and male patients in each state", end="\n\n") p.set_option("display.max_rows", None) print(states_gender_distribution)
print("\nGraph to represent male and female patients", end="\n\n") data_set["Gender"] = data_set["Gender"].astype("category") sb.countplot(x="Gender",data = data_set)
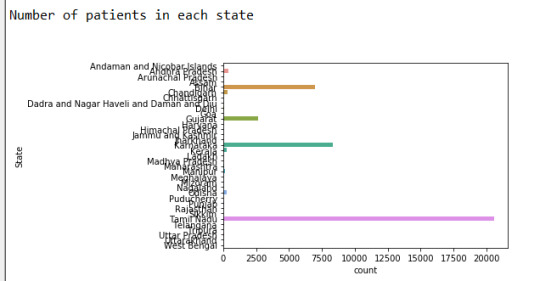
print("\nNumber of patients in each state", end="\n\n") data_set["State"] = data_set["State"].astype("category") sb.countplot(y="State",data = data_set)
Output of the program :-
1)
2)
3)
4)
5)
6)
Conclusion :-
From the given data we can analyse-
Approx 67% of the patients are Male and 33% of the patients are female
Found out that more than 50% of the cases come from Tamil Nadu
The state least affected is Meghalaya.
We found the count of male and females patients for each state.
Successfully expressed the data through graphs.
0 notes
Text
Peer-graded Assignment: Making Data Management Decisions
(Disclaimer: I’m sorry, the visual appeal of data has been disturbed because of tumblr’s formatting)
The program I have written (in Python):
import pandas as p
import numpy as n
data_set = p.read_csv('Modified_DataSet.csv', low_memory = False) print("\nRows in data set: ", len(data_set)) # Number of rows in data set print("Cols in data set: ", len(data_set.columns)) # Number of cols in data set
state_count = data_set["State"].value_counts(sort=False) state_count_percentage = data_set["State"].value_counts(sort=False, normalize=True)
print("\nDistribution of patients in each state: ", end="\n\n") print(state_count)
print("\nDistribution of patients in each state (in %): ", end="\n\n") print(state_count_percentage * 100)
gender_count = data_set["Gender"].value_counts(sort=False) gender_count_percentage = data_set["Gender"].value_counts(sort=False, normalize=True)
print("\nGender distribution of patients: ", end="\n\n") print(gender_count)
print("\nGender distribution of patients (in %): ", end="\n\n") print(gender_count_percentage * 100)
s1 = p.DataFrame(data_set).groupby(["State", "Gender"]) states_gender_distribution = s1.size() print("\nNumber of female and male patients in each state", end="\n\n") p.set_option("display.max_rows", None) print(states_gender_distribution)
Output of the program:
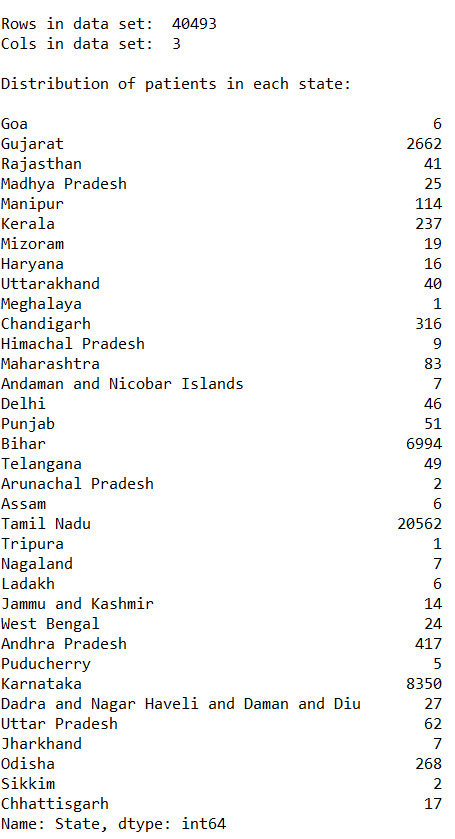
Rows in data set: 40493 Cols in data set: 3
Distribution of patients in each state:
Tripura 1 Chandigarh 316 Assam 6 Telangana 49 Andaman and Nicobar Islands 7 Andhra Pradesh 417 Kerala 237 Gujarat 2662 Uttarakhand 40 Goa 6 Meghalaya 1 Punjab 51 Himachal Pradesh 9 Odisha 268 Delhi 46 Jammu and Kashmir 14 Maharashtra 83 Dadra and Nagar Haveli and Daman and Diu 27 Manipur 114 West Bengal 24 Bihar 6994 Mizoram 19 Tamil Nadu 20562 Madhya Pradesh 25 Haryana 16 Karnataka 8350 Uttar Pradesh 62 Arunachal Pradesh 2 Jharkhand 7 Rajasthan 41 Ladakh 6 Puducherry 5 Nagaland 7 Sikkim 2 Chhattisgarh 17 Name: State, dtype: int64
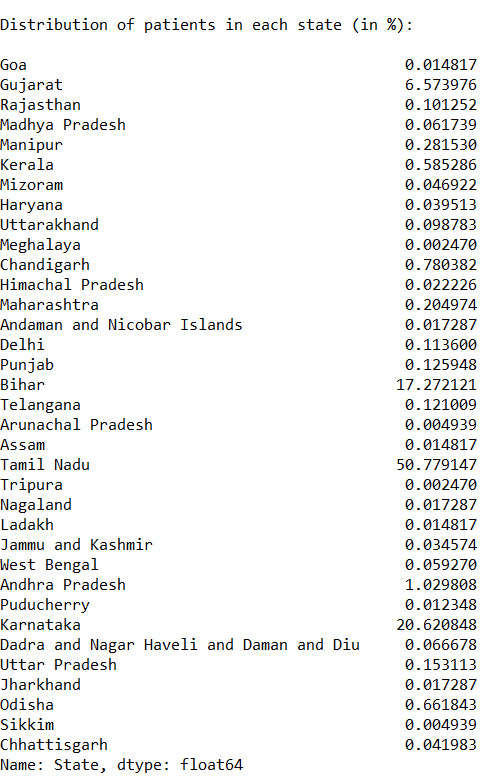
Distribution of patients in each state (in %):
Tripura 0.002470 Chandigarh 0.780382 Assam 0.014817 Telangana 0.121009 Andaman and Nicobar Islands 0.017287 Andhra Pradesh 1.029808 Kerala 0.585286 Gujarat 6.573976 Uttarakhand 0.098783 Goa 0.014817 Meghalaya 0.002470 Punjab 0.125948 Himachal Pradesh 0.022226 Odisha 0.661843 Delhi 0.113600 Jammu and Kashmir 0.034574 Maharashtra 0.204974 Dadra and Nagar Haveli and Daman and Diu 0.066678 Manipur 0.281530 West Bengal 0.059270 Bihar 17.272121 Mizoram 0.046922 Tamil Nadu 50.779147 Madhya Pradesh 0.061739 Haryana 0.039513 Karnataka 20.620848 Uttar Pradesh 0.153113 Arunachal Pradesh 0.004939 Jharkhand 0.017287 Rajasthan 0.101252 Ladakh 0.014817 Puducherry 0.012348 Nagaland 0.017287 Sikkim 0.004939 Chhattisgarh 0.041983 Name: State, dtype: float64
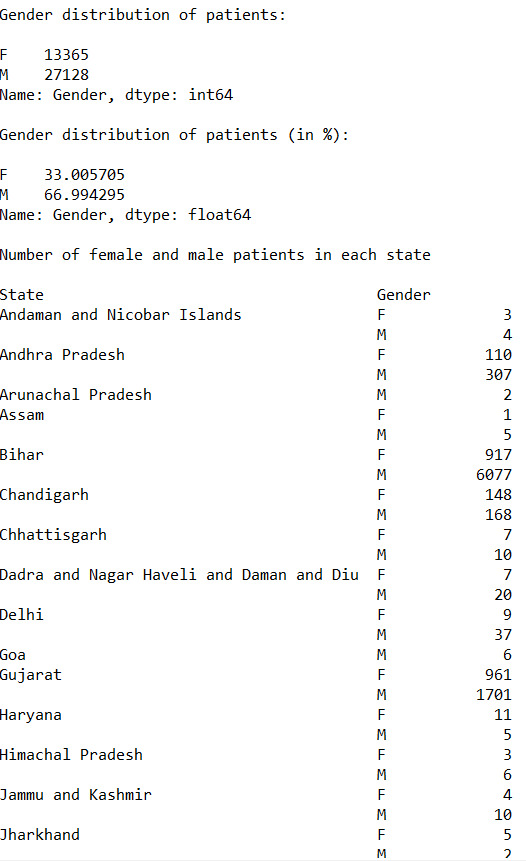
Gender distribution of patients:
F 13365 M 27128 Name: Gender, dtype: int64
Gender distribution of patients (in %):
F 33.005705 M 66.994295 Name: Gender, dtype: float64
Number of female and male patients in each state
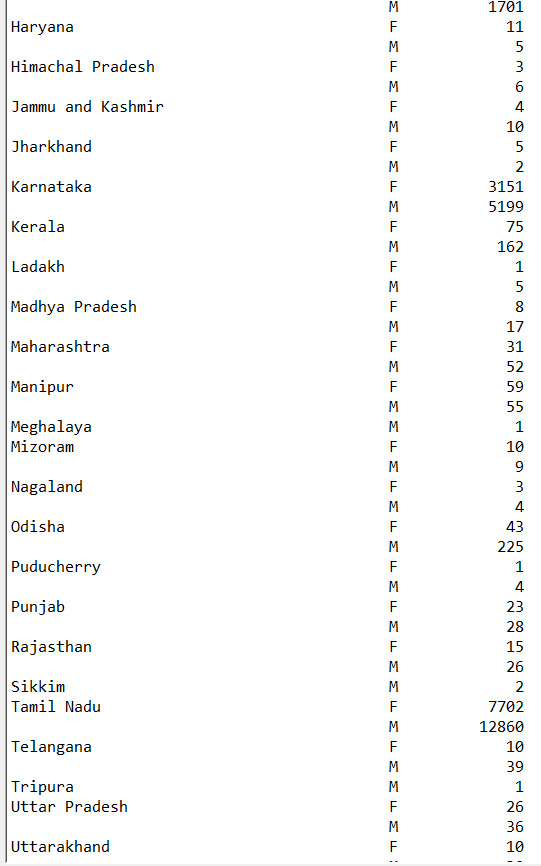
State Gender Andaman and Nicobar Islands F 3 M 4 Andhra Pradesh F 110 M 307 Arunachal Pradesh M 2 Assam F 1 M 5 Bihar F 917 M 6077 Chandigarh F 148 M 168 Chhattisgarh F 7 M 10 Dadra and Nagar Haveli and Daman and Diu F 7 M 20 Delhi F 9 M 37 Goa M 6 Gujarat F 961 M 1701 Haryana F 11 M 5 Himachal Pradesh F 3 M 6 Jammu and Kashmir F 4 M 10 Jharkhand F 5 M 2 Karnataka F 3151 M 5199 Kerala F 75 M 162 Ladakh F 1 M 5 Madhya Pradesh F 8 M 17 Maharashtra F 31 M 52 Manipur F 59 M 55 Meghalaya M 1 Mizoram F 10 M 9 Nagaland F 3 M 4 Odisha F 43 M 225 Puducherry F 1 M 4 Punjab F 23 M 28 Rajasthan F 15 M 26 Sikkim M 2 Tamil Nadu F 7702 M 12860 Telangana F 10 M 39 Tripura M 1 Uttar Pradesh F 26 M 36 Uttarakhand F 10 M 30 West Bengal F 11 M 13
Conclusion:
From the given data we can analyse-
Approx 67% of the patients are Male and 33% of the patients are female
Found out that more than 50% of the cases come from Tamil Nadu
The state least affected is Meghalaya.
We found the count of male and females patients for each state.
0 notes
Text
Peer-graded Assignment: Running Your First Program
The program I have written (in Python):
import pandas as p import numpy as n
data_set = p.read_csv('Modified_DataSet.csv', low_memory = False) print("\nRows in data set: ", len(data_set)) # Number of rows in data set print("Cols in data set: ", len(data_set.columns)) # Number of cols in data set
state_count = data_set["State"].value_counts(sort=False) state_count_percentage = data_set["State"].value_counts(sort=False, normalize=True)
print("\nDistribution of patients in each state: ", end="\n\n") print(state_count)
print("\nDistribution of patients in each state (in %): ", end="\n\n") print(state_count_percentage * 100)
gender_count = data_set["Gender"].value_counts(sort=False) gender_count_percentage = data_set["Gender"].value_counts(sort=False, normalize=True)
print("\nGender distribution of patients: ", end="\n\n") print(gender_count)
print("\nGender distribution of patients (in %): ", end="\n\n") print(gender_count_percentage * 100)
Output of the program:
Rows in data set: 40493 Cols in data set: 3
Distribution of patients in each state:
Bihar 6994 Mizoram 19 Andaman and Nicobar Islands 7 Puducherry 5 West Bengal 24 Arunachal Pradesh 2 Odisha 268 Rajasthan 41 Chandigarh 316 Andhra Pradesh 417 Ladakh 6 Chhattisgarh 17 Nagaland 7 Manipur 114 Jammu and Kashmir 14 Sikkim 2 Uttarakhand 40 Dadra and Nagar Haveli and Daman and Diu 27 Gujarat 2662 Assam 6 Karnataka 8350 Himachal Pradesh 9 Punjab 51 Haryana 16 Telangana 49 Tamil Nadu 20562 Kerala 237 Maharashtra 83 Meghalaya 1 Uttar Pradesh 62 Goa 6 Madhya Pradesh 25 Delhi 46 Jharkhand 7 Tripura 1 Name: State, dtype: int64
Distribution of patients in each state (in %):
Bihar 17.272121 Mizoram 0.046922 Andaman and Nicobar Islands 0.017287 Puducherry 0.012348 West Bengal 0.059270 Arunachal Pradesh 0.004939 Odisha 0.661843 Rajasthan 0.101252 Chandigarh 0.780382 Andhra Pradesh 1.029808 Ladakh 0.014817 Chhattisgarh 0.041983 Nagaland 0.017287 Manipur 0.281530 Jammu and Kashmir 0.034574 Sikkim 0.004939 Uttarakhand 0.098783 Dadra and Nagar Haveli and Daman and Diu 0.066678 Gujarat 6.573976 Assam 0.014817 Karnataka 20.620848 Himachal Pradesh 0.022226 Punjab 0.125948 Haryana 0.039513 Telangana 0.121009 Tamil Nadu 50.779147 Kerala 0.585286 Maharashtra 0.204974 Meghalaya 0.002470 Uttar Pradesh 0.153113 Goa 0.014817 Madhya Pradesh 0.061739 Delhi 0.113600 Jharkhand 0.017287 Tripura 0.002470 Name: State, dtype: float64
Gender distribution of patients:
M 27128 F 13365 Name: Gender, dtype: int64
Gender distribution of patients (in %):
M 66.994295 F 33.005705 Name: Gender, dtype: float64
Conclusion:
From the given data we can analyse-
Approx 67% of the patients are Male and 33% of the patients are female
Found out that more than 50% of the cases come from Tamil Nadu
The state least affected is Meghalaya.
1 note
·
View note
Text
Correlation between gender and CoVID-19 in India
A little information on CoVID-19 :--
CoVID-19 is an infectious disease caused by a newly discovered corona virus.
Most people infected with the CoVID-19 virus will experience mild to moderate respiratory illness and recover without requiring special treatment. Older people, and those with underlying medical problems like cardiovascular disease, diabetes, chronic respiratory disease, and cancer are more likely to develop serious illness.
The best way to prevent and slow down transmission is be well informed about the CoVID-19 virus, the disease it causes and how it spreads. Protect yourself and others from infection by washing your hands or using an alcohol based rub frequently and not touching your face.
The CoVID-19 virus spreads primarily through droplets of saliva or discharge from the nose when an infected person coughs or sneezes, so it’s important that you also practice respiratory etiquette (for example, by coughing into a flexed elbow).
At this time, there are no specific vaccines or treatments for CoVID-19. However, there are many ongoing clinical trials evaluating potential treatments. WHO will continue to provide updated information as soon as clinical findings become available.
Research Methodology :--
Based on the data set of all the patients published online who were tested positive between May 20 and June 19, 2020.
Research questions and hypothesis :--
An attempt to find if there is a correlation between gender and CoVID-19 in India. My hypothesis is there shouldn’t be a correlation between gender and CoVID-19.
The research has further scope to find which gender is most affected in each state of India.
Variables used :-
Patient_ID (Unique Identifier)
Gender (Male or Female)
State (State where the person is being treated)
Data set / reference which shall be used :--
https://www.kaggle.com/imdevskp/covid19-corona-virus-india-dataset
BIBLIOGRAPHY:
Ministry Of Health and Family Welfare, India - Website: https://www.mohfw.gov.in/
COVID-19 India Tracker Website - https://www.covid19india.org/
COVID-19 India Tracker Data - https://api.covid19india.org/csv/
0 notes