
Statistics
We looked inside some of the posts by ispyetf and here's what we found interesting.
Average Info
Notes Per Post
0
Likes Per Post
0
Reblog Per Post
0
Reply Per Post
0
Time Between Posts
1 month
Number of Posts By Type
Text
17
Last Seen Tumblr Blogs


Fun Fact
Tumblr’s website traffic is steadily declining.
Text
S&P 500 Update: Risk vs Reward Reversal
Back in February, the Profit Radar Report published the two most likely S&P 500 forward projections (one of them shown below, the other one was very similar), and stated that: “Both scenarios will eventually lead to new all-time highs.”
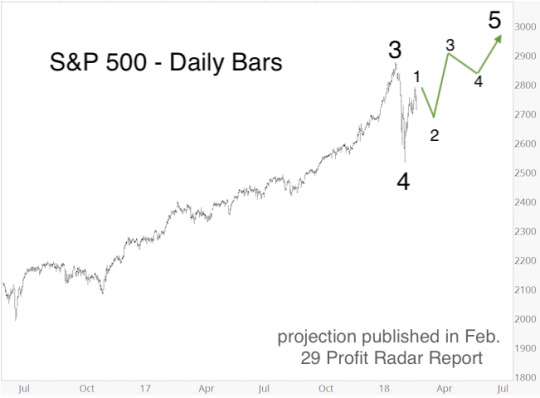
My ideal up side target has been 3,000+/-, but risk increased once the minimum up side target (new highs) was reached.
Based on a number of bearish developments and divergences, the September 19 Profit Radar Report stated that: “Chasing price here comes with more risk than reward.”
Barron's rates iSPYETF as "trader with a good track record" and Investor's Business Daily says: "When Simon says, the market listens." Find out why Barron's and IBD endorse Simon Maierhofer's Profit Radar Report.
The September 30 Profit Radar Report tried to quantify the down side risk - based on the trend channel shown below – and stated: “A test of the lower trend channel (around 2,850) could be wave 4, followed by wave 5 towards or above 3,000.”

Obviously the S&P has already reached 2,850, and is now over-sold, and just above Fibonacci support around 2,830. Another area of support (based on Elliott Wave Theory for a diagonal) is the June 13 high at 2,791.
While in that range (2,850 – 2,780), the S&P can (and I think will) still find support for a year-end rally to 3,000+/-.
Of course there is a chance that the September high marks a more significant top with down side targets at 2,600 – 2,200.
We will likely reach those down side targets eventually, but a prior attempt to take out 3,000 would conform to seasonality, take out premature bears, and allow some of those bearish divergences to mature even further and set the stage for a bear market.
The months ahead should certainly be exciting!
Continued updates are available via the Profit Radar Report.
Simon Maierhofer is the founder of iSPYETF and the publisher of the Profit Radar Report. Barron's rated iSPYETF as a "trader with a good track record" (click here for Barron's profile of the Profit Radar Report). The Profit Radar Report presents complex market analysis (S&P 500, Dow Jones, gold, silver, euro and bonds) in an easy format. Technical analysis, sentiment indicators, seasonal patterns and common sense are all wrapped up into two or more easy-to-read weekly updates. All Profit Radar Report recommendations resulted in a 59.51% net gain in 2013, 17.59% in 2014, 24.52% in 2015, 52.26% in 2016, and 23.39% in 2017.
0 notes
Text
This is Probably the Most Important Seasonal Pattern of 2018
Seasonality is one of 4 key indicators we analyze (the other 3 are: Money flow, technicals, and investor sentiment). Out of many seasonal patterns, this is probably the most important one for all of 2018.
The 2018 S&P 500 Forecast (part of the Profit Radar Report) highlighted this seasonal pattern (and chart):
“2018 is a mid-term year (based on the 4-year presidential election year cycle. Historically, stocks rally from the mid-year (2018) low to the pre-election year (2019) high (on average 50%). The average S&P 500 gain over the last 5 cycles was 36.8% (see chart for individual cycle gains).
Historically (going back to 1950), stocks fall about 20% into the mid-term (2018) low. The average S&P 500 loss from the preceding high to the mid-term low over the last 5 cycles was 18.41%. However, the 2002 loss was unusually large (34.54%). Excluding 2002, the average loss over the last 4 cycles was 14.38%.”
Barron's rates iSPYETF as "trader with a good track record" and Investor's Business Daily says: "When Simon says, the market listens." Find out why Barron's and IBD endorse Simon Maierhofer's Profit Radar Report.

From the January high to the February low, the S&P 500 lost as much as 12.26%.
This is close to the average loss of 14.38% mentioned above.
Based on this seasonal pattern, we should be looking for two developments:
A buyable bottom
A multi-month rally
Continuous updates will be available via the Profit Radar Report.
Simon Maierhofer is the founder of iSPYETF and the publisher of the Profit Radar Report. Barron's rated iSPYETF as a "trader with a good track record" (click here for Barron's profile of the Profit Radar Report). The Profit Radar Report presents complex market analysis (S&P 500, Dow Jones, gold, silver, euro and bonds) in an easy format. Technical analysis, sentiment indicators, seasonal patterns and common sense are all wrapped up into two or more easy-to-read weekly updates. All Profit Radar Report recommendations resulted in a 59.51% net gain in 2013, 17.59% in 2014, and 24.52% in 2015.
Follow Simon on Twitter @ iSPYETF or sign up for the FREE iSPYETF Newsletter to get actionable ETF trade ideas delivered for free.
0 notes
Text
Dollar, Euro, Gold Update
Dollar Update
The January 2 Profit Radar Report published this chart and long-term US Dollar Index forecast:
“The US Dollar Index could be at or near the end of a 5 ½ year rally. As per Elliott Wave Theory, it is possible to count 5 waves up from the May 2011 low. There are bearish divergences at the December highs, and investor sentiment is in favor of a lower dollar. We are alert for a potential multi-month US dollar decline.”

As it turns out, the US Dollar Index actually peaked on January 3, and spent the next 8 months falling lower.
In August/September we were expecting a bottom, but at the time we were not sure how big of a bounce to expect.
In November it became clear that the rally from the September 8 low to the October 27 high was only 3 waves, a first indication that the dollar bounce was over (a 5-wave move higher would have marked a trend change according to Elliott Wave Theory).
The chart below reflects the most likely Elliott Wave Theory count, which projects a more significant low in early 2018.
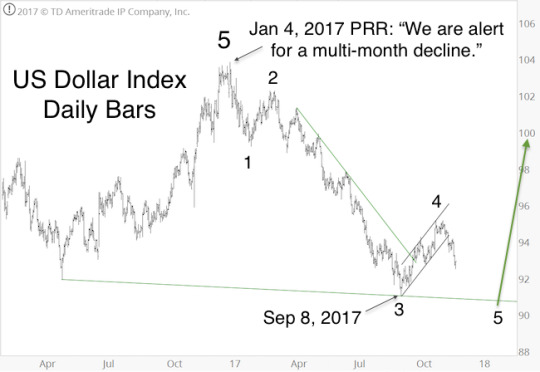
Smart money dollar hedgers are near record long the dollar, which could lead to a more sustainable rally even before the dollar reaches new lows (a solid close above 95 prior to a new low would suggest that the wave 5 low is already in).
However, hedgers are often early and may become even more bullish in the coming weeks. The lower the dollar falls, the better the buy signal.
Corresponding long dollar ETF: PowerShares DB US Dollar Bullish Fund (UUP)
EUR/USD (Euro)
The euro (EUR/USD) generally moves in the opposite direction of the dollar.
Since the above dollar analysis provides a multi-month forecast, we’ll use the EUR/USD for a short-term outlook.
On November 14, the EUR/USD broke above the black trend channel, and re-tested that channel on November 21 (blue circle).
The November 20 Profit Radar Report said that: “The EUR/USD is near support around 1.17. This could serve as springboard for new recovery highs.”

We now expect a rally above 1.21. The gray trend channel provides some short-term support/resistance levels. Trade should not drop below 1.17.
RSI appears unlikely to confirm new highs above 1.21, which would harmonize nicely with our expectation of a larger pullback.
Smart money euro hedgers, however, are nearly record short the euro, which will draw the euro down eventually. We’d love an opportunity to short the euro above 1.21 against a bearish RSI divergence.
Corresponding inverse euro ETF: ProShares UltraShort Euro (EUO)
Corresponding euro ETF: CurrencyShares Euro Trust (FXE)
Gold
This September 28 article included a detailed long-term outlook for gold.
The October 4 Profit Radar Report said all there was to know about gold for the weeks to come: “Support for gold is at 1,245 – 1,260. Resistance is at 1,298 – 1,304. For now, gold is likely to trade between support and resistance.”
Gold is pushing the upper boundary of the outlined trading range, but thus far there’s been no breakout. Silver failed to confirm gold’s push higher, which can be a warning signal. On balance volume has been increasing, which is a positive. Nevertheless, we would view a break above 1,307 with suspicion.
Corresponding gold ETFs: SPDR Gold Trust (GLD) iShares Gold Trust (IAU)
Corresponding inverse gold ETFs: ProShares UltraShort Gold (GLL)

Continued forecasts for the US Dollar, EUR/USD, gold and silver are available via the Profit Radar Report.
0 notes
Text
Stock Market Update: This is the Clearest Chart Right Now
There’s never been a time when articles on iSPYETF.com have been posted at the snail-pace of about one per month … until now.
Unless you are a stock picker, there’s simply been nothing worthwhile to write about.
The October 1 Profit Radar Report warned of just such a period of inactivity:
“The bullish Elliott Wave Theory count would see stocks grind higher for a number of weeks in a 2 steps forward, 1 step back pattern. A real unexciting, unstimulating and uninspiring grind higher to 2,600+/-. Unless the S&P drops below 2,500, this is now the most likely outcome.”
Barron's rates iSPYETF as "trader with a good track record" and Investor's Bussines Daily says "When Simon says, the market listens." Find out why Barron's and IBD endorse Simon Maierhofer's Profit Radar Report.
This ‘real unexciting, unstimulating and uninspiring grind higher to 2,600+/-‘ has already lasted more than 7 weeks.
The Clearest Chart Right Now
One of the best tell-tale since during this 7-week period came from the Russell 2000. The chart and commentary below were published in the November 15 Profit Radar Report:
“The Russell 2000 is leaking lower. RSI-2 is now oversold with support around 1,452. The correction since the October 5 high looks like a wave 4. The 38.2% Fibonacci retracement level (a common target for waves 4) is at 1,451.35 (just 3 points below today’s low). The R2K appears to be nearing a bounce, there’s even a possibility today’s low was a more sizeable low.”

Below is an updated Russell 2000 chart. Trade touched support around 1,450 on November 15, and rallied strongly. The minimum requirement for wave 5 is to reach new highs (which it already did), but the convergence of resistance levels around 1,542 (red oval) is the next most logical up side target (higher is also possible).

S&P 500 Update
The S&P 500 has basically reached our up side target around 2,600. The post-Thanksgiving week is seasonally weak, but as long as trade stays above 2,590, the S&P is likely to move towards the next resistance cluster around 2,650.
Continued analysis for the S&P 500, Russell 2000, gold, silver, euro, dollar and other equity indexes is provided via the Profit Radar Report.
Follow Simon on Twitter @ iSPYETF
0 notes
Text
S&P 500 Update: How High can it Fly?
True or false? The S&P 500 is on the longest winning streak without a 3% pullback since the Great Depression.
While you ponder the answer, here are a couple of factoids that may explain the market’s relentless, yet sneaky (no daily gain of more than 1% since September 11) advance.
The September 24 Profit Radar Report published the picture (of bearish MarketWatch headlines) below and stated:

“Our [major market top indicator] continues to confirm the latest S&P 500 highs. Investor sentiment also is not as bullish as one would expect at all-time highs. 5 of the 6 top MarketWatch headlines were bearish on Friday.
Therefore, if bearish seasonality and other short-term bearish forces fail to draw the S&P below 2,480 in the coming week (and the S&P moves above 2,530, we will have to consider a more bullish Elliott Wave Theory structure, which would likely see wave 3 extend to 2,600 +/-.”
Barron's rates iSPYETF as "trader with a good track record" and Investor's Bussines Daily says "When Simon says, the market listens." Find out why Barron's and IBD endorse Simon Maierhofer's Profit Radar Report.
The Answer
The answer to the introductory question is: True. The S&P 500 has never gone longer without a 3% pullback.
The last 3%+ correction concluded on November 3, 2016, just before the presidential election. The second longest streak ended in December 1995.
True or false? The next 3% correction is just around the corner.
Big Picture
The long-term S&P 500 chart highlights two trend channel resistance levels (see blue chart insert for zoomed-in view).

Under normal circumstances, we would expect the S&P 500 to show a significant reaction to the trend channels, but these are obviously not normal circumstances.
Based on the long-term trend channels, we could see a pullback near current trade, but unless this pullback gathers down side momentum, the S&P may grind higher to 2,600+/- before we see a larger correction.
Continued analysis - including our amazingly reliable major market top indicator (which has continually pointed higher) - is provided via the Profit Radar Report.
0 notes
Text
S&P 500 Update: Is This Rally Leg Over?
The September 5, 2016 Profit Radar Report published the chart below along with the following commentary:
“The chart below shows the long-term up side target purely based on projected symmetry. Based on the 1997 – 2013 trading range, the measured up side target is S&P 2,330 – 2,485, which is in the general vicinity of the 2,290 – 2,342 Fibonacci levels mentioned in the 2016 S&P 500 Forecast. Higher targets are possible, but we'll reassess once we get there.”

Barron's rates iSPYETF as "trader with a good track record" and Investor's Bussines Daily says "When Simon says, the market listens." Find out why Barron's and IBD endorse Simon Maierhofer's Profit Radar Report.
The second chart shows the trading activity over the past year along with short-term bars and trend lines we used to narrow down the up side target (the latest up side target was 2,494).

Short-term X-Ray
A special August 7 Profit Radar Report update featured this potent warning:
“The S&P 500 ETF (SPY) closed at a new all-time high at the lowest volume of the year. For the first time in a while, there is a bearish divergence between the S&P 500 and the NY Composite a/d lines. The ideal scenario (and tempting setup to go short) would be a spike to 2,495+ followed by an intraday reversal.”
This is almost exactly what happened. The S&P 500 spiked as high as 2,490.87 before falling 52 points.
However, this drop quickly caused an oversold condition.
A special August 10 Profit Radar Report update featured this chart and stated that:
“The CBOE equity putt call ratio (last chart) spiked to the highest reading (0.88) since April. The VIX is overbought. The VIX/VXV ratio jumped and contango fell. Both are near levels that have been seen at VIX highs. Stocks are oversold and ready to bounce. Based on the wave structure, we anticipate this bounce to be brief (2-6 days) and stay below the prior all-time highs (although the extent of the oversold condition would allow for a stronger bounce).”

Conclusion
The August 28, 2016 Profit Radar Report featured a bullish Elliott Wave Theory count with a projected up side target around S&P 2,500 (more details here: S&P 500 Update – Expect the Abnormal).
One of the images featured was a conceptual “We are here” chart (shown below). The green dots mark where we were in August 2016 (along with probability scores).

The red circles highlight where we are at today. The upcoming correction should be a choppy and frustrating wave 4 decline to be followed by another rally to new all-time highs. It then remains to be seen whether that high will be a major top or not.
Since the S&P did not quite reach our up side target, there is an alternate interpretation, which allows for continued gains almost immediately. However, that remains only an alternate unless the market tells us otherwise.
Continued analysis, with down side targets and buy/sell signals are provided via the Profit Radar Report.
0 notes
Text
Transports are Fueling Dow Theory Woes
The Dow Jones Industrial Average (DJIA) is at all-time highs, while the Dow Jones Transportation Average (DJT) just lost 6.6% and briefly dipped below its 200-day SMA.
The July 16 Profit Radar Report featured the follow DJT chart and commentary:
“The Dow Jones Transportation Average (DJT) just recently confirmed the new DJIA highs. According to Dow Theory, its good news when industrials (DJIA) and transports (DJT) fire on all cylinders (because goods produced by factories are moving off the shelves instead of accumulating as inventory).
However, the chart for DJT is looking dangerous. Fibonacci resistance (going back to 2002) is at 9,951, the center line of trend channel resistance is at 9,850, the rally since the May low is looking like a (eventually) bearish rising wedge, there is a glaring bearish RSI divergence, and it is possible to count a complete 5-wave move according to Elliott Wave Theory.
DJT 10,000 is about 2.5% away, and the odds of DJT running into serious trouble between now and 10,000 are highly elevated.
It is quite possible (even likely) that the DJT will start to head lower in the coming weeks/month while the DJIA will set a new high later on in 2017, setting up a bearish divergence between the DJIA and DJT.”
Barron's rates iSPYETF as "trader with a good track record" and Investor's Bussines Daily says "When Simon says, the market listens." Find out why Barron's and IBD endorse Simon Maierhofer's Profit Radar Report.
Below is an updated version of the same chart.
The DJT is now at trend channel support (and the 200-day SMA). In addition, the decline appears to have unfolded in 5 waves. This means:
1) A bounce is next
2) The bounce will be followed by further losses
Fast-forwarding to late 2017 or early 2018, any new DJIA all-time highs are unlikely to be confirmed by DJT, setting up a bearish Dow Theory divergence.
The iShares Transportation Average ETF (IYT) is the only ETF linked to the DJT. There is no short DJT ETF. IYT put options are one of few ways to bet on a falling DJT (once this bounce is complete).
Continued stock market analysis along with up-and down side targets and trading recommendations are available via the Profit Radar Report.
Simon Maierhofer is the founder of iSPYETF and the publisher of the Profit Radar Report. Barron's rated iSPYETF as a "trader with a good track record" (click here for Barron's profile of the Profit Radar Report). The Profit Radar Report presents complex market analysis (S&P 500, Dow Jones, gold, silver, euro and bonds) in an easy format. Technical analysis, sentiment indicators, seasonal patterns and common sense are all wrapped up into two or more easy-to-read weekly updates. All Profit Radar Report recommendations resulted in a 59.51% net gain in 2013, 17.59% in 2014, and 24.52% in 2015.
Follow Simon on Twitter @ iSPYETF
0 notes
Text
Are Stocks Quietly Deteriorating or Revving up for More Gains?
Every major market index has been marching to the beat of their own drum.
The Nasdaq-100 (QQQ) just slid to the lowest level since May 18, while the Dow Jones Industrial Average (DJIA) set a new all-time (intraday) high just on Monday. The S&P 500 (SPY) is about a percent below its all-time high.

Some reason that there’s no longer enough liquidity to buoy the whole market.
This begs the question, if all this range bound churning is a sign of internal deterioration (and the ‘inevitable’ drop) or if stocks are just taking a breather and revving up for the next spurt higher?
KISS - Bottom Line
The May 29, 2017 Profit Radar Report already observed this: “There are times when indicators line up and we discuss (high) probabilities, and there are times when indicators conflict, and we are forced to discuss possibilities. Unfortunately the later is the case right now.
Each of the major indexes is tracing out a different EWT pattern, breadth measures, seasonality and investor sentiment do not offer a clear message. Therefore we are reduced to dealing with possibilities.
The weight of evidence suggests that in the not so distant future stocks will run into some trouble. The up side target for the S&P 500 is 2,450 – 2,530. The S&P 500, Russell 2000, DJIA and Nasdaq-100 are all overbought, but above short-term support. As long as this support holds, more gains are likely.”
Barron's rates iSPYETF as "trader with a good track record" and Investor's Bussines Daily says "When Simon says, the market listens." Find out why Barron's and IBD endorse Simon Maierhofer's Profit Radar Report.
Not Exciting, but Effective
Ever since we’ve been watching support (which has been at 2,420 for the S&P 500) as stocks have gone nowhere. It should be noted that the 2,420 support level is becoming too obvious and therefore less important. The June 25 Profit Radar Report stated that: "A move below 2,420 (especially 2,400) would increase the odds that a multi-week/month top is in."
Watching support (and resistance) is not the most exciting approach to market forecasting, but there are times where it’s best to realize there are no clear signals (such as in May), and simply wait for the market to offer the next actionable clue.
This approach protects against overtrading or the anxiety associated with a non-performing (or worse, losing) trade. In short, it provides a measure of peace of mind, a rare commodity in this market.
Summary
Mid-and long-term, our comprehensive S&P 500 forecast remains on track.
Short-term, we are waiting if the S&P pushes deeper into the 2,450 – 2,530 target zone, or if the June 19 high at 2,454 was the beginning of a more protracted (but temporary correction).
Whichever direction the market breaks, it will eventually be reversed. Ideally, we are looking to sell the rips (above 2,454 if we get it) and buy the eventual dip (although this dip may last longer than many expect).
Continued updates are available via the Profit Radar Report.
Simon Maierhofer is the founder of iSPYETF and the publisher of the Profit Radar Report. Barron's rated iSPYETF as a "trader with a good track record" (click here for Barron's profile of the Profit Radar Report). The Profit Radar Report presents complex market analysis (S&P 500, Dow Jones, gold, silver, euro and bonds) in an easy format. Technical analysis, sentiment indicators, seasonal patterns and common sense are all wrapped up into two or more easy-to-read weekly updates. All Profit Radar Report recommendations resulted in a 59.51% net gain in 2013, 17.59% in 2014, and 24.52% in 2015.
Follow Simon on Twitter @ iSPYETF or sign up for the FREE iSPYETF Newsletter to get actionable ETF trade ideas delivered for free.
0 notes
Text
S&P 500 Update – Churning for a Burning?
The S&P 500 reached our minimum S&P 500 down side target and rallied strongly. Is this rally for real or are stocks just ‘churning for another burning’?
Bullish Signals
This week’s rally is credited to the French election, but a series of solid buy signals triggered days before the news from France.
The CBOE equity put/call ratio signaled a S&P 500 rally.
Contango and the VIX/VXV ratio signal a VIX decline.
The chart below - which plots the S&P 500 against the VIX, VIX/VXV ratio, CBOE equity put/call ratio, and contango – was published in the April 16 PRR along with the following commentary:
“The VIX/VXV ratio, equity put/call ratio and contango are at multi-month extremes.It appears like the amount of sellers left (needed to drive prices lower) is rather limited. The weight of evidence strongly suggests that we should focus on the upcoming buying opportunity, not on how much more down side may or may not be left.”
Barron's rates iSPYETF as "trader with a good track record" and Investor's Bussines Daily says "When Simon says, the market listens." Find out why Barron's and IBD endorse Simon Maierhofer's Profit Radar Report.

The same Profit Radar Report also highlighted positive seasonality (see below).
Bearish Caveat
This bounce is in sync with seasonality and various buy signals, but will it last?
The April 9 PRR featured the yellow projection shown below. According to this scenario (based on Elliott Wave Theory), the S&P would reverse above 2,390 and fall to new lows (2,320 or below).

The S&P 500 is above 2,390 and has entered a price zone where a relapse becomes possible.
We will be watching various breadth, money flow, sentiment and technical indicators to determine whether this rally will stop here or not.
Continuous updates are available via the Profit Radar Report.
Simon Maierhofer is the founder of iSPYETF and the publisher of the Profit Radar Report. Barron's rated iSPYETF as a "trader with a good track record" (click here for Barron's profile of the Profit Radar Report). The Profit Radar Report presents complex market analysis (S&P 500, Dow Jones, gold, silver, euro and bonds) in an easy format. Technical analysis, sentiment indicators, seasonal patterns and common sense are all wrapped up into two or more easy-to-read weekly updates. All Profit Radar Report recommendations resulted in a 59.51% net gain in 2013, 17.59% in 2014, and 24.52% in 2015.
Follow Simon on Twitter @ iSPYETF or sign up for the FREE iSPYETF Newsletter to get actionable ETF trade ideas delivered for free.
If you enjoy quality, hand-crafted research, >> Sign up for the FREE iSPYETF Newsletter
0 notes
Text
Will the Dow’s Record Streak End with a Bang?
On Monday, February 27, the Dow Jones Industrial Average (DJIA) recorded its 12th consecutive up day. This is the second longest such streak since 1930 (the longest run was 13 days in January 1987).
The S&P 500 hasn’t dropped more than 1% a day for 104 trading days.
The record gains haven’t gone unnoticed. Many sentiment indicators are in uber-bullish (bearish for stocks territory).
The investment advisors and newsletter-writing colleagues polled by Investors Intelligence are more bullish (63.10%) now than at any other time since 1987. This tumultuous span includes the 2000 tech bubble and the 2007 leverage bubble tops.
The Relative Strength Index (RSI-14) finished February above 70 on the daily, weekly and monthly chart.
However, trading volume has been suspiciously low. Despite solid gains, less than 40% of NYSE volume has been flowing into advancing stocks.
History’s Most Important Lesson
Record optimism and strong gains on low volume … anyone with a bearish disposition could (ab)use those facts to paint a pretty bearish picture.
However, history cautions against that.
Several times throughout the post-2009 bull market – and most recently on December 14, 2016 – the Profit Radar Report pointed out that historically stocks rarely ever top on peak momentum.
Barron's rates iSPYETF as "trader with a good track record" and Investor's Bussines Daily says "When Simon says, the market listens." Find out why Barron's and IBD endorse Simon Maierhofer's Profit Radar Report.
The February all-time highs occurred on peak momentum.
The green vertical lines (chart below) mark previous peak momentum (based on RSI-35) highs. None of them market major tops.
The blue lines mark strong rallies to new all-time highs on low volume (less than 40% of NYSE volume flowing into advancing stocks).

Most of those instances were followed by corrective pullbacks, but nothing worse.
Expect the Abnormal
Sometimes stocks simply push the envelope and plow higher than anyone thought possible (the S&P 500 already surpassed the 2017 year-end targets analysts set in December).
The August 28, 2016 Profit Radar Report outlined why to expect such ‘abnormal’ gains.
1) Bullish breadth thrust off the February and June 2016 lows
2) Bullish Elliot Wave Theory patterns
Although the risk of a temporary pullback is increasing, the body of evidence points towards further gains in the months to come.
The historic Dow Jones (DIA) winning streak is unlikely to be followed by a “thud”. Any correction should be viewed as a buying opportunity.
Visual forward projections (published back in August, but still valid today) and up side targets are available here: S&P 500 Update – Expect the Abnormal. In fact, the up side targets given in August have been reached. Now what? Here is the latest update: S&P 500 Reaches Up Side Target - Now What?
Simon Maierhofer is the founder of iSPYETF and the publisher of the Profit Radar Report. Barron's rated iSPYETF as a "trader with a good track record" (click here for Barron's profile of the Profit Radar Report). The Profit Radar Report presents complex market analysis (S&P 500, Dow Jones, gold, silver, euro and bonds) in an easy format. Technical analysis, sentiment indicators, seasonal patterns and common sense are all wrapped up into two or more easy-to-read weekly updates. All Profit Radar Report recommendations resulted in a 59.51% net gain in 2013, 17.59% in 2014, and 24.52% in 2015.
Follow Simon on Twitter @ iSPYETF or sign up for the FREE iSPYETF Newsletter to get actionable ETF trade ideas delivered for free.
If you enjoy quality, hand-crafted research, >> Sign up for the FREE iSPYETF Newsletter
0 notes
Text
S&P 500 Reaches Up Side Target - Now What?
The S&P 500 has reached the up side target zone highlighted in February and August/September 2016. Now what?
The August 28, 2016 PRR published the chart below and stated: “Elliott Wave Theory and the June breadth thrust suggest that any weakness will be bought (perhaps even furiously). We consider the longer-term up side potential to be significantly larger than the down side risk.”
Since the wave 2 pullback was on the shallow side, the dark green Elliott Wave Theory count (with wave 3 target around 2,390) became operative.

The September 5, 2016 Profit Radar Report said the following: “The chart below shows the long-term up side target purely based on projected symmetry. Based on the 1997 – 2013 trading range, the measured up side target is S&P 2,330 – 2,485, which is in the general vicinity of the 2,290 – 2,342 Fibonacci levels mentioned in the 2016 S&P 500 Forecast. Higher targets are possible, but we'll reassess once we get there.”

As the updated symmetry chart shows, “we are here!” Now what?

Stocks are at peak momentum (35-day RSI is at the highest level in 20+ years). As the Profit Radar Report highlighted many times in the past (most recently on December 14), stocks rarely ever top at peak momentum.
This means, we are not at a major market top. But the risk of a pullback is increasing. The latest Profit Radar Report shows the most likely spot for a pullback, along with the scope of any pullback.
Simon Maierhofer is the founder of iSPYETF and the publisher of the Profit Radar Report. Barron's rated iSPYETF as a "trader with a good track record" (click here for Barron's profile of the Profit Radar Report). The Profit Radar Report presents complex market analysis (S&P 500, Dow Jones, gold, silver, euro and bonds) in an easy format. Technical analysis, sentiment indicators, seasonal patterns and common sense are all wrapped up into two or more easy-to-read weekly updates. All Profit Radar Report recommendations resulted in a 59.51% net gain in 2013, 17.59% in 2014, and 24.52% in 2015.
Follow Simon on Twitter @ iSPYETF or sign up for the FREE iSPYETF Newsletter to get actionable ETF trade ideas delivered for free.
0 notes
Text
Short-term S&P 500 Outlook
Tunnel vision is almost always a risky approach to investing, however, this is one of those rare times where tunnel vision is actually the best way to go.
With tunnel vision I mean focusing on the (only) indicator that’s been working, and tuning out all other indicators.
Elliott Wave Theory (EWT) has been the indicator deserving of investors' focus. EWT (interpreted correctly) has persistently pointed to higher prices.
Months before the Trump rally, EWT strongly suggested a S&P 500 rally into the mid 2,300s and higher (original price projection was published here: S&P 500 Update – Expect the Abnormal).
Short-term Outlook
The December 14, 2016 Profit Radar Report expected a prolonged period of sideways trading, and after over a month of ‘go nowhere’ action, the January 29 Profit Radar Report stated that:
“The sideways trading since Wednesday looks to be wave 4 with a possible down side target of 2,280 – 2,290 (open gap at 2,284.63). Based on the bearish divergences the S&P may peel lower, but based on EWT there’s a good chance the S&P will find support in the 2,280 – 2,290 range and rally into the low-mid 2,300s.”
We now know that EWT prevailed over bearish divergences and rallied into the EWT-based up side target mentioned in February 5 Profit Radar Report:
“The S&P 500 moved above 2,290 on Friday. Measured EWT-based up side targets are in the 2,320 – 2,370 zone. Various bearish divergences (RSI-35, stocks above 50-day SMA) and near oversold condition still suggest some caution.”
No Can Do Tunnel Vision
To maintain a diversified research and forecasting approach, the Profit Radar Report looks at the most potent indicators and never relies solely on any one indicator.
Today's push to new all-time highs erased (almost) all larger bearish divergences, and synchronizes EWT more with many other indicators (only cycles are short-term bearish).

The weight of evidence points to more strength ahead (2 steps forward, 1 step back, as outlined by the January 4 Profit Radar Report). Any pauses caused by overbought conditions or investors sentiment should be short-term in nature.
Next resistance (and chance for a pullback/pause) is around 2,342. Support is at 2,320, 2,300 and 2,285 (see chart).
At some point in 2017 however, we should see either a major market top or a 15% correction. More detail is available in the multiple-indicator based 2017 S&P 500 Forecast.
Popular S&P 500 ETFs include:
SPDR S&P 500 ETF (SPY) iShares S&P 500 ETF (IVV) Vanguard S&P 500 ETF (VOO)
Simon Maierhofer is the founder of iSPYETF and the publisher of the Profit Radar Report. Barron's rated iSPYETF as a "trader with a good track record" (click here for Barron's profile of the Profit Radar Report). The Profit Radar Report presents complex market analysis (S&P 500, Dow Jones, gold, silver, euro and bonds) in an easy format. Technical analysis, sentiment indicators, seasonal patterns and common sense are all wrapped up into two or more easy-to-read weekly updates. All Profit Radar Report recommendations resulted in a 59.51% net gain in 2013, 17.59% in 2014, and 24.52% in 2015.
Follow Simon on Twitter @ iSPYETF or sign up for the FREE iSPYETF Newsletter to get actionable ETF trade ideas delivered for free.
If you enjoy quality, hand-crafted research, >> Sign up for the FREE iSPYETF Newsletter
0 notes
Text
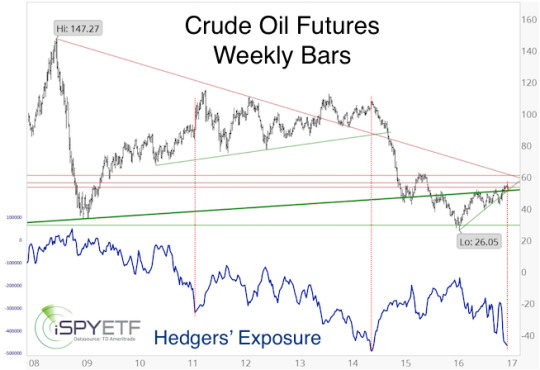
2017 Oil Forecast
Although volatile, 2016 was a good year for crude oil. The January 10, 2016 Profit Radar Report printed this outlook for 2016:
“Sentiment is bearish (which should be positive for oil), but seasonality has a minor weak spot until early February. The overall setup for oil in 2016 looks positive, with a potential buy signal early February.”
Crude oil bottomed on February 11 at 26.05.

Barron's rates iSPYETF as "trader with a good track record" and Investor's Bussines Daily says "When Simon says, the market listens."
For the second half of 2016 our indicators never really lined up to point in the same direction. There was no clear signal, which helps explains the choppy performance since the June high.
What are key indicators projecting for 2017?
Investor Sentiment
Commercial hedgers (the smart money) are betting on lower oil prices. In fact, hedgers are holding a record amount of short exposure.
The chart below was published in the January 11, 2017 Profit Radar Report. At the time, hedgers were short to the tune of 465,400 futures contracts (this has increased to 509, 138).
Nevertheless, the January 11, 2017 Profit Radar Report stated that: “As long as trade stays above 48 – 50, we will allow for higher prices.” Why?
If you enjoy quality, hand-crafted research, >> Sign up for the FREE iSPYETF Newsletter
Seasonality
Oil is one of those commodities with a very distinct seasonal pattern. Seasonality turns strongly bullish in February.
Tiebreaker: Technical Analysis
Investor sentiment suggests risk is rising while seasonality should buoy prices.
How do we reconcile this conflict between sentiment and seasonality?
Such conflicts often cause stalemates or relative trading ranges.
Based on Elliott Wave Theory, oil appears to be in a wave 4 rally (which retraces part of the 2014 – 2016 drop from 107 to 26.
Ideally wave 4 will extend higher (towards 60) before falling towards and below 26 in wave 5.
Here are the most liquid oil ETPs (Exchange Traded Products):
United States Oil Fund (USO) iPath S&P GSCI Crude Oil ETN (OIL)
ProShares UltraShort Bloomberg Crude Oil ETF (SCO) VelocityShares 3x Inverse Crude Oil ETN (DWTI)
Continued updates and trade recommendations will be available via the Profit Radar Report.
Simon Maierhofer is the founder of iSPYETF and the publisher of the Profit Radar Report. Barron's rated iSPYETF as a "trader with a good track record" (click here for Barron's profile of the Profit Radar Report). The Profit Radar Report presents complex market analysis (S&P 500, Dow Jones, gold, silver, euro and bonds) in an easy format. Technical analysis, sentiment indicators, seasonal patterns and common sense are all wrapped up into two or more easy-to-read weekly updates. All Profit Radar Report recommendations resulted in a 59.51% net gain in 2013, 17.59% in 2014, and 24.52% in 2015.
Follow Simon on Twitter @ iSPYETF or sign up for the FREE iSPYETF Newsletter to get actionable ETF trade ideas delivered for free.
If you enjoy quality, hand-crafted research, >> Sign up for the FREE iSPYETF Newsletter
0 notes
Text
Profit Radar Report’s 2017 S&P 500 Forecast
The full year S&P 500 forecast is my biggest project of the year, and quite frankly it’s kind of a thankless job. Why? It gives every critic a documented, black and white foundation for criticism.
It is impossible to predict a full year of stock market future, that's why market forecasts are loaded with ‘ifs,’ “buts,’ and other ambiguities. Anyone attempting to predict the unpredictable is doomed to miss the mark.
That would explain why no other newsletter (at least not that I’m aware of) publishes an actual full year S&P 500 chart projection (2016 projection shown below). Accountability is an underrated (if not entirely ignored) concept on Wall Street. But what’s the purpose of following many time-tested indicators if we don’t put them to work?
Subscribers to the Profit Radar Report deserve a straight-forward forecast. My goal is to provide a rough roadmap for the year ahead, based on what indicators are telling us right now.
Barron's rates iSPYETF as "trader with a good track record" and Investor's Bussines Daily says "When Simon says, the market listens."
Before we get to the 2017 S&P 500 Forecast, here is a review of the 2016 S&P 500 Forecast, published on January 31, 2016.
2016 S&P 500 Forecast Review
Below is a review (and small excerpt) of our 2016 S&P 500 Forecast, based on four key indicators (supply & demand, technical analysis, investor sentiment, seasonality and cycles). Each indicator/forecast is graded with a green pass, red fail or red/green draw symbol.
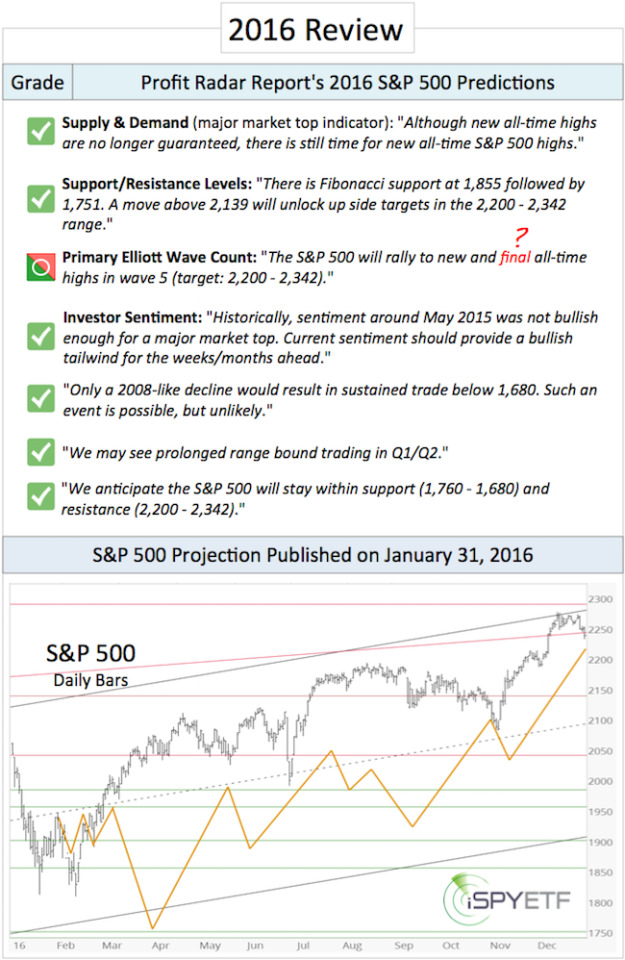
At the time of publishing (January 31, 2016), our bullish 2016 outlook was truly contrarian.
A more detailed version of the 2016 S&P 500 Forecast was published here.
2017 S&P 500 Forecast
It wouldn’t be fair to re-publish analysis paid for by subscribers here for free, but I feel comfortable sharing a few key points.
The 2016 S&P 500 Forecast featured this Elliott Wave Theory based forecast, which pointed to new all-time highs with a target around 2,290.
Our major market top indicator (click here for more details) confirmed the most recent S&P 500 highs. This means a major market top is, at minimum, months away.
The up side target has been adjusted accordingly. In fact, the 2017 S&P 500 Forecast expounds on a more bullish Elliott Wave interpretation (which was first discussed in the August 28 Profit Radar Report).
We will crosscheck the S&P 500 future S&P 500 pattern against our major market top indicators and investor sentiment (the 2017 S&P 500 Forecast includes a sentiment comparison between 2007 and 2017) to determine whether upcoming all-time highs will be a major top or not.
Beware of 15% Correction!
Despite the bullish potential, and even if this bull market has (much) further to go, the S&P 500 is likely to suffer a 15% correction in 2017.
Why and when, and much more detail, is revealed in the Profit Radar Report's 2017 S&P 500 Forecast
Simon Maierhofer is the founder of iSPYETF and the publisher of the Profit Radar Report. Barron's rated iSPYETF as a "trader with a good track record" (click here for Barron's profile of the Profit Radar Report). The Profit Radar Report presents complex market analysis (S&P 500, Dow Jones, gold, silver, euro and bonds) in an easy format. Technical analysis, sentiment indicators, seasonal patterns and common sense are all wrapped up into two or more easy-to-read weekly updates. All Profit Radar Report recommendations resulted in a 59.51% net gain in 2013, 17.59% in 2014, and 24.52% in 2015.
Follow Simon on Twitter @ iSPYETF or sign up for the FREE iSPYETF Newsletter to get actionable ETF trade ideas delivered for free.
0 notes
Text
Two Diametrically Opposed Sector Opportunities
The S&P 500 is trading at the same level where it was on July 8. Such a 15-week chop zone is pretty boring, but it doesn’t stop there. The S&P hasn’t made any net progress since May 2015.
When the broad market is stale, it makes sense to look at other opportunities.
The Profit Radar Report always scans various markets and sectors for sentiment extremes or seasonal trades with the potential to provide returns independent of the broad market.
Thus far this year, we’ve found such returns in gold, silver, natural gas, small caps, VIX and the utility sector.
Utilities ETF
The October 12 Profit Radar Report pointed out that every single utility sector stock has been below its 50-day SMA for more than five days. An extremely rare oversold condition.
The October 13 Profit Radar Report observed that: “XLU (Utilities Select Sector SPDR ETF) jumped above trend line resistance on strong volume. This increases the odds that some sort of a low is in place. We are buying XLU at 47.80."

We didn’t want to chase the S&P 500 when it bounced from its 2,120 support level on October 13, but wanted some low-risk exposure to equities.
Being oversold and overhated, XLU fit the bill.
If you enjoy quality, hand-crafted research, >> Sign up for the FREE iSPYETF Newsletter
Sometimes there is no particular up side target (as is the case with XLU), but identifying low-risk buying opportunities allows investors to either grab quick gains or hold on and ‘play with house money.’
Bank ETF
The banking sector is approaching a very strong resistance cluster.
The chart of the SPDR S&P Bank ETF (KBE) shows price near trend line resistance, 78.6% Fibonacci retracement, and where wave A equals wave C.
Additionally, there was a bearish RSI divergence at the October 27 high.
Seasonality is bearish for the first three weeks of November.
This doesn’t mean that bank stocks will crash, but it certainly indicates that buying KBE right around 35 is a risky idea.

There is no short bank ETF, but traders may consider shorting KBE or buying inverse ETFs like SEF or SKF. This setup may only lead to a short-term correction.
Simon Maierhofer is the founder of iSPYETF and the publisher of the Profit Radar Report. Barron's rated iSPYETF as a "trader with a good track record" (click here for Barron's profile of the Profit Radar Report). The Profit Radar Report presents complex market analysis (S&P 500, Dow Jones, gold, silver, euro and bonds) in an easy format. Technical analysis, sentiment indicators, seasonal patterns and common sense are all wrapped up into two or more easy-to-read weekly updates. All Profit Radar Report recommendations resulted in a 59.51% net gain in 2013, 17.59% in 2014, and 24.52% in 2015.
Follow Simon on Twitter @ iSPYETF or sign up for the FREE iSPYETF Newsletter to get actionable ETF trade ideas delivered for free.
0 notes
Text
S&P 500 and Nasdaq Reveal Priceless Clues
For the past couple of months we’ve stuck to our short-term bearish and mid-term bullish outlook (the mid-term bullishness may morph into long-term bullishness).
This means, we’ve been buying dips, but refusing to chase trade to the up side.
We got the first buyable dip on September 9. Between September 9 -13 we bought the SPDR S&P 500 ETF (SPY), iShares Russell 2000 ETF (IWM), and VelocityShares Short-term VIX ETN (XIV).
1st Tell Tale Sign
However, the September 20 Profit Radar Report warned that: “In February and June stocks produced a breadth thrust from their low. Thus far however, the S&P 500 hasn't shown any convincing follow through to the up side. The odds of soaring without a prior test or break of the lows have diminished. We are taking some chips off the table.”
Barron's rates iSPYETF as "trader with a good track record" and Investor's Bussines Daily says "When Simon says, the market listens." Find out why Barron's and IBD endorse Simon Maierhofer's Profit Radar Report.
Over the next few days, we sold IWM and XIV for gains of 2.33% - 14.46%. We continued to hold SPY in case stocks move higher, but closed that position at breakeven on October 4.
The chart below, initially published in the September 11 Profit Radar Report, shows the potential down side targets based on Fibonacci retracement levels.
click here to view chart
Ultimately, the scope of this correction depends on whether stocks will retrace the gains since the February low (S&P: 1810) or June low (S&P: 1,992).
We believe the retracement will be more on the shallow side, that’s why we bought the first buyable dip in September.
2nd Tell Tale Sign
The October 2 Profit Radar Report highlighted a concerning Nasdaq constellation: “The Nasdaq-100 and QQQ ETF are near trend channel resistance, and perhaps more importantly, near Fibonacci resistance and the 2000 all-time high (RSI and Nasdaq stocks above their 50-day SMA did not confirm this high). We expect new all-time highs later this year, but if QQQ is going to take a breather, it could be around 120+/-.”
Yesterday (Monday), QQQ matched the September 22 all-time closing high at 119.48, but RSI deteriorated even further, a bearish omen.
click here to view chart
3rd Tell Tale Sign
Although the S&P 500 was stuck in a triangle with lower highs and higher lows, internal strength was wilting (the McClellan Oscillator and Summation Index made lower lows – see bottom graphs). The chart below was published in the October 9 Profit Radar Report.
click here to view chart
Summary
It seems like stocks want to correct further before moving higher. This correction could stop in the 2,120 – 2,100 zone, but it could also go quite a bit lower.
We will be looking to buy the dip, because a number of indicators suggest a strong rally following this correction.
When we buy, depends on the structure of the decline, bearish sentiment extremes, and whether we see bullish divergences. The Profit Radar Report already identified a beaten down low-risk value ETF and an aggressive high octane ETN with a built in safety cushion to take advantage of the year-end rally.
Simon Maierhofer is the founder of iSPYETF and the publisher of the Profit Radar Report. Barron's rated iSPYETF as a "trader with a good track record" (click here for Barron's profile of the Profit Radar Report). The Profit Radar Report presents complex market analysis (S&P 500, Dow Jones, gold, silver, euro and bonds) in an easy format. Technical analysis, sentiment indicators, seasonal patterns and common sense are all wrapped up into two or more easy-to-read weekly updates. All Profit Radar Report recommendations resulted in a 59.51% net gain in 2013, 17.59% in 2014, and 24.52% in 2015.
Follow Simon on Twitter @ iSPYETF or sign up for the FREE iSPYETF Newsletter to get actionable ETF trade ideas delivered for free.
If you enjoy quality, hand-crafted research, >> Sign up for the FREE iSPYETF Newsletter
0 notes
Text
Are Gold and Silver Setting up for a Slingshot Move?
Gold and silver have been stuck in their respective trading range for three months.
How long the yawning continues remains to be seen, but a slingshot move would be a welcome change of pace. What is a slingshot move? It’s a powerful directional move preceded by a fakeout step.
The review below explains the potential slingshot setup:
The July 4 and July 7 Profit Radar Reports highlighted various conflicting indicators and decided that: “With both metals approaching our up side targets, we don’t want to chase trade.”
Barron's rates iSPYETF as "trader with a good track record" and Investor's Bussines Daily says "When Simon says, the market listens." Find out why Barron's and IBD endorse Simon Maierhofer's Profit Radar Report.
The chart below, published via the July 7 Profit Radar Report, shows two of the conflicting indicators for gold:

- Investor Sentiment (commercial hedgers’ exposure – light blue graph): Bearish for gold - Seasonality (dark blue graph): Bullish for gold
Silver essentially suffered the same conflict and was nearing a resistance clusters.
The July 4 Profit Radar Report showed the chart below along with the following commentary:

“Silver is overbought. In general, large spikes are followed by sideways trading or sizeable drops. Aggressive traders may find success shorting silver (corresponding ETF: ZSL).”
In hindsight it becomes obvious that bullish seasonality and bearish sentiment cancelled each other out, resulting in the three-month stalemate.
If you enjoy quality, hand-crafted research, >> Sign up for the FREE iSPYETF Newsletter
Some sort of a trading range is usually the result when our indicators are in conflict, that’s why we generally don’t trade during such periods (the Profit Radar Report’s last precious metals recommendation was to buy gold at 1,088 in November 2015).
The Slingshot Move
As the above charts show, gold and silver reached the low end of our up side targets. Gold and silver have been stair-stepping lower ever since (see updated charts below).


Our intention was to short gold and silver in their respective resistance areas. Unfortunately they never fully got there.
New Bear Market Lows?
The question now is whether the top is in or not?
The best-case scenario would be a swift rally into the red resistance zone (above 1,380 for gold, above 21.2 for silver). We’d consider this rally the slingshot move (fakeout rally before sizeable decline).
The rally to new recovery highs would get bulls excited just before a considerable down side reversal (and quite possibly a drop below $1,000/oz for gold).
However, the best-case scenario may not happen. Gold and silver as good as touched the bottom of our up side targets, which may be enough. A sizeable top may already be in place (watch green support areas).
The strategy for precious metals is to sell the bounces. Now we just need to figure out how big the bounces will be.
Continuous updates for gold and silver are available via the Profit Radar Report.
Simon Maierhofer is the founder of iSPYETF and the publisher of the Profit Radar Report. Barron's rated iSPYETF as a "trader with a good track record" (click here for Barron's profile of the Profit Radar Report). The Profit Radar Report presents complex market analysis (S&P 500, Dow Jones, gold, silver, euro and bonds) in an easy format. Technical analysis, sentiment indicators, seasonal patterns and common sense are all wrapped up into two or more easy-to-read weekly updates. All Profit Radar Report recommendations resulted in a 59.51% net gain in 2013, 17.59% in 2014, and 24.52% in 2015.
Follow Simon on Twitter @ iSPYETF or sign up for the FREE iSPYETF Newsletter to get actionable ETF trade ideas delivered for free.
0 notes