
Oceanography and Fisheries Open access journal (OFOAJ) is a peer reviewed, premium quality journal that aims to showcase advanced research in the field of Oceanography and Fishery science and all the related areas
Don't wanna be here? Send us removal request.
Statistics
We looked inside some of the posts by juniperpublishersoceanography and here's what we found interesting.
Average Info
Notes Per Post
0
Likes Per Post
0
Reblog Per Post
0
Reply Per Post
0
Time Between Posts
6 days
Number of Posts By Type
Text
17
Last Seen Tumblr Blogs


Fun Fact
When “GIF” was named word of the year in 2012, Oxford Dictionaries U.S.A. credited Tumblr for pushing the word.
Text
Controlling Factors of the Population Dynamics of Two Dominant Bivalves of the Macro-benthic Community on the Sandy Tidal Flats

Authored by: Hiroaki Tsutsumi
Abstract
The edible short-neck clam, Ruditapes philipinnarum, is one of the most dominant species in the macro-benthic community on the sandy tidal flats that face Ariake Bay in Kumamoto Prefecture, western Japan. Until the 1970s, over 40,000 tons of the clams were collected per year on the tidal flats. However, the dense patches disappeared, and the clam-harvesting fishery has suffered from extremely poor catches of less than 500 tons per year over the past three decades. We conducted environmental assessments of the sediment and did quantitative surveys of the macro-benthic community on Midori River Tidal Flats located in Kumamoto between April 2017 and April 2019 and tried to find the reasons why the clam population markedly declined. Asian mussels (Arcuatula senhousia) and short-neck clams predominated the macro-benthic community on the tidal flats. However, the former species was subject to heavy predation by ducks that visited the tidal flats during the winter, while the latter one suffered from predation by rays during the warm seasons. Although Asian mussels also affected the occurrence of short-neck clams by formation of muddy carpets on the sediment, they were accidentally destroyed due to strong wind and waves caused by a typhoon.
Keywords: Asian mussels; Muddy carpet; Population dynamics; Predation; Short-neck clams; Tidal flats
Introduction
Approximately 20,000 ha of tidal flats still remain along the coast of Ariake Bay, Kyushu, western Japan. There, innumerable blue spotted mud hoppers (Boleophthalmus pectinirostris), fiddler crabs (Uca arcuata), crabs (Macrophthalmus japonica), etc., feed on benthic diatoms thickly covered on the surface of the muddy bottom [1], and various suspension feeding clams including Ruditapes philippinarum (short-neck clams), Meretrix lusoria (Japanese hard clams) and Mactra venerformis (surf clams), etc. occur densely on the sandy bottom[2,3]. In the coast of Kumamoto Prefecture that faces Ariake Bay, most of the tidal flats are sandy, and have been used as fishery grounds for harvesting clams. Until the late 1970s, 40,000 to 65,000 tons of short-neck clams were collected on the tidal flats per year, which accounted for approximately half of the national annual catch of the clams in those days. However, it dramatically decreased in the 1980s, and declined to less than 500 tons in 1995, although the total area of the tidal flats was kept intact and the clam harvesting activities had been strictly controlled by fisherman’s associations to avoid over-fishing [4].
Nevertheless, until today, it has not shown significant recovery [5,6] (Figure 1). This dramatic decline of the clam catch indicates that the abundant primary production by microphytobenthos and phytoplankton on the tidal flats, which are available for the clam as main diets [7], is not reflected as the secondary production of the clams in the past four decades. Previous studies dealing with the occurrence of the clam on the tidal flats in Kumamoto Prefecture have found various causes of the collapse of clam harvesting fishery on the sandy tidal flats, which involve environmental disturbances due to the occurrence of extremely low salinity caused by a large amount of freshwater discharged from the river and deposition of mud transported from the upper reaches of the river during the rainy season [8], the elevation of manganese content of the sediment to intolerable levels for juveniles just after the settlement [9,10], the decrease of planktonic larvae produced during the breeding season [11], and the predation by moon snails (Glossaulax didyma) and rays (Aetobatus flagellum and Hemitrygon akajei) [12,13].
Recently, the sandy tidal flats have been thickly covered by the muddy carpets created by Asian mussels (Arcuatula (Musculista) senhousia) across the Japanese coast [14]. Those in Kumamoto Prefecture are not exceptional [15-17]. They provide new micro-habitats that enable various infaunal animals occur in them, while the sediment under them tends to fall to extremely reduced conditions as original dominant members of suspension-feeding bivalves, including short-neck clams, duck clams (Mactra quadrangularis) and razor clams (Solen strictus), etc. cannot physiologically adapt [14,15,18]. This species has invaded to the lagoons in various countries including New Zeeland [19], Australia [20,21], Europe [22-24], North America [25,26] etc., and given negative impacts on the domestic benthic ecosystem, as established dense patches with the muddy carpets [27]. The latest studies on the impact of the formation of muddy carpets by the Asian mussel on the sandy tidal flats revealed that it not only created intolerable environmental conditions for suspension-feeding clams in the sediment, but also created diet-short conditions for them by promoting the deposition of organic particles suspended in the water inside the muddy carpets [17,28].
This behavior of Asian mussels appears to be a kind of “indirect exploitative type of interference” to co-occurring other species as monopolize the food resources before the competitive species utilize them [29]. Thus, Asian mussels that create muddy carpets have potentially a strong capacity for occupying surface space on the sediment of the soft bottom just like Mediterranean mussels tend to monopolize the rock surface on the rocky shore [30,31]. The invasion process by Asian mussel on the tidal flats starts by mass settlement of planktonic larvae just after the breeding season in summer. Tsutsumi et al. [15] described the invasion process as it could establish dense patches around 5,000 ind. m-2 and 2,000 gww m-2 creating muddy carpets within several months once its mass recruitment occurred, and finally the position of the predominant species of the macro-benthic community was totally replaced with short-neck clams. None of the animals could affect the population fluctuations of the Asian mussels in this study conducted in 2008 to 2009 as long as its dense patches were mechanically destroyed by the experiment that artificially turned over the sediment with a power shovel.
In the previous studies, as predatory animals on Asian mussels in Japan, Yamamuro et al. [32] reported that several species of diving ducks that visited a lagoon for wintering favored to feed on Asian mussels and gave a marked impact on abundance during the winter. Ito [33] also found the shells of Asian mussels from the stomach contents of a specimen of dabbling duck, Anas platyrhynchos, captured beside the red algae, nori, cultivation farms set on the tidal flats. Nori has been cultivated extensively on the tidal flats and their offshore areas across the Japanese coast during the winter, and recently suffered from serious feeding damage by ducks [33-35]. In this study, we conducted the environmental assessments of the sediment and quantitative surveys of macro-benthic community on Midori River Tidal Flats, which has been one of the major sandy tidal flats that face Ariake Bay in Kumamoto Prefecture, between April 2017 and April 2019.
Here, short-neck clam-harvesting fishery activity is still carried on throughout the year, while nori cultivation farms are also set extensively during the winter. Short-neck clams originally predominated the macro-benthic community on the tidal flats, but mass-settlement of Asian mussels has recently occurred and followed the formation of muddy carpets [15]. In this paper, we report the results of the environmental assessments of the sediment and quantitative surveys of macro-benthic community on the tidal flats, analyze the mechanisms of the seasonal fluctuations of the populations of the two competitive dominant bivalves in the macro-benthic community, and discuss what factors mainly controlled their population dynamics and what we should do to re-establish dense patches of short-neck clams to recover its harvesting fishery on the tidal flats as much as actively done in the 1970s.
Materials and Methods
The Midori River Tidal Flats is located at the river mouth of Midori River, Kumamoto, Kyushu, western Japan. It extends 5 km toward the offshore with the area of approximately 2,200 ha during the low tide in spring tide. We established a sampling site at the lower part on the tidal flats (N 32° 43′ 35.3″,E 133° 41′ 11.5″, Figure 2), where clam-harvesting fishery activity was actively carried on until the 1980s. The sampling site appears above the water when the tide level has descended to less than 40 cm.
We conducted field surveys at the sampling site during the low tide in spring tide monthly or bimonthly (15 times in total) between April 2017 and April 2019. At each sampling occasion, we collected a sediment sample up to the depth of 5 cm with a core sampler (5 cm x 5 cm x 5 cm), which was kept in a plastic bag. We also collected ten sediment samples for quantitative sampling of macro-benthic animals with a core sampler (10 cm x 10 cm x 5 cm). Each sample was sieved with a 1 mm opening mesh, and the residues retained on the mesh were kept in a plastic bag with 10 % formalin solution and a dye, Rose Bengal.
At the laboratory, the particle size composition of the sediment was determined with the sediment sample by wet-sieving method. The samples fixed with formalin solution were washed and sieved on a 1 mm opening mesh again. All of the macro-benthic animals were sorted from the residues on the mesh and identified as to its species. The total number and the wet weight of each species were confirmed. The shell lengths of the specimens of Asian mussels and short-neck clams were measured with a digital caliper.
The daily changes ratios of density (DCRD) and biomass (DCRB) of Asian mussels and short-neck clams were calculated with the following equations between two successive sampling occasions.
DCRD = (Densityi - Densityi-1)/(Di - Di-1)
DCRB = (Biomassi - Biomassi-1)/(Di- Di-1)
Densityi: Density at the sampling occasion I; Biomassi: Biomass at the sampling occasion I; Di : The number of days that passed from the survey start, 27 April 2017.
The shell length frequency distributions of the populations of Asian mussels and short-neck clams were drawn with the data of the shell length of the specimens collected at each sampling occasion, and they were treated with moving average method once by calculating the mean frequency at each shell length class every mm with shorter and larger classes to get a smoother shell length frequency distribution. In general, the shell length frequency distribution of the population is polymodal, since it is made up of a number of monomodal ones of the cohorts. It can be divided into these with a graphic method modified from Harding [36] for cohort analysis, which was computer-programmed as PROGEAN (PROgram for Generation Analysis) for a personal computer, NEC PC9801 series [37]. The shell length frequency distributions of the populations of Asian mussels and short-neck clams were divided to those of the cohorts, using PROGEAN Ver. 4.0.
Results
Seasonal Changes in Grain Size Composition of the Sediment
Figure 3 indicates seasonal changes of the grain size composition of the sediment at the sampling site on the tidal flats between April 2017 and April 2019. The mud content of the sediment (the weight composition of fine particles of less than 63 µm in diameter) was kept above 9.8 % between April and November 2017, and the highest one, 41.3 %, was noted in May. This high mud content of the sediment was caused by the bio-deposition of fine particles suspended in the water by Asian mussels. The sediment surface was covered by muddy carpets created by this species (Figure 4a).
The mud content of the sediment rapidly decreased to 9.8 % in July, once recovered to 17.3 % in August, but decreased from 13.5 % in November 2017 to 1.0 % in January 2018 again. Since then, it fluctuated within a narrow range between 0.9 and 3.5 % until August 2018. In this period, 77.4 to 90.1 % of the sediment was made up of three components of sand (coarse sand: 500 to 1,000 µm, medium sand: 250 to 500 µm, and fine sand: 125 to 250 µm in diameter) (Figure 4b), which is the original conditions of the sediment as sandy tidal flats without the muddy carpets [4]. In October 2018, the sediment surface was temporarily covered by the muddy carpets again, and the mud content of the sediment increased to 11.5 % (Figure 4c). However, it returned to the sandy sediment with the mud content of less than 1 % by March 2019 (Figure 4 d).
Seasonal Changes of Density of Macro-Benthic Community
Figure 5a indicates seasonal fluctuations of the density of the macro-benthic community at the sampling site between April 2017 and April 2019. The community involved two exclusively dominant species, Asian mussels (A. senhousia) and short-neck clams (R. philippinarum), which occupied 48.1 % and 34.7 % of all of the specimens collected in this study, respectively. The remaining 17.2 % of the community was made up of Reticunassa festiva (snails), amphipods, polychaetes, etc. Asian mussels established dense patches of 11,290 ind. m-2 in May 2017, but the density suddenly decreased to about its half, 5,670 ind. m-2,in July. The density remained 3,670 ind. m-2 in August and 5,190 ind. m-2 in November but decreased to only 180 ind. m-2 by January 2018 and remained in low densities of 30 to 1,200 ind. m-2 until June 2018.
This species explosively increased its density from June and established extremely high-density patches of 92,140 ind. m-2 only within a couple of month and kept the dense patches of 25,610 ind. m-2 until October. However, the dense patches collapsed during the late autumn and winter again as did in the last year and returned to the extremely low density of only 40 ind. m-2 by March 2019. Short-neck clams showed more stable fluctuations of the density between 1,320 and 4,310 ind. m-2 between April 2017 and January 2018. The density increased to 39,340 ind. m-2 in May, but it also decreased to only 300 ind. m-2 by October, and the low-density patches of 200 to 410 ind. m-2 remained until April 2019. The total density of other macro-benthic animals gently fluctuated between 720 and 6,020 ind. m-2 throughout the period of this study except 17,960 ind. m-2 in April 2018.
Figure 5b indicates seasonal fluctuations of DCRD values of two exclusive dominant bivalves between May 2017 and April 2019. They further clearly show the characteristics of the seasonal fluctuations of the densities of these two species. In Asian mussels, they were characterized by an explosive increase between July and August 2018 (+3,108 ind. m-2 d-1), small scales of decreases between May and August 2017 (-96.9 ind. m-2 d-1 in July and -74.1 ind. m-2 d-1 in August) and between November 2017 and January 2018 (-84.9 ind. m-2 d-1 in January) and a collapse of dense patches between August and December 2018 (-887 ind. m-2 d-1 in October and -374 ind. m-2 d-1 in December). In short-neck clams, they were characterized by the stable fluctuations of the density between April 2017 and January 2018 (-30.3 to +27.1 ind. m-2 d-1) and followed by a rapid increase between January and May 2018 (+383 ind. m-2 d-1 in April, +112 ind. m-2 d-1 in May) and a collapse of the dense patches between May and August 2018 (-798 to -100 ind. m-2 d-1).
Seasonal Changes of Biomass of Macro-Benthic Communities
Figure 6a indicates seasonal fluctuations of the biomass of the macro-benthic community expressed by wet weight at the sampling site between April 2017 and April 2019. In biomass, Asian mussels and short-neck clams also predominated the macro-benthic community and occupied 47.1 % and 42.3 % of the total biomass of the specimens collected in this study, respectively. The remaining 10.6 % was made up of R. festiva, amphipods, polychaetes, etc. as the same manners with the density. The fluctuation patterns of the
biomass of the two dominant species roughly coincided with those of their densities. Asian mussels established dense patches of 5,186 gww m-2 in May 2017, but the biomass decreased to only 0.8 gww m-2 by July 2018. It rapidly increased to 1,406 gww m-2 by October once, following the explosive increase of the density (Figure 5a), but decreased to only 3.9 gww m-2 by March 2019 again. In contrast, the biomass of short-neck clams gradually increased from 452 gww m-2 in April 2017 to 3,572 gww m-2 in April 2018. However, it also decreased to 993 gww m-2 in May and decreased to only 5.8 gww m-2 by March 2019, although it once soon recovered to 2,274 gww m-2 in June 2018.
Figure 6b indicates seasonal fluctuations of DCRB values of the two exclusive dominant species at the sampling site between May 2017 and April 2019. The changes of DCRB values clearly revealed the occurrence of big changes of their biomass further. In Asian mussels, the fastest decline of biomass occurred between May and August 2017 (-32.2 gww m-2 d-1 in July, -74.9 gww m-2 d-1 in August), and it also suffered from the decline of the biomass during the autumn and winter (-8.2 gww m-2 d-1 in November 2018 and -10.5 gww m-2 d-1 in January 2018; -18.2 gww m-2 d-1 December 2018 and -5.4 gww m-2 d-1 in March 2019). The biomass increased between July and October 2018 (+27.0 gww m-2 d-1 in August, +8.3 gww m-2 d-1 in October 2018), following the explosive increase of the density (Figure 5a). In short-neck clams, the DCRB value had ranged between +3.0 and +21.0 gww m-2 d-1 until April 2018 except -10.1 gww m-2 d-1 in November 2017. It decreased to -56.1 gww m-2 d-1 in May 2018, once returned to positive, 42.7 gww m-2 d-1, in June, but it became negative again -48.4 gww m-2 d-1 in July and -23.1 gww m-2 d-1 in August.
Analysis of Frequency Distribution of Shell Length in the Population
The population dynamics of the two dominant bivalves, Asian mussels, and short-neck clams, in the macro-benthic community between April 2017 and April 2019 are characterized as mentioned below, based on the results of the analysis of seasonal fluctuations of the densities and biomass. We checked each of the characteristics of the population dynamics of these two species with the changes of their shell length frequency distributions (Asian mussels in Figure 7a, short-neck clams in Figure 7b) to clarify the mechanisms that caused each of the characteristic events.
Asian Mussels
Rapid decline of the biomass between 28 May and 21 August 2017
The shell length frequency distribution of the population on 21 August 2017 indicates that the population was made up of three cohorts with the shell length of 18.6±2.1 mm (mean ± S.D.)(Cohort 1), 13.4 ± 1.9 mm (Cohort 2) and 5.7 ± 1.7 mm (Cohort 3). The rapid decline of the biomass of the population (from 5,186 gww m-2 in May to 1,297 gww m-2 in August) was responsible for the marked decrease of density of Cohort 1 (from 10,819 ind. m-2 in May to 1,808 ind. m-2 in August) .
Rapid decline of the density and biomass between 8 November 2017 and 6 January 2018
The newly recruited Cohort 3 to the population in August grew up to the shell length of 9.9 ± 1.9 mm with the density of 5,054 ind. m-2 on 8 November 2017, but most members disappeared on 6 January 2018. This event indicates that Cohort 2 was subject to a strong mortality factor during this period.
Explosive population growth between 14 July and 27 October 2018
Mass recruitment by Cohort 5 to the population initiated on 14 July 2018. 42,950 ind. m-2 of the mode density of its shell length frequency distribution was recorded at the shell length class of 3 to 4 mm on 12 August, and it formed dense patches with the density of 25,610 ind. m-2 and biomass of 1,406 gww m-2 on 27 October.
Collapse of Cohort 5 between 27 October 2018 and 22 March 2019
The population was made up of only a single cohort, Cohort 5, in October 2018. As shown in the shell length frequency distribution of the population, it rapidly declined and almost disappeared by 22 March 2019, in the same manners as the rapid decline of Cohort 3 between 8 November 2017 and 6 January 2018. Thus, most members of the cohort, which were recruited to the population in the breeding season in early summer, suffered from a strong mortality factor during the late autumn and winter.
Stable fluctuations of the density and gradual increase of biomass between 27 April 2017 and 6 January 2018
The shell length frequency distribution of the population on 28 May 2017 indicates that the population was made up of four cohorts, which had the shell lengths of 29.2 ± 0.9 mm (mean ± S.D.)(Cohort 1), 21.4 ± 2.6 mm (Cohort 2), 11.8 ± 2.0 mm (Cohort 3) and 3.5 ± 1.9 mm (Cohort 4), respectively. Short-neck clams have two breeding seasons (spring and late autumn) in Kumamoto in a year (Kumamoto Prefecture Fisheries Research Center, 2006). The recruitment of a new cohort to the population was clearly recognized in the shell length frequency distribution of the population in each of two breeding seasons in 2017. Consequently, the clam population consisted of four cohorts, which had the shell lengths of 31.4 ± 2.3 mm (Cohort 3), 20.6 ± 2.2 mm (Cohort 4), 13.6 ± 2.9 mm (Cohort 5) and 3.1 ± 1.5 mm (Cohort 6) on 6 January 2018. Thus, the growth and survival processes of these cohorts could be traced along the changes of the shell length frequency distribution of the population during this period. It indicates that the clam population was not subject to strong mortality factors.
Rapid increase of density between 6 January and 17 May 2018
Cohort 6 first appeared in the shell length frequency distribution of the population on 6 January 2018, and it expanded to a mass recruitment with peak densities of around 9,100 ind. m-2 at the shell length classes of less than 4 mm on 17 May 2018. Actually, the members of this cohort have already settled on the sediment during the autumn breeding season in 2017, but they were too small to retain on the sieve with 1 mm opening mesh used for sampling. As they grew up to the shell sizes that retained on the sieve in the spring, the density rapidly increased.
Rapid decline of the biomass between 1 April and 17 May 2018
The density of the population slightly increased from 34,179 ind. m-2 to 39,340 ind. m-2 in this period (Figure 5a), while its biomass markedly decreased from 3,752 gww m-2 to 993 gww m-2 (Figure 6a) and the largest negative DCRB, -56.1 gww m-2 d-1, was noted on 17 May 2018 (Figure 6b). These contradictory changes between the density and biomass of the population were responsible for the selective elimination of Cohort 4 and Cohort 5 with the shell length of more than 17 mm from the population (see inside the frame in Figure 7b). However, this loss was compensated by the rapid increase of Cohort 6 in number.
A sign of the drastic change of the population between 17 May and 16 June 2018
The density of the population decreased to less than half in this period (15,390 ind. m-2, Figure 5a, but its biomass, nevertheless, temporarily recovered to more than double (2,274 gww m-2, Figure 6a). The fast individual growth of Cohort 6 (from 4.2±2.2 mm to 8.5±2.9 mm in shell length) due to warm conditions contributed to the increase of biomass of the population.
Collapse of the population between 16 June and 27 October 2018
The population that consisted of only Cohort 6 collapsed, and its density and biomass decreased to only 300 ind. m-2 (Figure 5a) and 61.1 gww m-2 (Figure 6a) in this period. Judging from the changes of the shell length frequency distribution of the population, the members of the population except small individuals just after the recruitment had been subject to a strong mortality factor for some reason during the warm seasons since 1 April 2018.
Scarce recruitment to the population in the spring in 2019
The population remained in the extremely low density of less than 410 ind. m-2 between 27 December 2018 and 21 April 2019, since the numbers of the recruits that should be recognized as Cohort 7 and Cohort 8 were scarce after both of the breeding seasons in the spring and autumn.
Discussion
Factors Controlling the Population Dynamics of Asian Mussels
In this study, Asian mussels suffered from severe population decline in two different seasons (the summer in 2017, and the autumn in 2017 to the winter in 2018 and the autumn in 2018 to the winter in 2019). In the former case, the dense patches of Asian mussels with the density of 11,290 ind. m-2 and biomass of 5,186 gww m-2 on 28 May 2017 rapidly declined to less than one third of the density and about a quarter of the biomass by 21 August (Figure 5a, 6a). This species has a breeding season in July and mass recruitment of juveniles should occur to the population as it did in July to August 2018, but the number of the recruits was much restricted in 2017 (Figure 7a. In contrast, the population of short-neck clams fluctuated stably, even increasing the biomass three time larger in the same period (from 544 gww m-2 to 1,548 gww m-2). Although the habitats of these two species totally overlap on the tidal flats, the utilization in the micro-habitat level is markedly different between them. Asian mussels create muddy carpets on the sediment [38], while short-neck clams burrow the sediment [39]. Therefore, this event indicates that some strong mortality factor acted on only the benthic animals that occurred on the surface of the sediment, but it did not happen during the same season in 2018.
The seasonal fluctuations of the particle size composition of the sediment give a big hint to specify the cause of the rapid decline of Asian mussel population. The mud content of the sediment noted 41.3 % on 28 May 2017 due to the creation of muddy carpets by Asian mussels (Figure 4a), but it decreased to only 9.8 % on 25 July (Figure 3), when most of the muddy carpets disappeared and bare sandy surface appeared on the tidal flats (Figure 8a). This event indicates that a strong physical disturbance happened on the sediment, and most of the muddy carpets were washed away sometime in this period. According to the weather records at the local meteorological observatory in Kumamoto City, which is about 9 km apart from the study area, strong wind with 29.0 m·s-1 of the maximum instantaneous wind speed blew on 4 July 2017 due to a typhoon approached to the study area [40]. It is very likely that the muddy carpets with dense patches of Asian mussels were removed extensively from the tidal flats by the strong wind and waves caused by the typhoon.
In the latter case of the rapid decline of Asian mussel population during the autumn and winter, this event first reported on the present study area during the late autumn in 2014 and winter in 2015 [17]. The patches with the density of about 24,000 ind. m-2 and biomass of about 4,010 gww m-2 formed on 26 November in 2014 drastically decreased to the ones with 100 ind. m-2 and less than 10 gww m-2 by 8 March 2015, although no causes were not noted. At first, we suspected the possibility of the influence of severe winter weather. However, the weather in November and December in Kumamoto when this event starts is usually still warm, and the lowest daily mean temperature during the winter had never fallen below 0 °C except one day (-0.4 °C) in January 2011 in the past two decades [41]. It would be hard to attribute the rapid decline of the population of Asian mussels to the influence of intolerable low temperature.
In the follow-up study, we found that a large group of dabbling ducks including Anas platyrhynchos and An. acuta visited the tidal flats for feeding during low tides (Figure 8b), and the shells of Asian mussels and small juveniles of short-neck clams were found in the stomach contents of a dead individual of An. platyrhynchos) (Figure 8c). Every year, a large group of the ducks migrate from Siberia to Kumamoto for wintering [42]. It is very likely that the migratory ducks recently give a serious predation impact on the population persistence of Asian mussels and short-neck clams on the tidal flats during the late autumn and winter. In the previous studies on the feeding behaviors of the ducks on the Japanese coasts, Yamamuro et al. [32] found that three species of diving ducks (Aythya fuligula, Ay. ferina, and Ay. marila) fed mainly on bivalves including Asian mussels in estuarine lagoons that face Japan Sea, and gave a serious predation pressure on the bivalves during the winter.
On the tidal flats and near-shore areas in western Japan, nori cultivation fields are established extensively during the winter, which recently suffer from serious feeding damage by both of dabbling and diving ducks, and shells of the bivalves including Asian mussels were found with nori from their stomach contents [33-35]. Nori cultivation is popular on the tidal flats in the coast of Ariake Bay of which are the centers of the nori cultivation in Japan. All tidal flats of the bay including the present study area seem to be ones of the convenient feeding sites for the ducks during the low tide since they are able to feed on bivalves just walking on them (Figure 8b).
Factors Controlling Population Dynamics of Short-Neck Clams
The results of the population study of short-neck clams in this study indicates that it has suffered from a serious mortality factor during the spring and summer, and the first appearance of its negative impact on the population was the selective elimination of the individuals with the shell length of more than 12 mm from the population on 17 May 2018 (Figure 7b), which resulted in the rapid decline of biomass of the population (Figure 6b). During this period, we found many feeding traces marked by the rays on the sediment around the sampling site (Figure 8d). The same situations have been recently reported from various clam harvesting grounds on the tidal flats in western Japan, where the rays including A. flagellum and H. akajei gave a serious damage on the fishery activities [12,43]. Consequently, the dense patches of the clam with 34,170 ind. m-2 and 3,572 gww m-2 established on 1 April 2018 declined to ones with only 300 ind. m-2 and 61.1 gww m-2 by 17 October 2018 (Figure 5a,6a).
Such influence as depressed clam patches, however, did not occur during the warm seasons in 2017. The relatively high-density patches with 1,320 to 4,310 ind. m-2 and 452 to 1,548 gww m-2 were contrastively kept between 27 April and 8 November in 2017 (Figure 5a,6a). In the first half of this period, the clam patches were established in the muddy carpets created by Asian mussels (Figure 4a). It is likely that they provided a space refuge from the predation by the rays for the clam. In the latter half of this period, the muddy carpets were accidentally swept out from the tidal flats due to the strong wind and waves brought from the typhoon (Figure 4b). Therefore, the clam patches were not subject to a mortality factor caused by the development of reduced conditions in the muddy carpets as we had expected as a negative interference brought from Asian mussels to short-neck clams during the summer [15]. Thus, the accidental occurrence of the physical disturbance on the sediment caused by surf conditions may have worked as a key factor for the co-occurrence of Asian mussels and other macro-benthic animals including short-neck clams that favor oxidized sandy sediment.
Effective Measures to Re-establish Dense Patches of Short-Neck Clams
To re-establish dense patches of short-neck clams on the tidal flats is one of the most important issues for the sustainable development of the coastal fisheries in Japan [5]. Since this species originally predominates the macro-benthic communities on the sandy tidal flats across Japanese coast, the recovery of its population indicates to regain various functions for material circulation performed as a suspension-feeding bivalve in the ecosystem on the tidal flats [44]. However, it is apparent that the clam populations are placed under serious threats of mortality factors including predation by ducks, rays, snails etc. and there being enforced interspecific interaction with Asian mussels that have happened in the recent years.
Nevertheless, the members of the fisherman’s Associations have demonstrated by the net bag experiments that the capacity of the secondary clam production is potentially still kept intact on the tidal flats where the dense patches of the clam had disappeared. They put net bags with small pieces of oyster shell or gravels on the tidal flats to induce the settlement of planktonic larvae of the clam on the substrates inside the bags (Figure 9a). In fact, the planktonic larvae settle on the substrates, and can grow normally without any predation as they receive outside the bags (Figure 9b). Although we need to further modify this method to develop as cost-effective way, it gives as a big hint how to re-establish dense patches of short-neck clams on the tidal flats as the 1970s.
Conclusion
Two species of bivalves, Asian mussels (A. senhousia) and short-neck clams (R. philippinarum) predominated the macro-benthic community on Midori River Tidal Flats. In the former species, innumerous planktonic larvae settled on the sediment in the breeding season of early summer, and dense patches were established, creating muddy carpets on the sediment. However, they rapidly declined due to the physical disturbance on the sediment caused by strong wind and waves when a typhoon passed through near the study area, and due to predation by the migratory dabbling ducks during the late autumn and winter. Although the creation of muddy carpets by Asian mussels expected to develop reduced conditions in the muddy carpets during the summer, and to work as a serious mortality factor to short-neck clams, the physical disturbance of the sediment caused by a typhoon swept out the muddy carpets themselves from the tidal flats. The latter species burrowed the sediment and showed a high resistance to the disturbance. However, it seriously suffered from the predation by rays during the spring and summer. Consequently, very poor macro-benthic communities were formed in both of density and biomass on the tidal flats. To recover the clam-harvesting fishery on the tidal flats, short-neck clams need to be protected not only from the development of reduced conditions in the muddy carpets during the summer as expected prior to this study but also predation by the rays.
To Know More About Oceanography & Fisheries Open Access Journal Please click on: https://juniperpublishers.com/ofoaj/index.php
For more Open Access Journals in Juniper Publishers please click on: https://juniperpublishers.com/index.php
0 notes
Text
What Indicators Could be Useful to Understand the Development of Digestive Tract, During the Early Ontogeny of Teleost Fish?

Authored by: Cuenca-Soria C A
Abstract
Nowadays, the most of studies about the digestive physiology and structure changes during the initial ontogeny of cultured fish, have been focused to describe the indicators (associated with those changes), punctual and reclusively. Moreover, there are not enough indicators, when the digestive morphological and functional changes, are described in certain fish in particular. The present review, try to describe and compile the indicators of digestive morpho functional development, attending the feed habits, as well as the kind of ontogeny that undergo the teleost fish, which, it almost not be considered. The review tries to explain, the importance of show possible synergy between biochemistry (enzymology), histological, histochemical, molecular, mainly genomic aspects (among others); towards an integral and reliable description of the morpho functional changes in the digestive tract of fish. In this sense, the present work, try to elucidate a particular case of Mayaheros urophthalmus (a native species from the Southeast of Mexico), where it has described a pool of indicators associated to the morpho functional changes of its digestive tract. The indicators of digestive morpho functional development can be therefore, complementary mutually. Finally, it has compiled and summarized some indicators of digestive morpho functional changes, towards a better knowledge of the digestive physiology, during the initial ontogeny of teleost fish.
Keywords: Ontogeny; Indicators; Development; Morpho functional; Teleosts; Nutrition
Introduction
At present, the optimization of the nutritional quality of live feed in teleost fish larviculture has directed research to the use of live feed with a view to strengthen the larviculture phase, the most critical in fish culture. Despite this leading to unquestionable progress in the culture of freshwater and marine fish, the high cost of establishing infrastructure for secondary cultures has seriously decreased the profitability of aquaculture. The nutritional quality of live feed does not always satisfy the nutritional requirements of larvae during culture. The production of live feed may thus face difficulties such as a variable nutritional quality and supply [1,2]. Since some decades ago, studies have tried to determine the physiological capacity of organisms to hydrolyze the ingredients present in the diet, from the point of view of their enzymatic machinery, and have progressively obtained more encouraging results, though not completely successful. Rosenlund et al. [3] established that inert diets make it possible to introduce nutrients that are not available in live feed, and to determine the capacity of organisms to digest particular ingredients. Such studies, which have revolutionized the point of view about the processes of ingestion, digestion, and assimilation of nutrients of fish farmer, during their early ontogeny.
It has increased the knowledge about the most important morphological events, in the digestive tract that take place, throughout this critical stage, as well as on the functional events (considering laboratory and field records have shown that morphology and function are closely related). The sequence of events that characterizes the most important changes, that take place, throughout the morphological and functional development of the incipient alimentary canal in fish larvae; is a clear indicator of the process that starts with fertilization and embryo development, will finally end in the morphological-structural maturation of the digestive tract, and attached glands, and their proper functioning. Such indicators, which may reflect the capacity of the fish to experiment changes, from larva to juvenile, in a relatively short time; towards a better understand the maturation process of the digestive function. It has been possible to determine the precise instant of the beginning of the change from larva to juvenile and, thus, of a change in feeding regime (from live feed to inert food).
The indicators may also represent tools for the diagnosis of the nutritional condition of cultured fish, as Gisbert et al. [4] stated. The indicators used up to now in studies on the early ontogeny of commercially important fish have been mainly morpho functional, biochemical, histochemical, immunological, and molecular. They are important because they provide a greater number of elements that will progressively make it possible to do without live feed through the design of inert food that agrees with the physiology and digestive capacity of the cultured fish and will result in a significantly more profitable fish farming activity. This review describes the morpho functional changes that take place and analyses the indicators have been already validated, as tools (and potential indicators), in order to determine the degree of development of the digestive morphology and function during the early ontogeny of teleost fish.
Types of Ontogeny and Indicators
Ontogeny is defined as the morphological and functional changes that fishes undergo, during their early biological life. A successful development of the digestive system is essential for the survival and growth of fish larvae as it allows them to capture, ingest, digest, and absorb food [5], as do the adults of their species. Although fish larvae are morphologically capable of capturing food items in their first exogenous feeding [6,7], the digestive system requires a series of structural changes before becoming fully functional [8]. The general sequence of events during the ontogeny of teleost fish, were described by Govoni et al., [9]; who proposed that a primitive intestine is segmented into three regions: the foregut, midgut, and hindgut. The foregut forms the esophagus and stomach, the midgut forms the small and big intestines, and the hindgut forms the rectum and anus. Balon [10] described three types of ontogenies in teleost fish: indirect, transition and direct, and proposed that ontogeny is a hierarchical model of fish life history. Thus, the ontogeny had split, into the sequential periods of embryo, larva, juvenile, adult and mature (senescence) in the case of indirect ontogeny; and embryo, juvenile, adult and mature in the case of direct ontogeny (note the absence of the larval period).
In the case of transition ontogeny, the model proposed the periods of embryo, fry, juvenile, adult and mature. The fry step is a type of larval vestige according to Balon [10]. Each period, divided by natural borders and comprises a sequence of organization intervals in “jumps”. The intervals or “homeoretic” states called steps, separated by stable thresholds. The steps considered the basic units in the ontogenetic scale. Thus, the period is the longest interval and separated from the others by thresholds. The phase is the next interval by which, a stage divided by morphological units of lower ontogenetic significance, mainly for identification purposes. The step is the shortest natural interval, separated by thresholds, and the concept of stage is an instant state in ontogeny. Aspects of the ontogeny types that has been mentioned above, are discussed as follow next.
Indirect Ontogeny
The first period, the embryo, is characterized by endogenous feeding, that is to say, by the acquisition of nutrients from parental sources [11]. The time between hatching and the moment when the eyes have reached the pigmentation, is the time during which larvae feed solely on their yolk reserves [12]. This time of endogenous feeding tends to be very short and followed by a long larval stage (that depends on exogenous feeding), that leaves the larvae vulnerable and prone to a high mortality. Numerous species produce eggs and small larvae with organs and tissues that are immature at the hatching [13]. However, many fish with an indirect ontogeny produce a great number of embryos and larvae to compensate for this vulnerability [14]. The larvae may also occupy many niches (plancton, in the case of teleosts) and thus avoid competing for food. Gisbert et al. [4] stated that fish larvae generally hatch more prematurely than other vertebrates, suggesting that the space-time sequences in teleost larvae are notably different from those of the higher vertebrates.
In consequence, fish larvae go through significant morpho-structural and physiological changes during the first weeks of life, such as has been observed in flounders [15]. Many studies have been carried out, during the last two decades, in order to determinate the digestive capacity and nutritional requirements of fish larvae and juveniles [16]. Organogenesis and the changes in digestive enzyme activity, as well as the characteristics of the development of the digestive tract, have been well documented for several species, including the European seabass Dicentrarchus labrax [17], the sole Paralichthys californicus [18], the red drum Sciaenops ocellatus [19]. Morpho functional, biochemical, and molecular indicators were considered, following the digestive ontogeny in Balon model (2002), as well as the feeding habits of the species and the studies carried out to date for each case.
Carnivorous fish
At hatching, the mouth and the anus are shut, in some species [20,21]. Such characteristics were observed by Gisbert et al., [22], in the sole P. californicus, including a closed and straight tube (nondifferentiated oropharynx and anus). Between days 1 and 2 after hatching (dah), the oropharynx presents morpho histological features such as some layers of squamous cells and a few taste buds. During these days, the intestine is rudimentary and is made of simple ciliated columnar epithelium. While the yolk sac is present, the hindgut presents a 90° curve and an intestinal valve is formed to divide the intestine in two regions, the prevalvular intestine and the postvalvular intestine. Both regions present a basophilic cytoplasm and prominent eosinophilic microvilli [22]. The postvalvular intestine lacks Goblet cells [21], while the gastric glands appear (indicating digestive immaturity).
However, the activity of certain enzymes is required for larval digestion to take place immediately after hatching. Alliot et al. [23] recorded trypsin and chymotrypsin (pancreatic enzymes), using biochemical techniques, immediately after the hatching of D. labrax. García-Gasca et al. [24] detected trypsinogen gene expression in egg rRNA (75 hours after fertilization, haf) in Sphoeroides annulatus. Gisbert et al. [22] detected acidophilic zymogen grains (pancreatic enzyme precursors) in the exocrine pancreas at 1 dah, before the start of exogenous feeding, with an increase in their numbers when exogenous feeding started in P. californicus, and Yanes-Roca et al., [25], confirmed the importance of pancreatic secretions in larval development during the early ontogeny of the black snook Centropomus nigrescens. The prevalvular intestine, has been described as the main site for extracellular digestion in the digestive tract during the larval stage, as result of its alkaline pH and the presence of trypsin secreted by the exocrine pancreas [26,27]
Shortly afterwards, and coinciding with the first exogenous feeding, the alimentary canal changes and forms the oropharynx, esophagus, pre and postvalvular intestines and rectum. Several authors have observed this in other carnivorous species like Paralichthys senegalensis [28] and the yellowtail flounder Limanda ferruginea [29]. A fold formed by ciliated columnar cells starts to differentiate at 4 dahs, in the terminal region of the esophagus, from the prevalvular foregut in P. californicus [22]. The number of Goblet cells increases around 10 dahs. These cells secrete glycoproteins and mucin, the substances that make lubricating mucous membranes in the anterior oropharynx and esophagus, an organ in which no histological changes were observed, until metamorphosis, as occurs in P. californicus. At this age, one may also observe a canine tooth in the posterior region of this cavity, and the mucous membrane in the intestine is mostly rectilinear and presents several short folds. The first Goblet cells become visible in both regions of the intestine. Sphoeroides annulatus presents a marked change in the expression of trypsinogen intensity at 13 dahs [24].
The Goblet cells increase in number with the differentiation of the intestinal mucous membrane and are most abundant in the prevalvular intestine. Histologically, these cells dye a dark blue, which have a relationship, with the presence of a mixture of carboxylate and sulfated glycoproteins and of neutral glycoproteins. Folding in the prevalvular intestine increases between 19 and 23 dah and the folds occupy most of the intestinal lumen, whereas the postvalvular intestine presents few folds in a rectilinear mucous membrane [22]. The migration of the eye in P. californicus (27-30 dah) coincides with the differentiation of the gastric glands and the decline of supranuclear bodies in the postvalvular intestine [22], indicating the presence of pinocytic absorption and proteolytic digestion in the intracellular environment, that take place through a five-step process: pinocytosis, transport, accumulation, digestion, and extinction [30]. Larval digestion in fish with an indirect ontogeny is intracellular [9] and becomes extracellular when the transformation takes place.
The intracellular digestion compensates the incomplete digestion that occurs in the primitive midgut, which decreases its contribution to digestion as the alimentary canal matures, especially when a functional stomach appears, which may be the most important indicator of digestive maturation in carnivorous fish. It has been widely documented that a morpho functional indicator of the full maturity of the stomach is the presence of gastric glands in the fundal stomach, whereas a significant enzymatic indicator of stomach maturity is a high level of pepsin which, is secreted by the gastric glands. The occurrence of these three changes is an indicator of the threshold of a digestive tract in an advanced state of maturity. Govoni et al. [9] stated that the presence of vacuoles and supranuclear inclusions is an indicator of a functional alimentary canal. García-Gasca et al. [24] recorded a marked decrease in the levels of mRNA that codes for mRNA trypsinogen, starting at 28 dah in S. annulatus, which coincided with the change in diet from Artemia nauplii to a formulated micro diet. Darias et al. [31] detected a relatively constant trypsinogen expression during the first month of life of Pagrus pagrus that decreased towards the 50 dah, suggesting that trypsinogen plays a secondary role in protein digestion.
The same synchronic behaviour (a decrease in trypsin activity as an indicator of stomach differentiation) was recorded for the striped beakfish Oplegnathus fasciatus [32], although the decrease in trypsin activity was more premature (starting at a peak at 19 dah). However, the most notable change in the stomach, and the start of the juvenile stage as well, is the development of the gastric glands, as Pradhan et al. [33] pointed out. These changes may thus be useful indicators to pinpoint the process of digestive maturation.
Omnivorous fish
Few studies have been carried out on the ontogenetic dynamics of omnivorous fish. In their study on the development of digestive enzymes during the early ontogeny of Mayaheros urophthalmus, López-Ramírez et al. [34] recorded trypsin and chymotrypsin activity before hatching. This was also recorded for the rohu carp Labeo rohita, in which there is amylase, protease, lipase and alkaline phosphatase enzymatic activity at 4 dah [35]. Important digestive enzymes have been documented as present at the moment when the mouth opens [36,37]. The opening of the mouth and, thus, the beginning of exogenous feeding determine the regional differentiation of the intestine in many teleost species [38-40]. Continuing with M. urophthalmus, its larvae present a marked activity of several digestive enzymes at 13 dah, as is also the case in species like P. californicus [41].
The biochemical characterization of M. urophthalmus larvae indicates that precisely at 13 dah is the best moment to substitute live feed with artificial food, and this coincides with a visible increase in the activity of enzymes such as trypsin, chymotrypsin, aminopeptidase, carboxypeptidase, and the acid and alkaline phosphatases [34]. Aminopeptidase and alkaline phosphatase are intestinal enzymes that play a part in the digestion of small peptides and the assimilation of nutrients, respectively [42]. Their sustained increase throughout early ontogeny indicates an improvement in the intestinal digestion capacity [43]. Trypsin has been reported as the enzyme that is most responsible for alkaline proteolysis in Paralabrax maculofasciatus larvae [44], whereas in M. urophthalmus, proteolytic activity is represented by chymotrypsin. This explains why chymotrypsin has been identified as part of the enzymatic machinery of omnivorous and herbivorous fish, while trypsin has been recorded for carnivorous fish [45].
These same authors recorded the presence of trypsin, chymotrypsin, aminopeptidase and catepsin (an indicator of intracellular proteolysis and, thus, of a primitive or immature alimentary canal) before hatching (0 dah) and at 3 dahs, respectively. In the larvae of another omnivorous fish, Pagellus erythrinus (with a certain tendency towards carnivory, like M. urophthalmus), the differentiation of the digestive tract produces an oropharynx, an esophagus, a presumptive stomach and an intestine at 3 dah [46,47], morpho functional indicators that coincide with the first exogenous feeding. From these findings it follows that there is a certain functional capacity in the digestive tract at this age. The indicators that change at the beginning of exogenous feeding in omnivorous fish are an increase in trypsin activity and the start of chymotrypsin activity as an indicator of a possible beginning of mixed feeding (a mixture of endogenous and exogenous food items).
Enzymatic activity may thus be a true indicator of the digestive capacity of omnivorous fish like the common carp Cyprinus carpio Jian variety, as Yan and Qiu-Zhou [48] stated. Despite most of the studies on the early ontogeny of fish having focused on carnivorous species of the Mediterranean Sea and the Northern Atlantic, it is possible to summarize the relevant changes that may be used as indicators of the degree of maturation of a fish, on the ontogenetic scale. Yan and Qiu-Zhou [48] stated that the digestive function is correlated with the development of the intestine in fish without a stomach, such as C. carpio Jian variety. Micale et al. [46] reported on important indicators (time of mouth opening, absorption of yolk sac and formation of gastric glands, among others) for P. erythrinus larvae. Moreover, Cuenca et al., [47], revealed a relationship between the full differentiation of the stomach (histology), peaks of expression of α-amylase (molecular indicator) and peaks of acid proteases (biochemical indicator), in M. urophthalmus, at 13 dde; as synchronous events of maturation of the digestive tract.
Herbivorous fish
Hatching of herbivorous cyprinids like Ctenopharyngodon idellus produces incomplete organisms in which the differentiation of the organs, particularly of the digestive tract [9,49], continues during the post-embryonic stage [50]. Also, when growth rates are as much as 30% d-1 [51], the digestion presents an extremely pronounced enzymatic activity. Exogenous feeding starts even before the absorption of the yolk sac, and the alimentary canal is short and straight during this stage [52] and may measure 50% of the body length [50]. The short larval intestine is capable of breaking down and assimilating easily digestible elements, mainly zooplancton [53]. The intestine grows slowly during the larval stage and the time of intestinal passage is positively correlated with the relative length of the intestine [54].
The time available for the processes of digestion and absorption increases gradually, until the fish changes into an adult [52]. Thus, both the time of passage and the length of the intestine may be considered indicators of digestive maturity in cyprinids, particularly the herbivores. On another note, digestive enzyme activity is low during the first feeding stage and increases during larval development [38]. Also, the digestive enzymes in natural zooplanktonic prey survive in the digestive tract of the predators and minimally increase the enzymatic activity in the hosts [52]. Regarding trypsin activity in adults, it is significant in the foregut and midgut, though not in the hindgut where enzyme activity practically disappears [55]. In larvae, however, hydrolysis continues in the hindgut [52]. Guo-Liang et al. [56] studied the gene expression of trypsinogen and the specific activity of trypsin throughout the ontogeny of C. idellus and suggested that trypsin activity is important in larvae.
The decrease in the activity of this end protease enzyme in the hindgut throughout early ontogeny may be a good indicator of digestive development, at least for the larval stage. C. idellus does not have a stomach, which means that the whole digestive process takes place all along the intestine (mainly the foregut and midgut), which is designed to optimize the digestion and assimilation of nutrients. In agreement with this, the intestinal enzymatic machinery of C. idellus, which includes proteases, lipases, cellulases and amylases, has been analysed by Wu and Zhu [57]. Horn et al. [58] detected a marked amylase and maltase activity in Atherinops affinis (an estuarine herbivorous fish), enzymes that degrade the alpha polysaccharides present in the diet. In turn, adult herbivorous fish owe their high digestive efficiency to the great intestinal surface that is provided by a very long intestine and is available for assimilation and digestive processes.
In relation to this, Horn et al. [58] concluded that the intestine is longer and has a greater intestinal surface in A. affinis than in Atherinopsis californiensis and Leuresthes tenuis, an omnivore, and a carnivore, respectively. However, fish with no stomach and no mechanism of stomach digestion require intracellular digestion, which commonly occurs during the early ontogeny of teleost fish (until the formation of the gastric glands, indicators of the developed differentiation of a functional stomach). Liu et al. [59] detected the presence of catepsin D that plays a part in the digestion of proteins in C. idellus, an enzyme indicator of intracellular digestion like leucine alanine peptidase [27].
Transition Ontogeny
The yolk in fish with a transition ontogeny is abundant and dense during the embryo stage, providing ideal conditions for a rapid change to the juvenile stage (at least compared with fish that have an indirect ontogeny and a longer larval stage). The most representative species of this group are the fish of the Salmonidae family, which, produce big demersal eggs and well-developed fry [60]. Six hours after fertilization, salmonid eggs have small blastodiscs, narrow perivitelline spaces, and lipid globules located around the animal pole and connected to the citoplasmatic region, while the embryo and the oil droplet are located in the upper part of the yolk [60]. Dahl et al. [61] described a comparative study of the morphological characteristics of the progeny of O. mykiss obtained from the wild, from culture, and from hybrids obtained from breeding animals of both groups, in which they observed minimum differences with respect to growth.
Regarding the ontogenetic study of salmonids, Godorilov [62] described the early ontogeny of the Atlantic salmon Salmo salar, established a mathematical model to identify the stages of embryogenesis considering as the minimum unit the formation of a pair of somites, and suggested the model could be applied to other species. One of the most emblematic indicators in fish of this group is the presence of pepsin and trypsin during the hatching of O. mykiss [63]. Pavlov and Moksness [60] compared the early ontogeny of S. salar and Anarhichas lupus (a fish of direct ontogeny) and found greater technological advantages in the culture of A. lupus than in that of S. salar, considering the more complex life cycle of this last species. Rungruangsak-Torrissen et al. [64] studied the different expressions of trypsin and chymotrypsin and their effect on the growth of S. salar, and found that the first decreases in activity when growth is favoured by external (fasting, temperature and diet composition) and internal (life stage) factors, while the second increases in activity under conditions that limit growth (fasting). Thus, enzymatic activity, at least in the salmonid group, is an indicator of the way in which the internal and external factors in fish culture act and interact.
Furthermore, histological, and histochemical techniques have shown an accumulation of protein inclusion bodies, in the epithelial cells of the midgut of salmonid larvae which, results in the intracellular digestion. This event is less important in fish with a direct transition ontogeny, as they already have a functional stomach (before the absorption of the yolk sac and at the first exogenous feeding), similar to those of adult fish [9]. Thus, fry (a stage exclusive of fish with a transition ontogeny) present most of the characteristics of juveniles shortly after hatching (as they hatch also as eleuthero embryos), which makes them very developed larval vestiges. In this sense, Sarieyyüpoğlu et al. [65] recorded the start of the formation of the stomach from the mucous membrane of the esophagus in the freshwater trout O. mykiss at 2 dah. This offers advantages to fry as, at this stage in the ontogenetic scale, they present a structurally and functionally more advanced digestive tract at the time of hatching, compared with fish with an indirect ontogeny.
Direct Ontogeny
Studies on morpho functional changes in fish with a direct ontogeny are few (particularly in the case of species that are cultured). The embryonic development of this group follows the general pattern of teleost fish, though with marked differences. An internal fertilization has been showed in the Atlantic wolffish Anarhichas lupus [66]. Some species like Xenomelaniris brasiliensis (a brackish atherinid fish with an embryonic stage that lasts approximately 143 h, the moment when hatching takes place) have well pigmented eyes and the first outlines of pectoral fins even before hatching [67], these being typical indicators of fish with a direct ontogeny. On the other hand, most marine fish larvae do not have the capacity to feed immediately after hatching and depend on the yolk sac (not dense) until their eyes and mouth become functional. In contrast, at the hatching, A. lupus is an eleuthero embryo with characteristics of a premature juvenile that allow it to adapt immediately to the pelagic environment [60]. At the start of the first exogenous feeding, A lupus has a developed morphology, especially regarding the digestive system [60], that provides it with a greater probability of survival and a reduced vulnerability during early ontogeny. Hellberg and Bjerkås [68], suggested that an increase in the amount of lipids in A. lupus was associated with the maturation of epithelium cells in the intestine. Thus, the capacity to absorb lipids in the intestine of fish with a direct ontogeny may constitute a clear indicator of intestinal differentiation during ontogeny, especially during the larval stage.
Morpho functional Indicators of Maturation
According to Ma et al. [69], there are two stages of capital importance in the process of maturation of the digestive function in fish larvae: first the functionality of pancreatic secretions and second the formation of the epithelium with the brush border membranes of the intestine. These events have described in D. labrax [70], Solea senegalensis [18] and S. ocellatus [19,71]. Notwithstanding these changes are complete in most species, physiological changes take place from the moment of the first exogenous feeding until the transformation into juveniles. Such changes include the reorganization of the muscular trunk, the differentiation of the gills, and of bone tissue; as well as the development of a functional stomach and the establishment of acid digestion [6,13,18,40,72-74].
These last changes indicate that the individual is in a condition of digestive maturation that allows it to carry out the ingestion, digestion, and assimilation of nutrients efficiently. Gisbert et al. [4] pointed out that histological indicators are a useful and precise tool that helps understand the transcendental changes that take place during the early ontogeny of teleost fish, even considering their limitations in the study of wild populations. The profile of the digestive enzymes is also an indicator of the digestibility and use of nutrients [35]. For example, it has revealed that pepsin, trypsin, and amylase activity is high in omnivore and herbivore larvae. In contrast, carnivore larvae have a high activity of pepsin, trypsin, chymotrypsin and aminopeptidase, and a very low activity of amylase, with a few exceptions like O. mykiss. The presence or absence of amylase activity is a useful indicator of the feeding habits of a species, but also of digestive maturation, as activity is high in the early larval stages of several species and decreases when morpho functional maturity is established [75]. A high amylase activity in larvae could be associated with the activity of lactase in the postnatal stages of mammals, which decreases when digestion becomes similar to that of the adults of the species.
Another important indicator of structural and functional changes during the development stages of many species is the relationship between extracellular digestion represented by enzymes of the brush border (aminopeptidase N, alkaline phosphatase, and maltase) and intracellular digestion measured by cytosolic enzymes (leucine alanine peptidase). While cytosolic activity predominates during the first days after hatching, it decreases at the same time that the enzymes of the brush border increase in activity, together with the development and establishment of the intestinal mucous membrane. According to a functional point of view, digestive activity depends on several factors, among which the hormones stand out. An important indicator is cholecystokinin (CCK), a hormone produced in the foregut and is responsible for pancreatic enzymatic secretion, the secretion of bile, and the contraction, filling and emptying of the intestine [76]. Despite there being few studies on this aspect, CCK has been detected at 1 dah in the Japanese sole Paralichthys olivaceus [77], the bluefin tuna Thunnus thynnus [78] and the sweet fish Plecoglossus altivelis [79]. However, no CCK has been detected in the intestinal tract of the Atlantic sole Hippoglossus hippoglossus [80,81], indicating that the presence of this hormone may depend on changes in the levels of expression determined by genetic and/or nutritional factors.
Molecular Indicators of Fish Maturation
Functional genomics studies were initiated in model species, and then in those marine and freshwater which, economic importance with de goal to understand the ontogenetic changes occurring in first stages of development in order to improve the feeding schemes in these critical days. Fish physiology studies include the zebrafish Danio rerio [82], medaka Orzias latipes [83], pufferfish Fugu rubripes [84], channel catfish Ictalurus punctatus [85], Atlantic salmon Salmo salar [86], turbot S. maximus [87], European seabass D. labrax [88], between others. These studies summarize the dramatic changes, which, fish undergoes along the first days of development until reaching a definitive phenotype.
The ontogenetic changes are represented by morphological modifications, including cell differentiation and proliferation, growth, and functional maturation until reaching juvenile or adult way of life. Those process, require a high degradation degree at every modification step, which, are genetically programmed. One of main external factors influencing gene regulation is the maturation, is the nutrition, which, play a determinant role, during the first steps phases of grown and development in fish larvae [89]. In this sense, it has been the relationship between the expression of CCK, neuropeptide Y (NPY) and grown hormone (GH) versus the nutrition regime (mainly live prey) in cod larvae G morhua [90]. The former author found that the transcription of level of CCK, as well as the digestive enzymes trypsin and amylase were transcribed, according to the feeding composition, suggesting the use of these indicators of nutrition in the early phase of fish development.
More recently, the functional modifications associated to the GI-tract organogenesis were described during the methamorphosis of Atlantic halibut (Hippoglossus hippoglossus) since an anatomical, biochemical, and molecular perspectives [91]. It was observed that the multiple functions of the teleost stomach develop synchronously during methamorphosis, and it was established a correlation between the transcript abundance of ghrelin and the stomach development, as well as the establishment of the proteolytic activity. In recent years, the majority of fish ontogeny related-studies were carried out by using a small number of target genes by semi-quantitative or qPCR, and/or some studies by in situ hybridization (FISH). Subtractive hybridization and construction of cDNA libraries (SSH), where also utilized to elucidate gene that are differentially expressed and allows the comparison of two DNA population of a fraction enriched in differential distributed molecules, involved in the regulation of ontogeny and related processes. cDNA libraries construction permitted the analysis of thousands of genes or whole genome by microarrays , and to know the mechanisms related to the morphologic, structural, and functional changes in fish larvae, describing the metabolic pathways and gene individual interaction involved in the metabolism, grown, differentiation, digestion, transport, absorption, among other biological process.
The study of Sarrapoulou et al., [92] permits the insight into the molecular basis of development and stress, in aquaculture species by mean of creation of gene expression profiles for sea bream by microarray hybridization and contributes to a better understanding of the genetic background of fish physiology, which, may help to improve aquaculture practices. Functional genomics studies are also possible by the use of microarrays generated in non-model species, such as that performed by Darias et al., [88], where they used cross-species hybridization among fish of different taxonomic families. They used more than 9000 cDNA trout O. mykiis, clones originated from two pooled-tissues libraries [93] to elucidate the changes in gene expression, occurring over sea bass D. labrax larval development. They observed an overexpression of 485 genes related to organogenesis, 29 to the energetics pathways, 67 to the biosynthesis and 5 to digestion. Through this transcriptomic analysis and its validation by qPCR, has been identified several molecular markers which, indicate GI-tract maturation.
During the past several years, the information concerning fish transcriptomic are increasing because the establishment of high-through put sequencing technologies, termed next-generation sequencing (NGS) technologies which, have been exploited to analyze the dynamic transcriptome, and the resulting technology is termed RNA sequencing (RNA-seq), Qian et al., [94]. As consequence of low cost and rapid development of these technologies, the transcriptomes have been studied, in both model and non-model fish, not only for the quantification of change of in expression level, but also mapping and annotating the transcriptome with the aim to understand the biological process, such as development, adaptive evolution, host immune response, and stress response. Thus, in order to summarize, the table 1 shows some relevant indicators, that accompany the main changes of the morpho functional development in teleost fish, principally of cultured species.
Discussion
Knowledge of the ontogenetic dynamics in teleost fish is fundamental in order to select indicators for the important events that take place in the process of digestive maturation, which may establish a reference for the design of inert food, particularly for the early life stages of commercially important species and of those with a potential for culture. It is necessary to understand the morpho functional changes, as very few studies to date have focused on relating the indicators considered in the present review to the morpho functional development of fish. Even more, little it has been done, to establish the possible synergies among the indicators that have been mentioned, which may describe more fully the relevant and particular changes that take place during the early ontogeny of teleost fish. The prevalence of one type of enzyme in the enzymatic machinery of a fish, may be a prominent indicator of digestive maturation, and thus of the composition of the feed to be provided, and of the approximate times, throughout the early ontogeny of the species under study.
Histological, biochemical, and molecular tools are widely used at present, being extremely useful and allowing a deeper and more precise knowledge of the times at which the relevant events occur throughout the early ontogeny of teleost fish. Samples taken throughout the ontogenetic series may record such changes through the determination of morphological and structural changes, enzymatic activity dynamics, the detection of the genes responsible for the molecular expression of digestive enzymes in time and, in this way, complete the information generated by other techniques. Recording the more or less exact times of enzymatic expression may turn out to be an indicator of important events throughout the histogenesis and organogenesis of the alimentary canal. Despite the high relevance of the biochemical and molecular indicators, it is necessary to first consider the structure (inherent to the morphological indicators), and then the functional aspects of fish development.
Actually, there is not enough information about the role, of abiotic and biotic factors, on the enzymatic mechanisms in teleost fish. Temperature could play a crucial role on the intestinal tract hydrogen strength (pH), of freshwater fish [95]. Furthermore, it has been studied the pH and its effect, on the activity enzymatic in teleost fish, mainly their optimal values, that differ depending on different group of digestive enzymes [96]. Moreover, the knowledge about the role of abiotic and abiotic factors, during the development of digestive tract, in the early ontogeny fish is poor. Finally, it is important to consider more biochemical, genetic, immunological, endocrinological and hematological events (among others), involving complementary disciplines like functional genomics, in order to obtain a greater number of indicators that may lead to a greater understanding of the process of digestive maturation in teleost fish, particularly of commercially valuable species and those with a potential for culture.
Finally, it is necessary to notice that not only is important to have in mind a list of molecular markers or those events involved in organogenesis to describe the changes that occur in initial ontogeny, but also the correlation with those external factors responsible for the phenotype. One of these external factors is the nutrition, because is determinant in enzyme and hormone regulation related to fundamental changes to obtain high quality juveniles. Studies on the digestive larval physiology are of the capital importance, to know their enzymatic adaptations to dietary changes [95]. The combination of physiological studies and the ecological knowledge on teleost fish, could contribute to promote the growth and survival during the larvae fish period [97].
According to the indicators of the morpho functional development above described, it has been analyzed a particular case of M. urophthalmus, a native fish from Southeast of Mexico, which is an excellent candidate for freshwater aquaculture [98]. Finally, it is recommendable, to use at least three tools of study, to interpret different kind of indicators of digestive morpho functional development, simultaneously. In this sense, several indicators could be complementary on the study of biological process, as the morpho functional development, of the digestive tract in teleost fishes.
To Know More About Oceanography & Fisheries Open Access Journal Please click on: https://juniperpublishers.com/ofoaj/index.php
For more Open Access Journals in Juniper Publishers please click on: https://juniperpublishers.com/index.php
0 notes
Text
Environmental Perception of Recreational Fishers in Urban Beaches

Authored by: Jacqueline S Silva-Cavalcanti
Abstract
Recreational fishers depend on the good quality of those environments. The assessment of the environmental perception of social actors who show a sense of belonging to the landscape can better describe the impacts on the environment. This study aimed to assess the recreational fishers’ perception of the environmental quality in four urban beaches. 170 recreational fishers agreed to participate in the research. They were required to respond to questions about their fishing strategies and their perception of the environmental quality of the beaches and the possible impacts on the fishing activity. Based on the responses presented, a description of both local fishing activities made, as well as an analysis of the perception of the beaches’ environmental quality for fishers. On average, the recreational fisher ones have been working for 16.2 years. Pollution considered be the cause of diversity loss and local fauna’s biomass loss by 70% of recreational fishers. The second main cause of those losses was the alterations on the natural landscape, reported by 50% of the recreational fisher ones. A PCA showed that to the recreational fishers the biodiversity and biomass loss related to the pollution over time (55.15%). Although the quality of the beaches is not satisfying to any of the fishers, they continue to attend and fish in those beaches.
Keywords: Environmental valuation; Urban fishing; Recreational fishing
Introduction
In urban beaches can find fishing activities its main purpose is recreation, where the fisher may release the animal caught while it is still alive (“catch-release”), or even kill it and keep it for various reasons (e.g., serving as bait for fishing or own consumption) [1]. In these fisheries, the commercial relationships concerning the volume caught are nonexistent [2,3]. The recreational fishing has been developing much in the last decades. Studies shows that in some regions (e.g., EU, USA, India) recreational fishing has become as much or more important than commercial fishing [4,5].
The recreational fishing still is hard to monitor due mostly to the mobility of its practitioners and the different strategies adopted, but some researchers are interested on recreational fisher monitoring owing to the impacts of recreational catch on the marine biodiversity [6-11]. However, despite the negative impacts on biodiversity, recreational fishing plays an important social-ecological role in favor of biodiversity conservation for it is a way of raising ecological awareness and respect for nature in people who do not economically depend on these resources and the coastal environment [12].
The knowledge and the environmental perception of fishers are very important to analysis about the environmental quality of the coastal ecosystems [13,14]. Their dependence on the environment makes them more likely to realize changes in the marine ecosystem, so, they environmental perception can be very useful to make management strategies [15,16]. This is fundamental for the success of the management because relates on the users’ involvement with the ecosystem managed [17,18].
In this sense, the environmental management strategies for urban coastal zones can defined by assessing the perception of the actors involved with the natural environment in use. For that, it is necessary to understand the social processes, attitudes, and perceptions of the environmental quality by the fishers [19-21]. Therefore, studies aimed at the assessment of the environmental quality, based on the fishers’ perception, related to the necessity or success of environmental and fishing management measures, are getting more and more attention [19,22,23].
Based on the factors presented above we evaluated the hypothesis that the biodiversity loss on urban beach reefs is related to human impacts in the ecosystem and rising pollution. To conduct the research, we based on the environmental perception of recreational fishers about the environmental quality of urban beaches where this group often frequents, highlighting the effects temporary changes and their influence on the loss of fish fauna biodiversity on this beach.
Materials and Methods
Study area
This research performed on someone urban beaches of Pernambuco: Boa Viagem, Piedade, Candeias and Barra de Jangada. Those beaches are 16 km a long in the largest cities in the state of Pernambuco: Recife and Jaboatão dos Guararapes (Figure 1). Together are characterized by a high concentration of population and intense use over the whole year (e.g., leisure, commerce, fishing) [24-28]. Those beaches characterized by the presence of reefs near to the coastline that forming tides pools and they have provided a nice environment to different types of fishers [29]. Those reefs act as a natural protection for the coastline on these beaches, which very affected by coastal erosion, dissipating the waves’ energy, and represent one of the great marine biodiversity hotspots in Northeast Brazil [30-32].
Data collection
We used a semi-structured questionnaire to interview the fishers on the beaches. Each questionnaire had 26 questions about the social profile, resource dependence level, diversity of beaches, fisher gears, habits and environmental pollution perception caused by the wrong disposal of solid waste and sewage. A minimum sample number of 455 questionnaires was estimated by the finite difference method [33] based on the population of recreational fishers at those beaches. The fishers were randomly select on the beaches and asked if they agreed to ask this interview.
Data Analysis
The data collected was analysis according to the social profiles and the fishing type described, and the environmental perception of each fisher interviewed. The social profile described according to the age, how many times they are in the fishing activity, and schooling. The fishers were divided according to fishing locations (beach or far from the coast), gears and target species. The fishers’ environmental quality perception assessed by a Principal Component Analysis (PCA) [34]. Proportions equal or higher than 70% were accept. The results plotted as a two-dimensional plot the formation of groups regarding the Euclidean distance of the variables could observed. We also analyzed the catch yield and the catch per unit effort (CPUE) for the dry and rainy seasons. The catch yield for each season was analysis according his significantly (p<0.05). The CPUE was estimate according to the formula U=C/f where C = total catch expressed in kilograms and f = the number of reported fishing in each year [35].
Results
We interviewed 170 recreational fishers from October 2016 to May 2017. The questionnaire structured in three sections: (i) socioeconomic profile, (ii) catch yield and (iii) environmental perception. The interviews conducted according to the laws that regulate human subject research in Brazil (Process No. 62425716.0.0000.5207).
Profile of Interviewees and the Activity in Urban Beaches
The socioeconomic profile of the activity described (Table 1). Women were a minority in the sample. The average age was 45.7 years (SD = 13.3) for men and 39 years (DP=1) for women. The most frequent interval was sample were 40 to 59 years old, which was the most frequent interval for both groups. The older recreational fisher was 81 years and younger was 17. On average, the time of engagement in fishing varied form the first day to 70 years. The interval from one to 20 years was more frequent, corresponding to 69.2% of time of engagement in fishing for the recreational fishers.
*Higher values found for each by fisher group
Concerning the educational stage, the recreational fishers, and 34.9% claimed that they graduated from high school; followed by 20.6% that did not graduate from middle school, from which 97.2% are male fishers and 2.8% female fishers; and 13.7% have a Higher Education degree. About 4.6% of the recreational fishers did not answer their educational stage. All female recreational fishers claimed that they did not graduated from middle school. Beach fishing was most common among the recreational fishers interviewed. 2.3% of recreational fishers did not answer where they usually fish. Among the fishing gears used, fishing pole (82.2%), hand line (6.5%) and others (e.g., landing net, manual suction gun, gaff) (4.9%) were the most mentioned gears.
Catch Yield
The yield (in kilograms) by the recreational fisheries described below (Table 2). The number of recreational fisheries was significantly higher (p <0.05) in the dry season than in the rainy season (p<0.05). The volume captured by recreational fishing in the dry season was also higher than in the rainy season (p <0.05).
Environmental Quality Perception
61% by recreational fishers think the beaches became more pollute over the last two decades, 25% did not notice any changes over the last 20 years, 2.3% claimed that they think the beaches are less polluted and 11.7% did not answer that question. Around 78.5% of the recreational fishers believe that pollution is responsible for the loss of diversity and biomass of marine fish and crustacean species in the beaches studied. For 73.2% of these fishers claimed that recreational activities (e.g., bathing, sports activities in the foreshore zone, etc.) do not have an impact on fishing. More than a half of the recreational fishers (52.3%) claimed that the urbanization process of the beaches has not affected fishing.
To the fishers who did notice some influence of the urbanization of the beaches on fishing, the enlargement of Piedade and Candeias beaches mentioned by 43.5% of the recreational fishers as the cause of impact. The second most mentioned cause was pollution, which corresponds to 25% of the responses. The trash catches during fishing mentioned by 86.6% of the recreational fishers. Plastic items were the most caught: 80.5% of the cases for the recreational fishers. Plastic bags were the most mentioned item (71.1%).
The Principal Component Analysis showed that for the recreational fishers three sets found for four explainable variances (Figure 2). For that group, biodiversity and biomass loss is associated with the pollution of the beaches over time whereas recreational practices are associated with the urbanization of the beaches and adjacent areas. The catch of waste materials suggested being associated with none of the variances. Those results are explainable for (PC1 + PC2) 55.15% of the accumulated variance (Table 3,4); therefore, they are not representative to explain the environmental perception of the recreational fishers surveyed [34].
Discussion
Interviews through questionnaires showed an excellent method for data collecting to environmental perception and environmental belonging [36]. This approach model has become frequent in similar studies nowadays, like in the articles by Silvano & Begossi [37], Santos et al. [38], Tonin & Lucaronni [20], Rodella & Corbau [39], Silvano & Hallwas [14], etc.
Recreational Urban Fisher’s Profile
In urban coastal the recreational fishers usually outnumber the commercial fishers or may even be the only fishers found in those places [40]. The knowledge of the fishing strategies and fishing spots chosen by these fishers can contribute substantially to an effective monitoring of the impacts of fishing on local biodiversity, but despite its importance, it is still little studied. This paper can contribute to the knowledge of the fishing strategies of recreational urban fisher, identifying what most of these fishers prefer to fish in the beach or under the reefs, those that fished far from the beach, the displacement had been made with small boats (e.g., boats, rafts) owned or rented.
We could also note that some recreational fishers who own rafts usually leave them on the beach sand near professional fishing vessels, and that a same recreational fisher could own more than one raft. A small percentage of women found fishing in the course of this study, and this is due to the predominance of men in fishing activities [41,42]. The engagement of women is better described small-scale commercial fishing than recreational fishing, and it is considered quite heterogenic, in which the catch of crustaceans and mollusks stand out (“marisqueiras”), which is usually performed in mangrove swamps, and also in indirect activities such as profiting and commerce [43,44].
We could observe that those women were not so strongly engaged in fishing, even if for recreation, as men were. To those women recreational fishing was more attractive as a way of being around their family in these recreational practices than an activity they would spontaneously engage in. To Diamond et al [45], women have a more restrict knowledge of biodiversity and hence perception of the environmental quality than men. According to the author, this is because women deal more indirectly with natural resources. That trend could observe in this research. To women recreational fishers, fishing was a way to be around or follow their husbands, so their perception minimally related to the information their partners would comment about species and environmental conditions.
Environmental Perception
Landscape changes
The landscape alterations from the last decades in areas near the beaches studied were one of the main reasons for the negative perception by the recreational fishers. In big cities’ coastal areas, like Recife and Jaboatão dos Guararapes, changes near and in the shore, zones are quite usual and cause evident effects on the marine environment, such as changes in the structure of algae, fish and crustaceans’ communities [46-48]. To the recreational fishers in this study, the enlargement performed in the shore zones of Candeias and Piedade beaches was the landscape alteration that caused the worst discontent due to its negative impacts on the local marine biodiversity.
The enlargement of shore zones is usual practice in urban beaches performed mainly to mitigate the effects of coastal erosion caused by the rising of the sea level and by the disorganized population growth in areas adjacent to the beaches with a tendency to construct building closer and closer to the coast [48,49]. The enlargement by Piedade and Candeias beaches went make in 2013 to restore the sand zone destroyed by the erosive processes caused by the civil construction very close to the high tide limits [50]. However, the fishers approached said that the enlargement of the beach resulted to siltation and sand covering of the fish zones in each beach and also in Boa Viagem and Barra de Jangada beaches, as an outcome of the waves and marine tides being carried out [51,52].
Due to the covering some biodiversity hotspots have been destroyed making then common species like the Tainha (Mugil sp.) move to zones farther from the coast or have had their populations decreased like the Corrupto (C. major), resulted to a decrease in the fishing income in those beaches. Furthermore, the enlargement of Piedade and Candeias beaches made them more attractive to recreational users, which led to an increase the amount of solid waste materials left on shore and oceanic zones making the beaches more polluted.
Pollution
Pollution was another negative impact often reported by the recreational fishers during the interviews. Although questions about pollution was make: (I) if it was responsible for the biodiversity loss and (II) how the current pollution level of the beach are compared to when one had started fishing. Pollution also mentioned as an outcome of the urbanization. No association between the three answers reported. That is if to a recreational fisher who believed pollution are responsible for the biomass and biodiversity loss in the beaches, pollution cannot relate to the urbanization. Association between answers could expected.
However, it should be highlighted that pollution on the beaches is evident, but an interviewed fisher might start fishing at that place when it was already polluted, as well as they might believe the pollution found was not so harmful to cause biomass and biodiversity loss of the existing species there. Pollution is the outcome of human activities that hardest affects the marine environmental quality mostly in urban marine areas and is one of the main adversities to the well-being of beach users [53]. The pollution result is biomass and biodiversity loss [54], and therefore, these areas need management measures to fight pollution and its effects to the coastal environment.
Another factor that reflects on the high pollution of those beaches is the frequent catch of solid waste (mainly plastic bags) by the recreational fishers interviewed. Plastic items were as the main components of the solid waste in the sea and already been listed as the main items found in the foreshore zone of Boa Viagem beach [28, 53-55]. Although there is no case study with deeper details on the issue, plastic bags are also very common in recreational fishing in Piedade, Candeias and Barra de Jangada beaches.
The main sources of plastic waste materials in the marine environment are the rivers which transport waste materials thrown along its stream in the continent [38], but many authors indicate fishing activities as a significant source of marine plastic pollution [56-60]. Nevertheless, the fishers answered showed didn’t leave plastic waste on this beach suggested a major part of the plastics found on this beaches might relate to the city surface runoff and to improper discard of waste materials by other beach users, summer migrants, and commerce, rather than to fishing waste left in the ocean [61].
Furthermore, many fishers said they collaborate with the adequate removal and discard of plastic items found on the beaches and in the ocean or when accidentally caught during fishing, in order to better the landscape look and clean aspect and minimize the damaging effects of those items to the environment. Plastic represents an overwhelming threat to marine biodiversity because they are extremely easy to eat or stuck in the animals’ bodies [62-66]. For the fishes, especially small-sized species or reef fishes, the highest possibility with a direct impact concerning plastics is ingestion [67-68].
In this research, no case of fishes caught with plastic items attached to their bodies or inside their stomach been mentioned; however, it known by the fishers approached in this research that attachment or ingestion cases exist and that this is responsible for the death of many individuals. Plastic bags, which were the items most, mentioned as caught by the fishers approached, are among the marine plastics that are most harmful to fishes [69,70]. It is estimated that, from the marine species which are most threatened by the accumulation of plastics in the coastal and oceanic zones, 10% are mentioned in the IUCN’s red list of endangered species, such as Caranha and the Sirigado, mentioned in this study and which are listed as vulnerable in the red list [71,72].
Although for most species mentioned in this study the ingestion of plastic bags may be impossible due to the bags’ size being almost proportional to the species described. Overtime these plastic bags shatter into smaller pieces as an outcome of physical and chemical processes getting to smaller sizes, which can be, eat [73,74]. Besides the negative impacts on the marine biota the accumulation of solid waste materials along the coastal zones causes negative aesthetical impacts and may even result in lack of exploratory and recreational interest in that area [70,75,76]. The beaches studied for this research, despite the biological and aesthetical impacts caused by the accumulation of solid waste materials, are still quite attended [77,78].
The intense use of these beaches does not characterize lack of comprehension on the advanced stage of pollution at which they are. However, this intense use can be justified by its morphological characteristics, which grant them some great fame around its natural beauty and by its easy access due to the urban location of these beaches. This set of factors make those beaches very attractive for practicing many activities, among which we point out fishing.
Recreational Fishing Seasonality and Yield
The seasonality of recreational fishing in the beaches studied been related to the dry season (September and February) and the rainy season (March to August) in Northeast Brazil. The number of fisheries and the amount of catch reported was significantly (p < 0.05) higher in the dry season compared to the rainy season for recreational fishing. On the dry and rainy seasons occur changes in the rainwater input in the sea. Causing a shift in the sea temperature and the salinity dynamics [79]. This change results in an unfavorable the presence of some species, such as the Tainha (Mugil sp) or the Xaréu (Caranx sp) in the fishing spot, resulting in a superior or inferior catch [80].
Shifts in the presence of target species in fishing locations is a traditional knowledge among recreational fishers, justifying a greater presence of these fishers in the dry season than in the rainy season [80]. During dry season, recreational fish was less frequent only in the holiday from the Christmas and the Carnival. In Recife and Jaboatão dos Guararapes cities, are usual to celebrate these holidays in the beaches studied. Many big structures are constructing in the sand zone beach, restricting to access for the fishers. During these holidays, more wastes discarded on the beaches, making the beaches fewer attractive to the fishers. During the rain seasons, we could observe that as the rain would become longer, the number of fishers found fall. Many days nobody fisher was found at the studied beaches.
In this sense because in rainy days few fishers go fish because is the mobility is harder in rainy days in this city. In addition, because sometimes the supply of rainwater is unfavorable for fishing [80]. In 2017, the rainy season in Recife and Jaboatão dos Guararapes was more intense than usual. The precipitation index was around 7.75% higher than the historical average [81]. This rainfall intensity and frequency contributed to the reduction of fishing and the catch in the studied rain season. However, there is no recent registry of fishing and catch in the studied beaches in others rain seasons. This fact difficult a more detailed inference and discussion about it [82-109].
Conclusion
Recreational fishers act city beaches from Pernambuco. The recreational fishers in those beaches are male-dominated activities and the participation of women is associated to be with their family. Therefore, the sensitivity of perceiving changes in the environment is greater for men, while the perception of women is often subject to the information passed on by their companions. The urban beaches that present coral reefs and sandstone reefs work as fishing hotspots that explore the reefs biodiversity and depend on the environment’s good quality. However, the environmental quality of those beaches is not satisfying for the group of recreational fishers.
The main causes of disgust are the shifts in the physical dynamics of the beaches due to the enlargement of Piedade to Candeias beaches and the pollution, which highlighted by the commercial fishers also by the recreational fishers. However, despite the negative aspects approached, those fishers keep on attending and fishing in those beaches. The intensity of recreational fishing activities on the city beaches are dependent on seasonal variations due to dry and rainy seasons. The variations significantly influence on the amount caught because of the reduction of the effort made. In dry seasons, the fishing activities at those beaches reduce during the year-end celebrations and during Carnival. Therefore, more studies are necessary to track the seasonality of fishing actives over the years in the Boa Viagem, Piedade, Candeias and Barra de Jangada beaches.
To Know More About Oceanography & Fisheries Open Access Journal Please click on: https://juniperpublishers.com/ofoaj/index.php
For more Open Access Journals in Juniper Publishers please click on: https://juniperpublishers.com/index.php
0 notes
Text
Coping and Adaptive Approaches of Fisherfolks in Ilaje Fishing Communities, Ondo State to Impacts of Climates

Authored by: Siyanbola A Omitoyin
Abstract
Fish stocks have been reported to have been depleted as a result of climate change impacts in Ilaje Local Government Area of Ondo State, Nigeria, where a large number of people depend on water bodies for their livelihood, this research therefore look into livelihood vulnerability of fisherfolks in the area to climate change and how they are coping and adapting to the changes brought by it. A Multi-stage sampling technique was employed to select a total of two hundred (200) fisherfolks within the regions, data collected were aggregated using a composite index and differential vulnerabilities LVI–IPCC was scaled from -1(least vulnerable) to 1 (most vulnerable). The result show that coastal fishing communities in Ilaje, had a higher livelihood vulnerability index (0.357) than the freshwater fishing communities (0.356), indicating relatively greater vulnerability to climate change impacts. It however shows that people in the freshwater regions were adapting and coping more than the people in the coastal regions as they were clearing the drainages and river courses to prevent flooding; they have access to farmland and farm produce, which is cheaper and easily accessible for them. They also have access to hospital, good health care and make livelihood diversification. Nonetheless, the well-being of fisherfolks in the coastal communities is better because of their economic access to the essential resources needed contrasting the freshwater fisherfolks. Conclusively, improving access to credit facilities could improve fishers’ capacity to diversify into other income-generating activities, provision of hospitals and other social facilities should also be provided.
Keywords: Coping and Adaptive strategies; Climate change; Livelihood diversification; Vulnerability; Fishing communities
Introduction
The environment to a great extent is crucial for man’s existence and survival because most of his daily actions are made possible by the subsistence of his environment. However, this environment is continually under the direct and indirect destructive menace of climate change such as desertification, flooding, rise in sea level, erosion, windstorms, dehydration, the spread of infectious diseases, etc [1]. This climate change is acknowledged to be one of the overwhelming challenges facing man and the ecosystem of the world in the 21st century, resulting from indiscriminate human actions such as deforestation, discharge of domestic and industrial effluents, gas flaring, and large-scale irrigation, etc. Islam and Wong [2] postulate that climate change is gaining extensive notice and concern as it can directly/ indirectly affect our standard of living and quality of life and has a great negative consequence on food production systems, causing food insecurity and malnutrition. Climate change is daily leading to shifts in distributions of aquatic lives, increasing the alarming state of food insecurity, disrupting fishing communities and causing an economic setback for the fisherfolks and thus taking its toll on people’s livelihoods, economies, and society alongside the entire food supply chain.
Climate change is affecting many regions, the coastal zones of the Levantine Mediterranean Sea at the basins of nations like Egypt, Lebanon and Israel which are experiencing continuous coastal land erosions with consequently declined fisheries, Nigeria is not exempted from all these effects [3]. Enete reiterated that the durations and intensities of rainfall have increased and have been projected to continue to increase, causing enormous runoffs and flooding in many places in Nigeria [4]. Precipitation in southern districts is projected to the upswing and rising sea levels are expected to exasperate flooding and submersion of coastal lands [5]. All these extreme weather events can disrupt economic growth through losses of production and infrastructure and the need for unexpected expenditure in curbing the effects. Fishing will be obstructed by sea level rise and extreme weather while the feasibility of inland fisheries will also be endangered by amplified salinity and shrinking rivers and lakes [6,7]. These changes have brought about a constant reduction of coastal and freshwater resources, displacement of households, loss of biodiversity, eutrophication; aquatic habitat destruction, outbreaks of waterborne diseases, and food insecurity [8].
Vulnerability is the exposure of groups or individuals to stress as a result of climate variability and change [9]. The degree of the impact of climate change in fisheries depends upon the level of exposure and vulnerability of fisherfolk to these impacts [10]. An evaluation of vulnerability is an approach to assess the pressure on an ecological system and its capability to manage the pressure [11]. There is a need for building adaptive capacity in local coastal communities to develop alternative coping strategies for the impacts of climate and environmental changes [12]. Adaptation is indispensable in adjusting to the aftermaths of climate change; it focuses on deeds that would assist in minimizing the sensitivity of systems in different affected regions. According to Jellason et al [13], premeditated adaptation approaches consist of government interference and public policy, such as investment in infrastructure, research, modernism, financial supports, and tax regimes. Self-directed adaptation involves coping strategies by the fisher folks and others being affected in rural locales. These may include livelihood diversification; migration to another community in search of jobs mainly during low season, raising of the foundation of the house to prevent a flood from entering, irrigation of their plants and using tolerant varieties of crops.
According to Omitoyin and Fregene [14] coping strategies involve alternative sources of livelihood. Amy Morin believes that coping skills help you in tolerating, minimizing, and dealing with stressful situations in [15]. Adaptation is considered unavoidable and essential to tackle additional shocks and stresses due to climate change [16,17]. It is a process whereby the affected community get themselves ready to deal with the uncertainty in a better way that minimizes the shocks. It is however essential to fortify the adaptation competence of fisherfolks against climate change since it helps them to take up negative brunt, lessen menaces or vulnerability, and also persuade them to take advantages of any prospect that might materialize from the incidence of climate change. Demographic factors of the respondents some such as age, income, experience, and education status were found to influence the community’s climate change adaptation practices [18,19].
Fisheries according to Idowu et al [20] is a source of revenues of the majority of the people in the coastal areas, a key source of protein for waterside and coastal rural communities and this is largely being affected by the effects of climate change. The nature and characteristics of freshwater resources are being affected by climate change, which varies between ecological zones, aggravating the existing problem of drought, flood, and conflict [7]. It has been projected by the majority of researchers that climate change will be altering the efficiency of many of the world’s marine and freshwater fisheries yearly; this is also expected to take a toll on the source of income of millions of the rural people depending on fisheries for their livelihood. Olusanya and van Zyll de Jong [21] believes that freshwater fish populations are speedily diminishing internationally due to the impacts of quick climatic and existing non-climatic anthropogenic stressors.
Fishing as an occupation carries its risks, however, people involved in fisheries and fishery-related livelihoods are vulnerable to a variety of external factors [22]. Fish stocks have been reported to have been depleted as a result of climate change impacts in Ilaje Local Government Area, where a large number of people depend on water bodies for their livelihood, it is, therefore, necessary to take a cognizant look at livelihood vulnerability of fisherfolks in Ilaje fishing communities to climate change and how they are coping and adapting to the changes brought their way through climate change. It is therefore paramount to appraise how fisherfolks in Ilaje fishing communities are coping and adapting to the effect of climate change over the years.
Specific objectives
• To assess the socio-economic characteristics of the respondents
• To examine the coping plans of the fisherfolks against climate change
• To evaluate the adaptive measures adopted by the fisherfolks to cushion the effects of climate change in their communities
Materials and Methods
Research locale
Ilaje Local Government Area of Ondo State housed the largest coastal area of the state. According to the documentation of Adebowale et al [23], Ilaje comprises about 50 settlements scattered around the river tributaries which empty directly into the coast with an annual increment of 2.2% in population size, 80% of which engages in fishing and always recording the bulk of fish production in Ondo State [24]. This important region of Ondo State falls within the oil prospecting states in Nigeria called the Niger Delta region which is often referred to as the richest part of Nigeria, in terms of natural resources endowment. This region lies between longitudes 6°12°E and 6030°E of the Greenwich Meridian and between latitudes 4°10°N and 4°6°N of the Equator, it shared boundary with Ogun State in the West, with Irele Local Government Area and Edo State in the East, with Okitipupa Local Government Area, in the North while in the South it is bounded by Bight of Benin and Atlantic Ocean [25]. The 2006 National Population Commission census figures revealed that the LGA had 290,615 dwellers. The primary occupation of these dwellers is fishing, and they move from one place to the other by water using small and locally constructed canoes and boats (Figure 1).
Data collection and Sampling Technique
A Multi-stage sampling technique was employed to select a total of two hundred (200) fisherfolks from one of the two Agriculture Development Project (ADP) zones in Ondo State. Mahintedo, Igbokoda, Mahin and Ugbonla were the selected cells under the freshwater community, while Etiikan, Zion-ipepe, Idiogba and Ayetoro were the selected cells under the coastal community [26]. Twenty-five (25) fisher folks were selected in each of the eight selected cells using simple random sampling techniques to give a total of 200 fisherfolks. Primary data were collected on climate change vulnerability assessment which will consider the data on exposure, sensitivity and adaptive capacity to erosion, flooding, sea level rise, storm, and drought, following the method of Hahn et al [27].
Data Analysis
Statistical Package for the Social Sciences (SPSS) Version 21, Microsoft Excel 13, and STATA were used to analyse the collected data. Frequencies, Mean, Standard Deviation were analysed through descriptive analysis. Data on vulnerability (on a set of vulnerability indicators such as socio-demographics, livelihoods, social networks, health, food and water security, natural disasters, and climate variability) were aggregated using a composite index and differential vulnerabilities were compared as documented by Hahn et al [27].
Calculation of the LVI–IPCC: IPCC Framework Approach
This was calculated according to the method described by Hahn et al [27]. The LVI includes seven major components: Socio- Demographic Profile, Livelihood Strategies, Social Networks, Health, Food, Water, and Natural Disasters and Climate Variability. The LVI–IPCC diverges from the LVI when the major components are combined. Major components were combined, following the equation below:
where CFd is an IPCC-defined contributing factor (exposure, sensitivity, or adaptive capacity) for district d, Mdi are the major components for district d indexed by i, wMi is the weight of each major component, and n is the number of major components in each contributing factor. Once exposure, sensitivity, and adaptive capacity were calculated, the three contributing factors were combined using the following equation:
where LVI–IPCCd is the LVI for community d expressed using the IPCC vulnerability framework, e is the calculated exposure score for community d (equivalent to the Natural Disaster and Climate Variability major component), a is the calculated adaptive capacity score for community d (weighted average of the Socio-Demographic, Livelihood Strategies, and Social Networks major components), and is the calculated sensitivity score for community d (weighted average of the Heath, Food, and Water major components). LVI–IPCC was scaled from -1 (least vulnerable) to 1 (most vulnerable).
Result and Discussion
Socio-Economic Characteristics
The categorization of the educational status of the fisher folks in the study area is presented in Table 1. The result indicates that those with senior secondary education constitute the highest percentage for those in the coastal area and fresh water representing 42% and 29% of the respondents respectively. This does not connote with the findings of Olufayo et al [26] who reported that the majority of the fisherfolks in Ilaje do not have formal education. However, since the fishers have a lower level of education, their coping and adaptive strategies might be limited since they have limited. Education is a key aspect of the global response to climate change, it helps young minds to understand and address the impact of climate change and to adapt to its change-related trends [28,29]. Franklin and Velusamy [30] observed that fishermen in Kanyakumari, India who possessed higher education are dealing better with the livelihood stress, than the fishermen with lower education.
The result revealed that the majority of fisherfolks have fishing experience exceeding 10 years. This represents about 96% and 93% for the coastal and freshwater regions respectively. Since majority of the fisherfolks are in their young age (below 46 years) as reported by Omitoyin et al [31] it might perhaps mean that the fisherfolks started fishing at a very early age in these communities. This is similar to the report of Islam et al. [32] in the south-west coastal region of Bangladesh that almost all the respondents from the two regions of their study area have fishing experience exceeding 10 years. It was expected that experienced fishers possessed better climate change adaptation practices as they have attained lifelong skill and knowledge to overcome threats from climate change compared with the younger fishers [18,33,34].
Electricity is needed in charging electrical appliances such as the Global System for Mobile Communication (GSM) and internet usage which could help the farmers in acquiring genuine information on coping and adapting to changes brought about by climate. It was shown that the majority of the respondents in the study areas have access to electrical facilities, while communication technology is generally used by both locations 99% of them. Information gathered by Olufayo et al. [26] indicated that the power supply is highly erratic and undependable in the region. This has a negative impact on industrial development as people would have to spend additional money to power their generator. According to Egesi [35], fishermen are using mobile phones to communicate with family, suppliers of fishing gears, middlemen and merchants. Jensen [36] reiterated that the introduction of mobile phones in Indian fisheries has brought about a tremendous change in terms of efficiency and profitability and has allowed fishermen to land their catch in potential markets.
Livelihood Vulnerability to Climate Change
Climate change vulnerability of fisherfolks in Ilaje fishing communities is viewed in reference to their Livelihood. The Livelihood vulnerability index incorporates the IPCC vulnerability definition (LVI-IPCC framework), it has seven major components which are: socio-demographic profile, livelihood strategies, health, social networks, food, water, and natural disaster & climate variability. The LVI-IPCC analysis yielded similar results as it was reported that households in the coastal regions are more vulnerable as shown in table 2 and 3 respectively. The major vulnerability components represented in tables 2 and 3 provides information on the degree to which each household characteristic contribute to climate change vulnerability in each district.
Note: The LVI-IPCC is on the scale from -1(least vulnerable) to 1 (most vulnerable)
For the coastal regions in Ilaje fishing communities, natural disaster contributes mostly to the vulnerability with value 0.5 (index for the most vulnerable), followed by health (0.44), social networks (0.42), livelihood strategies (0.40), socio-demographic profile (0.34), food and water contributes the least with an index value of 0.22 and 0.17 respectively, this is at variance with the work of Hahn et al [27] in their study on Moma coastal fishing communities in Mozambique, the difference can be attributed to the different locations of study, and Amos et al [37] who discovered those socio-demographic characteristics contributes the most to livelihood vulnerability in their study on three (3) coastal fishing communities in Anambra State, Nigeria. This is in line with the work of Halim [38] carried out in Bangladesh, a country which is widely recognized to be one of the most vulnerable countries in the world, that frequent natural disasters are the most characteristic contributing factor to climate change vulnerability in the district, causing loss of life, damage to infrastructure and economic assets, and adversely affecting fish farming.
The freshwater fishing communities in Ilaje have a sociodemographic profile that contributes the greatest to their vulnerability (0.49) with health (0.46), livelihood strategies (0.45), social networks (0.42), natural disasters (0.41), and lowest in food and water with values 0.23 and 0.03 correspondingly, this is not in line with the findings of Hahn et al [27] on the livelihood vulnerability study on Mabote (freshwater community) in Mozambique, which can be ascribed to the difference in location of the study area. Coastal and freshwater fishing communities in Ilaje showed the least vulnerability (below half, 0.25) in relation to food and water. However, the work of Olusanya and van Zyll de Jong [21] carried out in Newfoundland and Labrador proved that freshwater fish resources are getting vulnerable to climate change.
Overall, the coastal fishing communities in Ilaje, had a higher livelihood vulnerability index than the freshwater fishing communities (0.357 versus 0.356) respectively, indicating relatively greater vulnerability to climate change impacts. This is not in line with Hahn et al [27].who reported that freshwater fishing communities have the highest vulnerability index in his work on livelihood vulnerability index in Moma and Mabote districts in Mozambique. It has been proved by some researchers that the rural regions of a country are the most vulnerable regions of such a country since they receive less attention. In China, a country that is classified as a moderately vulnerable nation, it was been reported by Chen et al [39] that Liaoning, Fujian, and Hainan are the comparatively underdeveloped coastal regions of the country and happened to be most vulnerable due to an insufficient adaptive capacity to compensate for sensitivity, whereas, Hebei, which had a very low level of sensitivity, was identified as the most vulnerable province mainly due to an insufficient adaptive capacity to offset moderate exposure.
Coping Strategies of Fisherfolks
Table 4 presents the respondents’ views on the different coping strategies they have adopted at different times. About 96% of the respondents agreed that they do not send their children to live with relatives to ease the burden of the financial burden. However, 52% of the respondents allow their children to work to make ends meet in each area considered. Additionally, 36% of the respondents often migrate to another community in search of jobs to make ends meet. During seasons of low catch and low economic returns on fishing, fisherfolks devise measures to deal effectively with their predicament before returns on fish catch increases, some respondents in the coastal and freshwater communities cope by eating less preferred food due to inadequate finances, reducing the proportion size of food, skipping meals because there was not enough food, a relatively borrow money to buy food and send children to live with relatives to ease the financial burden, and some migrate to another community in search for jobs (including fishing) to make ends meet. This is in concordance with the findings of Halim et al.[38] who reported that fish farmers in Borguna, Bangladesh had changed their occupation that made their socio-economic condition vulnerable, to cope with the situation.
Environmental Quality Perception
In the multiple responses section, fisherfolks in the freshwater regions coped through personal savings, monthly contributions, selling of farm produce (Gari, Vegetables, Yam, Melon, Maize), also selling of livestock (goats, chicken, ducks), selling of preserved fish, diversification into transportation (both water and land), borrowing of money, exchanging fish for other foodstuffs, making purchases on credit, selling of provisions, seeking help from relatives. However, respondents in the coastal regions leave the sea during seasons of high tides and waves that prevent fishing for the fishes in the brackish environment, some take the risk of going to the sea, most respondents have preserved food and fish towards this season, and as such, the price of the preserved fish is increased, some sell firewood that is used for cooking and smoking of fish, whereas others get involved in buying and selling of goods. This is similar to the work of Muflikhati and Hernawati [40] in their study of coping strategies and family well-being of small-scale fishers’ household in Bekasi, west Java province in Indonesia. This work is similar to the findings of Atikah and Purnomo [41] who reported that fish farmers in Pangandaran District, West Java Province, Indonesia are allocating parts of fish production for household consumption, selling some to buy various kinds of food, while processing some portions to get added value.
It however shows that people in the freshwater regions are coping more than the people in the coastal regions as they have access to farmland and farm produce, which is cheaper and easily accessible for them to make livelihood diversification. Coastal fisherfolks household have to buy everything needed for their survival because of limited livelihood diversification disparate from the freshwater fishing communities. Nonetheless, the wellbeing of fisherfolks in the coastal communities is better because of their economic access to the essential resources needed contrasting the freshwater fisherfolks.
Adaptation Strategies of Fisherfolks
Table 5 above shows that 88% of freshwater fisherfolks clear the drainages and river courses to avert flooding, unlike the coastal fisherfolks. No insurance company for the coastal fisherfolks but a few 12% of the freshwater fisherfolks have insurance to cover up in times of losses. Both regions raise the foundation of the house so high to prevent flood from entering. The fisherfolks (coastal and freshwater) adapt to the effects of climate change through consultation of local town planners to avoid flood prone areas, also, when building the houses, the foundation is made so high that flood cannot enter the houses, and there are earth mounds built for livestock to prevent being swept away by the flood. Hay and Mimura [42] in their study on climate change vulnerability and adaptation assessment in the Asia-Pacific regions, has similar results. However, the adaptation strategy is poor in the coastal regions as there are no drainages in these communities, no insurance company in case of destructions by sea level rise, waves, and other natural disasters, also there are no hospitals in these communities, which increase the vulnerability of these communities in case of disease outbreaks or other injuries. Meanwhile, the mangroves along the coast have been destroyed by sea-level rise which limits their adaptation. Freshwater fisherfolks have hospitals in their communities and clearing of drainages and river courses to prevent flooding is also done, perhaps, the nearness of the community to infrastructure unlike the coastal communities is responsible.
Migration provides farmers with an opportunity to make non-marginal adjustments in adapting to climate change [43], it is in the opinion of Sudarmo et al. [44] that skills aside from catching fish are needed to get extra income when fish is scarce. Economic diversification is the main adaptive strategy adopted by fisherfolks in Zimbabwe to reduce vulnerability to climate change [45]. An increase in income from the alternative source of income will enable farmers to adapt to coping with financial shocks from climate change [46]. Islam [47] reported from their work carried out in the coastal fishing communities in Bangladesh that the majority of fishers do not have instant access to medical facilities because they are in remote communities, however, their low health resistance may destabilize the efficiency of their fishing activities and livelihoods. Access to formal credit is one of the major constraints in coping with climatic changes by fishers in South Asia [48]. The majority of respondents in artisanal fishing households in Mkomani, Kenya, identified the lack of sufficient income (and the numerous domestic deprivations this caused), as well as the failure to receive any meaningful assistance from the government as the primary manifestations of their poverty [49].
Conclusion and Recommendation
The study identified the livelihood vulnerability of climate change and the adaptive and coping strategies peculiar to the fishermen in Ilaje LGA, Ondo State, Nigeria. A well-structured questionnaire was used to obtain information on the adaptive and coping strategies in study regions, the result revealed that those with senior secondary education constitute the highest percentage for those in the coastal area and freshwater representing 42% and 29% of the respondents respectively. The result revealed that the majority of fisher folks have fishing experience exceeding 10 years. This represents about 96% and 93% for the coastal and freshwater regions respectively. It was shown that majority of the respondents in the study areas have access to electrical facilities, while communication technology is generally used by 99% of the respondents in both locations. Generally, the coastal fishing communities in Ilaje, had a higher livelihood vulnerability index than the freshwater fishing communities (0.357 versus 0.356 respectively), indicating relatively greater vulnerability to climate change impacts. It however shows that people in the freshwater regions are coping more than the people in the coastal regions as they have access to farmland and farm produce, which is cheaper and easily accessible for them to make livelihood diversification. Coastal fisherfolks household have to buy everything needed for their survival because of limited livelihood diversification disparate from the freshwater fishing communities. Nonetheless, the well-being of fisherfolks in the coastal communities is better because of their economic access to the essential resources needed contrasting the freshwater fisherfolks. Government, NGOs, and other financial institutions should provide improved access to credit facilities with minimal interest rate could improve fishers’ capacity to diversify into other income-generating activities, provision of hospitals and other social facilities should also be provided for good health care and ability to access internet to gain information to cope well with climate change.
To Know More About Oceanography & Fisheries Open Access Journal Please click on: https://juniperpublishers.com/ofoaj/index.php
For more Open Access Journals in Juniper Publishers please click on: https://juniperpublishers.com/index.php
0 notes
Text
Melanized Lesions in Red Swamp Crayfish (Procambarus clarkii) Reared in the Laboratory Conditions
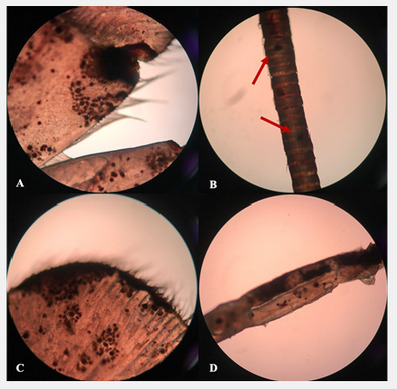
Authored by: Onur Karadal
Abstract
Red swamp crayfish (Procambarus clarkii) is an economic decapod species and the most cultivated crayfish in the world. In nature, this species can tolerate the hardy alterations, but they are vulnerable to water parameters in culture conditions. Crayfish have to molt to grow, and the non-renewable shell is a suitable surface for pathogenic activities until the next molt. In this study, melanized lesions were determined in red swamp crayfish from several parts of body exoskeleton: cephalothorax, abdominal shell, uropods, walking legs, swimmerets, and antennae. The bacteriological and mycological isolations were conducted onto tryptic soy agar, brain heart infusion agar, Sabouraud’s dextrose agar and glucose yeast agar, but no particular microbial growth was observed from cultured samples. The aetiology of the case was not associated with any bacterial or fungal agents; however, the water conditions could be related with the melanosis.
Keywords: Cambaridae; Molting; Shell rot; Exoskeleton erosion; Appendages
Introduction
Red swamp crayfish (Procambarus clarkii) is native from north-eastern Mexico and United States (Louisiana). The species is resistant to extreme conditions, including oxygen and temperature alterations, water pollution, and drought and located in wetlands, marshes, rivers, and lakes [1,2]. However, this crayfish is the most cultivated species in the world and has an economic importance for both aquaculture and aquarium sectors [3]. Besides the popularity of this species, invasive effects have been recorded from North and South America, Europe, Asia, and Africa [4]. In Turkey, no commercial red swamp crayfish cultivation has been done. This species accepted as a pet in the last quarter of the 2000s and traded as the most common crayfish species in the aquarium industry of Turkey. Red swamp crayfish is a member of Order Decapoda (Crustacea), which characterized by ten jointed legs and other appendages. Five pairs of pereiopods (walking legs) and pleopods (swimming legs) exist beneath their cephalothorax and abdomen regions [5]. Segmented antennas and antennules are vulnerable against the physical attacks. Crayfish have to molt to grow, and the molting frequency decreases as the crayfish grows [6]. This causes microorganisms that adhere to these appendages and body regions that cannot be regenerated (until the next molt) to stay longer and increase the pathogenic potential. There are several pathogens that cause disease in crayfish; Saprolegnia parasitica, Trichosporon jirovecii, Vibrio species [7-9], and melanized lesions are very common in many cases. Despite tolerating the wide range of water parameters, the relevant stress cause pathological lesions on the exoskeleton of crayfish. In this case, pre-identification study on tissue samples from decaying body parts and appendages of laboratory-reared red swamp crayfish was reported.
Materials and Methods
Laboratory Conditions and Rearing System
The case was observed in Tropical Aquaculture Laboratory, Faculty of Fisheries, İzmir Kâtip Çelebi University, Çiğli, İzmir, Turkey. Red swamp crayfish (Procambarus clarkii) were obtained from a commercial facility and reared in the laboratory conditions. The crayfish were stocked into two recirculating freshwater sump systems (270 L in each) and fed twice daily with commercial bottom feed (Artakua®, Tire, İzmir, Turkey), routinely. In the sump system, a submersible pump (Aquawing AQ6000) transfers water to the plastic containers (10 L) and U-PVC outlines collect the water to the glass sump aquarium (150 L). System water is filtered by passing through the biological sponge and resting with activated carbon, ceramics, and bio-balls. The filtered water is transferred back to the containers with the submersible pump.
Water Parameters
The temperature in the systems was held at 25-26 °C with external heaters (Hydor ETH 300). Dissolved oxygen and pH were measured daily with AZ 84051 Combo Water Meter and their range were recorded as 8.70-9.50 ppm and 7.30-7.80, respectively.
Microbiological Tests
The crayfish showing melanized lesions on different the parts of the exoskeleton were sampled (n=10) and microbiological studies were conducted in the Fish Disease and Biotechnology Laboratory, Faculty of Fisheries, İzmir Katip Celebi University, Çiğli, İzmir, Turkey. The specimens were examined in detail and the hemolymph samples were streaked onto tryptic soy agar (TSA, Merck) and brain heart infusion agar (BHIA, Merck) for any bacterial infection. Samples from melanized lesions were cultured onto Sabouraud’s dextrose agar (SDA, Merck) and glucose yeast agar (GYA) for the fungus culture. The plates were incubated at 25 °C and regularly checked for bacterial or fungal growth.
Results
The melanosis and erosions on the exoskeleton of crayfish were determined especially in body regions (cephalothorax, abdomen, telson, and uropods) and appendages (walking legs, swimmerets, chelipeds, joints, antennae, and antennules) (Figure 1). These body parts examined under the light microscopy (Olympus BX53) and intense melanizations were observed (Figure 2). A causative pathogen wasn’t isolated from diseased individuals. A causative pathogen wasn’t isolated from diseased individuals.
Discussion
Salighehzadeh et al. [10] reported melanized abdominal lesions in narrow-clawed crayfish (Astacus leptodactylus) and determined co-infection caused by Aeromonas hydrophila and Fusairum solani. Findings obtained from the microbiological tests were not compromised with the current study although applying the same methodology. Similarly, Abdallah et al. [8] isolated Trichosporon jirovecii from the melanized exoskeleton of red swamp crayfish (Procambarus clarkii) collected from the River Nile. The isolation and purification of the fungi were performed onto GYA and SDA from melanized uropod, walking legs, abdominal shell, telson, swimmerets, rostrum and antennae. Moreover, complete loss of uropods, walking legs, swimmerets, telsons and / or antennae were recorded in some cases. Krugner-Higby et al. [11] monitored native crayfish (Orconectes propinquus) with ulcerative lesions on the carapace and legs from Big Muskellunge Lake (USA). The lesions were reported discolored as brownishblack spots because of melanin deposition linked to Saprolegnia australis infection.
Likewise, there are several reports of idiopathic conditions of Australian red claw crayfish (Cherax quadricarinatus) just as black to dark, blue-colored spots on the exoskeleton [12-15]. Edgerton [14] observed round, dark blue to black spots in the exoskeleton of C. quadriacarinatus ‘pin-prick’ pit at the center of the spot. The melanization in the cuticle was associated with abiotic and biotic irritants. Moreover, nutritional factors were also mentioned to be considered in future studies. In this study, the bacteriology and mycology studies were not present any results that support infectious causes of this syndrome despite using the same methodology with similar research.
Conclusion
In conclusion, further detailed studies are necessary to determine the causative agents of the disease. The melanosis on the exoskeleton of crayfish is become a limiting factor for aquarium sector that cause economic loss.
To Know More About Oceanography & Fisheries Open Access Journal Please click on: https://juniperpublishers.com/ofoaj/index.php
For more Open Access Journals in Juniper Publishers please click on: https://juniperpublishers.com/index.php
0 notes
Text
Length-Weight Relationships and Condition Factor of Six Sole Fish species from Coastal Waters of Pakistan

Authored by: Mohammad Shafi
Abstract
The current study aimed to investigate the morphometric analysis based on length and weight relationships and condition factors of six sole fish species i.e., Cynoglossus punticeps, C. arel, C. quadrilineatus, Pseudorhombus javanicus, P. elevates, and Euryglossa orientalis belong to three different families Paralichthyidae, Cynoglossidae and Soleidae. Their feeding practices are quite different from other species as they forage mostly on bottom invertebrates, therefore, these species inhabiting in shallow muddy and sandy bottom of the continental shelf along the coast. Sole fish species were collected from five harbors i.e., Karachi fish harbor (KAH), Keti Bandar fish harbor (KBH), Korangi fish harbor (KOH), Ormara fish harbor (OFH) and Pasni fish harbor (PFH) along the coast. The significant variations were observed in morphometric parameters according to fish species. The highest condition factor was evaluated for E. orientalis (1.943) and lowest was examined for C. arel (0.469). This is the preliminary analysis from Pakistani waters and an addition of some basic information on the biology and growth of sole fish in the marine environment of Pakistan.
Keywords: Length-weight relationship; Fish assemblage; Sole fishes; Pakistan
Introduction
Length-weight relationship has a conspicuous importance to differentiate the biological stock demonstration, to understand by body condition records, figure biomass dependent on length recurrence circulations and for acoustic overviews [1-3]. Inspite of its significance and the way that these relationships are effectively acquired, they are normally absent for a few animal types, particularly those that are not economically important [3]. The relationship between length and weight is analyzed on the basis as used to explore information regarding fish condition, factors and examine the nature of the growth of fish, whether isometric or allometric [4,5]. Generally morphometric data likewise interlink between total length and total weight are essential, especially for Eco morphological studies [6,7].
An indispensable job is played by fish in the advancement of a country in spite of the fact that it is the least expensive wellspring of over-the-top nutritive protein. It has other fundamental supplements which are required to human body [8-10]. Length-weight relationship (LWR) is basic instrument in the executives of fishery it is additionally essential in fisheries the board for relative development ponders it gives vital data on the oceanic natural surroundings numerous devices were utilized in fishery science to separate fish populace, for example, hereditary and morphometric it is broadly used to realize the distinction between fish populace [11-15].
Flat fishes play a vital role in energy pathway, and it is also beneficial for conservation of benthic organisms in a form suitable for human consumption [16]. Since 1930, the relationship between Length-weight was used [17]. It was described with Cubic parabola first. W=aL3 after this procedure, it has been superseded by general parabola. The result of general parabola is much better than cubic parabola W=aLb b=2to4 to values will exist a and b they both differ between species, through annual spawning seasons [18]. When b is equal to 3 it means the growth is isometric if it is more than 3 or less than it is termed as allometric growth, thus length-weight relationship (LWR) measurement of any species prerequisite to the study about its population [19].
Fishes impart benefits to human being in plenty ways. It is also essential dietary animal basic protein source in human food [20]. The population of humans has been increasing day by day and it is inversely proportional to animal protein. The fish meat provides energy and high quality of proteins, which holds all mandatory amino acid in effortlessly digestible; thus, they are worthwhile nutritious sources [21]. The morphometric analysis can also provide the valuable information on aquatic habitat [13]. Differences appeared during the morphometric analysis are important for evaluating the species variation and structure of population on behalf of recognizing stocks [22].
Length-weight relationships of fishes are important tools in fisheries science for the various studied areas i.e., estimation of standard weight of fish species in a given length assemblage [11], growth rate, age and length structures, conversion of growth in-length equations to growth-in-weight in stock assessment models, biomass from length frequency distributions. Lengthweight relationship (LWR) considered as an imperative growth index used as a sustainable management tool by fishery biologists. Morphometric relationships among the fish used to assess and determine the possible differences between the different species and stocks of the species [12,23]. Length and weight relationship plays huge role in population dynamics and fishery biologist, where plenty stock assessment models have been entail using length-parameters.
The review of literature provides few previous studies on these important species (Table 1) Sole fishes from Cynoglossidae family are commercial fish in China. Bohai Sea and in east yellow sea [24]. Owing to overfishing, wild population is being decreased and annual output less than 1 ton now [25]. In china sole fishes are commercial fish and also culture able and these are being culture in European countries. These species are reported from both coasts of Pakistan, i.e., Makran coast and Lasbela coast including, Gwadar, jeewani, Ganz, Sur Bandar, Pasni, Ormara, Korangi and Keti Bandar. The present study intended to investigate the morphometric analysis, length-weight relationships, and condition factors of six sole fishes i.e., Cynoglossus punticeps, C. arel, C. quadrilineatus, Pseudorhombus javanicus, P. elevates and Euryglossa orientalis belong to the three families Paralichthyidae, Cynoglossidae, and Soleidae from coastal waters of Pakistan.
Materials and Methods
Flat fish sampling was conducted during a whole year of 2018 from five harbors, i.e., Karachi fish harbor (KAH), Keti Bandar fish harbor (KBH), Korangi fish harbor (KOH), Ormara fish harbor (OFH) and Pasni fish harbor (PFH) along the coast of Pakistan (Figure 1)). Fish individuals were identified up to the species level with the help of the fish identification key [26]. A total of 1238 specimens of six species (Cynoglossus punticeps, N=75; C. arel, N=216; C. quadrilineatus, N=519; Pseudorhombus javanicus, N=213; P. elevates, N=57; and Euryglossa orientalis, N=156) were used in morphometric analysis. Total length (TL) and total width (TW) measured by a stainless scale (nearest 0.1 cm), whereas total weight (TW) measured by using digital weight balance (nearest 0.01 g). Length-Weight, relationship was calculated by following equation given by Le-Cren (1951):
Where, W is the weight and L is length of fish individuals, “b” is the allometric growth parameter or slope, and “a” is termed as an initial growth factor (y-intercept). The condition factor (K) is a useful index for monitoring feeding intensity, age, and growth rates defined the well-being of the fish and was obtained using the following formula [27].
Statistical Analyses
Morphometric parameters of fishes were analyzed through basic descriptive statistics, which include mean, standard deviation, minimum and maximum. Analysis of Variance (ANOVA) was used to assess the variations in morphometric parameters regarding fish species and fish harbors and level of significance were accepted at 0.05 probability. Pearson’s correlation analysis (r2) was used to determine the relationship between morphometric parameters in fishes. Linear regression analysis (r2) was employed to evaluate the relationship between length and weight of the fishes.
Results and Discussion
The present study provides the Length -Weight relationship (LWR) and relative condition factor (k) of total of six flatfish species (Cynoglossus punticeps, C. arel, C. quadrilineatus, Pseudorhombus javanicus, P. elevates, and Euryglossa orientalis) from three families (Figure 2), namely Cynoglossidae, Paralichthyidae, and Soleidae. were collected in the current study along the coastal waters of Pakistan. The inter and intra specific variations were observed in the length and weight relationship of studied species of flat fishes in morphometric parameters (Table 2). The morphometric parameters showed significant variations (p <0.001) among the species collected from coastal waters of Pakistan. The total mean length (cm) for all the six studied fishes was significantly varied Whereas, the highest width (cm) was observed for P. javnicus (14.09) followed by P. elevates (12.85), E. orientalis (10.36), C. puncticeps (9.77), C. qudrilineatus (9.48) and C. arel (7.17). The wet weight (g) of studied fishes ranged from 301.6 to 120.5, which was observed highest for P. elevatus and lowest for C. arel (Figure 3).
C. quadrilineatus found in abundance from all six species along the Pakistan coast. Among the sole fishes, Cynoglossus is genus of flatfish, belong to Cynglossidae family and can be distinguished by the presence of hook-on snout which is overhanging the mouth. In the current study, the “b” values were observed 2.859 as compared to the reported values (3.213) from the same fish of the family [28]. The second most abundant species P. javanicus, which was also collected from all fish harbors like C. quadrilineatus. The significant correlation (R2 = 0.83) evaluated between length-weight relationship. A positive allometry (Figure 4) was observed with the “b” values (3.043) for P. javanicus, is comparable to the reported values 3.207 for the same species [29]. Cynoglossus arel was the third most abundant species showed the significant correlation (R2 = 0.68) between length-weight relationship with a positive allometry (Figure 4).
In the current study, the observed “b” values (2.859) for C. arel can be compared with the previous reported 2.923 values [30]. Pseudorhombus elevates belongs to the Paralicthidae family, which is recognized as having 67-74 rays, anal fin with 52-58 rays by its strongly ovoid body with dorsal fin. The specimen of P. elevates only procured from Karachi fish harbor along the Sindh coast. The average length, width and wet weight of fish is 29.81 cm, 12.85 cm and 301.6 g, respectively (Table 2). The positive allometry and significant correlation (R2 = 0.73) evaluated between length-weight relationship (Figure 4). In the current study, the “b” values were observed 1.019 as compared to the reported values3.290 [28]. The average length, width, and wet weight of C. puncticeps ranged from 30.11 to 32.44 cm, 9.46 to 10.13 cm and 138 to 204 g, respectively (Table 2).
The significant correlation (R2 = 0.49) evaluated between the length-weight relationship of C. puncticeps and showed isometric allometry (Figure 4). In the current study, the observed “b” values were less 2.02 as compared to the reported values 3.12 [31]. Total 156 individuals of E. orientalis were collected from two harbors i.e., Keti Bunder and Karachi fish harbors. The significant correlation (R2 = 0.76) evaluated between length-weight relationship and showed a positive allometry (Figure 4). In the current study, the “b” values were observed 2.94 as compared to the reported values 2.927 [32]. E. orientalis belongs to Soleidae family; it is a marine fish species. It populates in shallow muddy and sandy extremities of coastal waters and also in brackish water. It feeds on base enduring invertebrates, mainly small crustaceans [33].
The length-weight relationships presented the significant positive correlation for C. quadrilineatus (r2= 0.75), C. arel (r2=0.68), P. javanicus (r2=0.83), however, C. puncticeps (r2=49) showed slight negative correlation. The variations in morphometric parameters among the species most likely due to the ecological conditions of the niche and/or physiological condition of fish [20]. However, some scientists already recognized the factors affect the distribution and profusion of fish such as spawning rates, supply of food and depth of water, vegetation, breeding grounds and some other factors which have been recommended as major factors and the abundance of numerous families in Lake of Kianji [34].
The results of this study provide useful basic biological information about the most conspicuous species of fish caught in the study area that can also be compared to surrounding areas, The Fulton’s condition factor (K) is an extent as linking the length and weight for a particular fish, therefore it could be influenced by the same factors as Length and weight relationship. It was proposed that if the K value is 1.00, the condition of the fish is poor, long, and thin. A 1.20 value of K indicates that the fish is of modest condition and acceptable to numerous anglers [35]. If the fish would have a K value that is approximately 1.40 or more considered as a good and well-proportioned. The condition factor (K) for the studied species ranged from 0.406 to 1.94 (Table 3), the lowest condition factor was evaluated for C. arel that showed the less favorable environmental condition of the area for this species. Similar condition factor was described from coastal waters of Nigeria in Lagos state [36].
The higher condition factor evaluated for E. orientalis at Korangi fish harbor, which showed the favorable environmental condition in the area. Similar condition factor was described from coastal waters of Parangipettai Coast, India [37]. The condition factor (K) of C. puncticeps and C. quardilineatus was 0.735 and 0.634 respectively (Table 3), showed the moderate favorable environmental condition in the area. Similar condition factor for these species were described from coastal waters of Nigeria from Nkoro River Niger Delta [38]. For the C. arel the K value (0.469) showed the poor conditions and similar condition factor was described from coastal waters of Tighra reservoir, Gwalior, throughout May 2012 to April 2013. Tighra reservoir mendacities on 26-12’0” latitude and 78 - 30” E Longitude [39]. The condition factor (K) for P. elevatus calculated as 1.138 (Table 3), which showed the favorable environmental condition in the area. Similar condition factor was described from coastal waters of Iran muddy shores of the inter-tidal zone of Bandar Abbas city, Persian Gulf, Iran [40]. The highest (1.927) condition factor (K) was observed for E. orientalis (Table 3), which showed the favorable environmental condition in the area.
Based on this criterion, the sampled fishes along the coast were in good and moderate conditions except C. arel, However the difference in condition factor could be due to the availability of food organisms at a particular time as well as the difference of development [41]. The present data could not clarify the factors among those described above could have led to these observations. Mean values of length-weight relationship and condition factor were therefore considered to be indicators of the study area regardless the sampling locations. Moreover, in present study, the factors that affect and predictors of the length-weight relationship, such as habitat, seasonal consequence, stomach richness, preservation techniques, adulthood stage, maturity, age, and gender [42,43] were not taken into consideration. Due to such reasons, the estimated length-weight relationship and the values of a and b can be considered as the mean values, as proposed by several authors [44].
The variations in morphometric parameters among the coastal areas probably due to the ecological conditions of the niche and/or physiological status of fish [20]. It is well known that the functional regression b, value varies according to the body shape of fish and some life history parameters such as maturity, maximum size, growth rate, and others factors like habitat, stomach fullness, health, sex, age, etc., [1,4,45]. The results of this study provide useful basic biological information about the most conspicuous species of fish caught in the study area that can also be compared to surrounding areas, like the Veracruz Coral Reef System National Park [45].
Conclusion
This study aimed to investigate the morphometric analysis, length-weight analysis, and condition factor of six endemic species (Cynoglossus quardilineatus, C. arel, C. puncticeps, Pseudorhombus javanicus, P. elevatus, and Euryglossa orientalis) inhabiting in the coastal waters of Pakistan. The significant variation (p <0.05) was observed in length, width, and weight among the six fish species. The length-weight analysis showed the significant positive relationship in between length and weight of all studied fishes except negative growth relationship Pseudorhombus javanicus. The mean condition factor was examined highest for E. orientalis and was lowest for C. arel that inhabiting in coastal waters of Pakistan. The current study provides the basic information on length-weight relationships and condition factor ‘K’ for six sole fish species, and it would be utilize in biology and ecology of these fishes to manage the fin fish fishery resources in coastal waters of Pakistan.
To Know More About Oceanography & Fisheries Open Access Journal Please click on: https://juniperpublishers.com/ofoaj/index.php
For more Open Access Journals in Juniper Publishers please click on: https://juniperpublishers.com/index.php
0 notes
Text
Sea Spaces of Bulgaria

Authored by: Yuriy Dachev
Abstract
Regulating the sea spaces of the UN member states is simultaneously socio-economic, political, international law and scientific and technical issue. Factors for this are the possibilities for exploitation of the seaspaces’resources, the raw materials of the seabed, as well as the protection of the marine environment. The growing shortage of raw materials and resources worldwide is drawing the attention of countries to the seabed, which contains the largest undeveloped resources. Other factors are also important - fishing, aquaculture, maritime transport, tourism, energy sector, underwater cultural heritage, and others. These as paces of Rep. Bulgaria have been regulated since 1987 by the Maritime Areas Act, and since 2000 their legal regime has been regulated by the Maritime Areas, Inland Waterways and Ports Act of the Republic of Bulgaria. It is fully compliant with the norms and principles of the international maritime law, regulated in the UN Convention on the Law of the Sea, which Bulgaria signed on December 10, 1982, and ratified by law on April 24, 1996. In its sea space, Bulgaria exercises sovereignty, sovereign rights, jurisdiction and control in accordance with the norms of international law and the international treaties it has concluded.
Keywords: Inland sea waters; Territorial sea; Adjacent area; Continental shelf; Exclusive economic zone
Introduction
These spaces of the Republic of Bulgaria have five legal categories:
• Inland sea waters;
• Territorial sea;
• Adjacent area;
• Continental shelf;
• Exclusive economic zone (EEZ).
Sea Spaces of Bulgaria
Inland Sea Waters
These include the waters between the coastline and the baselines from which the territorial sea is measured. According to the Law on Maritime Areas, Inland Waterways and Ports of the Republic of Bulgaria, these are [1,2] (Figure 1)
i. The waters between the coastline and the straight-line connecting Cape Kaliakra (43°21,6′N; 28°27,9′E) and Cape Tuzla, also called Solnitsa (43°24,0′N; 28°13,2′E). The water area is 50.2 sq. km ddepths reach 15 m and the slopes of the bottom are 0.1% - 0.2%.
ii. The waters between the coastline and the straight-line connecting Cape Tuzla (43°24,0′N; 28°13,2′E) and Cape Ekrene (43°19,7′N; 28°04,1′E). The water area is 34.6 sq. km depths reach 16-17 m, and the slopes of the bottom are 0.1% - 0.2%.
iii. The waters between the coastline and the straight-line connecting Cape St. Constantine (43°13, 7′N; 28°00, 8′E) and Cape Ilandzhik (43°03, 3′N; 27°54, 4′E). The water area is 45.1 sq. km depths reach up to 22 m and bottom slopes range from 0.1% to 0.4%.
iv. The waters between the coastline and the straight-line connecting Cape Emine (42°42,0′N; 27°53,9′E) and Cape Maslen Nos (42°18,4′N; 27°47,6′E) The water area is 782.7 sq. km depths reach 48 - 49 m, and the slopes of the bottom are from 0.1% to 2.6%.
v. The waters between the coastline and the straight-line connecting Cape Maslen Nos (42°18,4′N; 27°47,6′E) and Cape Rohi (42°09,7′N; 27°52,4′E). The water area is 54.4 sq. km depths reach up to 50 m and the slopes of the bottom are from 0.3% to 1.3%.
The total water area of inland sea waters is 967.0 sq. km.
Territorial Sea
The territorial sea of the Republic of Bulgaria includes the sea strip adjacent to the coast and the inland waters with a width of 12 nautical miles (22 224 m), measured from the baselines. The baselines are the line of the largest ebb from the shore and the straight lines connecting the end points of the inland waters [2,3] (Figure 2). The water area of the territorial sea is an area of 5322.0 sq. km. Depths range from 0 to 86 m and bottom slopes range from 0.2% to 2.0%. The territorial sea of Bulgaria is distinguished from the territorial seas of Turkey and Romania by the sea borders with them. The inland waters and the territorial sea, their bottom and their subsoil are part of the territory of the Republic of Bulgaria, on which it exercises its sovereignty. Their total water area is 6289.0 sq. km. These borders of the territorial sea are a state border of the Republic of Bulgaria. [4,5]
Adjacent Area
The adjacent area of the Republic of Bulgaria is the sea strip, which borders the territorial sea and extends at a distance of 24 nautical miles (44 448 m) from the baselines from which the width of the territorial sea is measured [2,6] (Figure 3). Bulgaria carries out control to prevent the violation of the customs, financial, border and health requirements of the state in the adjacent zone. The water area of the adjacent area is an area of 5056.0 sq. km. The predominant depths are in the range of 35 to 100 m, but in some sections, they reach 1000 m. The adjacent area includes a large part of the boundary of the continental shelf (continental threshold), which is the depth contour with a depth of 100 m. The adjacent area also includes a small part of the continental slope with depths of 100 to 1000 m. The slopes of the bottom vary from 0.2% in the areas of the shelf to 15% in the sections of the continental slope.
Continental Shelf
The continental shelf of the Republic of Bulgaria includes the seabed and the subsoil of the underwater region, which are a natural extension of its land territory and extend to the established borders with the continental shelf of the neighboring and opposite countries - Romania, Ukraine, Russia, Georgia, and Turkey. This means concluding bilateral agreements with these countries in accordance with generally accepted principles and norms of the international law. So far, such an agreement exists only with the Republic of Turkey. The most reasonable approach is for the Black Sea states to conduct joint negotiations to clarify the boundaries of the Black Sea shelf [2-4,7] (Figure 4). The outer boundary of the continental shelf can be established on the basis of geological and geomorphologic data. It is outlined by bathymetric profiles, which record the sharp change in the slope of the seabed. From a physical/geographical point of view, the natural boundary of the continental shelf is the continental threshold, after which the continental slope begins, characterized by a sharp increase in depth. For the Bulgarian area of the Black Sea, the continental threshold is the depth contour with a depth of 100 m.
The water area of the Bulgarian continental shelf next to the depth contour with a depth of 100 m has an area of 10 865.6 sq. km. Much of it is in the waters of the territorial sea and the adjacent area. North of Cape Kaliakra, the shelf significantly increases in width, reaching over 75 nautical miles. The slopes of the bottom vary from 0.2% to 2.6%. Bulgaria has sovereign rights to search, explore, develop, use, preserve and manage natural resources on its continental shelf. It has the right to use all energy, mineral and other non-biological resources on the seabed and in its subsoil. Bulgaria has the exclusive right to perform, permit and regulate drilling operations in its continental shelf. The same applies to the construction or use of artificial islands, installations, and structures.
Exclusive Economic Zone
The exclusive economic zone of the Republic of Bulgaria extends beyond the borders of the territorial sea [2]. It may be up to 200 nautical miles from the baselines from which the territorial sea is measured. Its external borders are determined by agreement with neighboring and opposing states in accordance with the international maritime law (Figure 5). The main difficulty in determining (delimiting) the sea spaces of the Black Sea countries stems from its elliptical shape and limited size. For these reasons, no Black Sea country can claim a maximum width of 200 nautical miles in its exclusive economic zone. Bulgaria only has an agreement on the southern border of its maritime areas with the Republic of Turkey.
Along the sea borders of Bulgaria with Turkey and Romania, described with the geographical coordinates of the border points in Tables 1, 2, 3 and 4, the water area of the exclusive economic zone of Bulgaria has an area of 28 768.2 sq. km. It includes parts of the continental shelf, the continental slope, and the bottom of the Black Sea. Due to international treaties, Bulgaria has sovereign rights for research, development, use, protection, and management of biological, mineral and energy resources, for research, as well as for the creation and use of artificial islands, installations and facilities and other rights in the EEZ.
Sea Borders of Bulgaria
On December 4, 1997, an agreement was drawn up in Sofia between Bulgaria and Turkey for the delimitation of the sea areas between the two countries [3] (Figure 5). It was ratified by a law adopted by the 38th National Assembly on 24.06.1998 and promulgated in SG, no. 68 of 30.07.1999. It defines the end point of the land border between the two countries at the mouth of the Rezovska River. It is parallel to latitude 41°58´59.4’’N. From it begins the sea border dividing the Bay of Rezovo between the two countries with points C, D and E. Point E is at the exit line, closing the internal sea waters of the bay. The geographical coordinates of the points are determined in the coordinate systems of the two countries (Table 1). From point F begins the border of the territorial sea between the two countries. It runs parallel to latitude 41°58’52.8”N through point F and ends at point G. (Table 2) (Figure 5) From point G begins the boundary of the continental shelf and the exclusive economic zone between the two countries, which is defined by 10 points. Their geographical coordinates are defined in the WGS-84 coordinate system. Only the border between 9 and 10 border points, which will be specified after negotiations with Romania and Ukraine is in question (Table 3) (Figure 3) [5,9].
Bulgaria and Romania have been in talks since 1980 to delimit the sea border, but no agreement has yet been reached. Upon joining the European Union, the two countries have committed themselves to defining the boundaries of their sea spaces on the basis of consensus. The territorial sea border with Romania should run parallel to the land border, as has been done with Turkey. The land border with Romania is Cape Sivriburun, which is border point 1 (Figure 5) with geographical coordinates 43°44’19.41’’N; 28°34’44.52’’E. [8,10] The geographic coordinates in the tables 1, 2, 3 and 4 are in WGS 84 coordinate system. At present, the so-called “Working” sea border is established with the sea areas of Romania, which is currently secretly complied with by both countries, which does not cross the border parallel 43°44’19.41’’N (Table 4).
Conclusion
The water area of the sea spaces of Bulgaria, including the internal sea waters, the territorial sea, and the exclusive economic zone, has an area of 35 057.2 sq. km., which is 31.6% of its territory. The easternmost point of our sea spaces is point 6. It lies parallel to Cape Kaliakra and is 117.4 nautical miles from the Bulgarian coast. Due to the limited size and specific shape of the Black Sea, none of the Black Sea states can establish a 200 nautical mile EEZ without harming the interests of other states. Bulgaria has also not exercised its right to enter 200 nautical miles into the sea, but it insists on a fair distribution of the sea areas of the Black Sea states. The most reasonable approach is for coastal states to conduct joint negotiations on the delimitation of their maritime areas in the Black Sea. It would be reasonable for a part of the continental shelf of the Black Sea to be declared a common property of the Black Sea states, which does not contradict the Convention on the Law of the Sea.
To Know More About Oceanography & Fisheries Open Access Journal Please click on: https://juniperpublishers.com/ofoaj/index.php
For more Open Access Journals in Juniper Publishers please click on: https://juniperpublishers.com/index.php
0 notes
Text
Using Optimization Problems for Networks When Choosing the Fish Products Delivery Routes Through Alternative Hubsa

Authored by: Dmitry Kopyev
Abstract
Restrictions on the Russian fish products supply to the People’s Republic of China resulted in the emergence of cargo flows to China through other countries and the redirection of flows to the central part of Russia. The possible appearance of new distribution centers in the Russian Far East will create additional fish products delivery routes to the central regions of Russia and China. The paper presents methodological approaches to the selection of routes using a modification of the network problem.
Keywords: Transport leg; Shipment charges; Route choice; Fish products distribution hub
Introduction
The functioning of the Russian economy in the context of the COVID-19 pandemic is forcing the Russian government to change the transport development strategy in the Far East of the country. The changes will also affect the transport system serving the fish products traffic. This is primarily due to the success in marketing the Far Eastern fish brands to the food market in the central part of Russia. This led to an increase in domestic demand for Far Eastern fish products. A significant obstacle to supplies increase was the lack of refrigeration tanks in Russian Pacific ports. Therefore, in the next five years, one should expect the emergence of powerful competing hubs in the territories close to the fishing areas.
First of all, it is the creation of a transport and logistics center in Petropavlovsk-Kamchatsky. The project is being implemented by the “Seroglazka Terminal” company, which actively cooperates with the world leader in the field of container transportation - the Danish company Maersk Line. The terminal will become the base port for the nuclear-powered container-lighter carrier “Sevmorput”. The vessel will be used to deliver fish products in containers to the ports of Arkhangelsk and Ust-Luga. The operation of the lighter carrier will create an alternative to the Trans-Siberian Railway. And the use of Siberian rivers for the container’s delivery from a lighter carrier to the regions of Siberia, with subsequent shipment to the northern regions of China, can make this route more attractive compared to the route through Dalian or Vladivostok.
One of the ports of the Sakhalin Region may become a major hub after the completion of the bridge building between the mainland and Sakhalin Island. The bridge building is supported by plans for the development of the Baikal-Amur Railway and the Trans-Siberian Railway. A large fish hub is being designed in the Primorsky Territory. The fish producers’ interest in the domestic market is supported by a significant drop in fish sales to the People’s Republic of China. The rejection of fish caught by Russian producers is associated with the discovery of coronavirus traces on the products packaging. At the same time, the supplies volumes of Russian fish to China through the Republic of Korea increased. Considering the activity of Russian fishing companies in the markets of Japan and South Korea, we can talk about the emergence of new flows from fishing areas to China through intermediate warehouses in South Korea.
Thus, several additional routes arise, in addition to supplies through Qingdao and Dalian. And while eliminating the COVID-19 threats, these routes will be actively used. The emergence of alternative delivery routes makes it urgent to return to solving optimization problems of route selection. The development of simple algorithms for artificial intelligence makes the task in demand for large fish products suppliers and for owners of storage tanks in hubs when making decisions to improve business processes. The use of existing linear programming algorithms for this purpose, a transport problem with intermediate points in particular, encounters a number of obstacles that make the calculation procedures cumbersome and inconvenient for current planning. Particularly, there are restrictions on the availability of refrigerated containers, lack of storage space during peak delivery periods, discrete dispatch to one recipient, and a number of more insignificant factors.
However, this problem can be reduced to a network problem after some modification. And then one can go to the tools of dynamic programming. The essence of the problem is to find interconnected movements along the transport network, which together give the minimum costs for the movement and temporary storage of a fish products batch from the fishing area to the consumer’s warehouse (the shortest path network problem). The network is built of nodes and arcs connecting the nodes. The node corresponds to the place of fish products transshipment from one type of transport to another, or to the storage areas of the terminals. An arc is a route section between two nodes, which coincides with any transport artery of the region, and is evaluated by the cost value of passing this route section.
The cost value at each route section depends on the fish products storage time at intermediate distribution refrigerators (or warehouses and sites), tariffs for loading and unloading operations, and transportation costs by sea and land. Thus, the network will be composed of arcs of several types, differing from each other in the ways of generating costs. The first type of arches is arches, which include the costs of transporting fish products from the point of reception at sea to the berth of the marine terminal. The second type is arcs with transportation costs by rail from one warehouse complex (or terminal) to any other. The third type is arcs with transportation costs by road from one warehouse complex (or terminal) to any other. The fourth type is arches with costs of loading and unloading operations, registration, and storage of fish products in the storage tanks of one terminal. On the network diagram, such an arc is indicated by the section Point X (T) - Point X (T).
To reduce storage costs, it is possible to enter into the network of regional distribution hubs, close to the warehouses of the final recipients of fish products. The expediency is associated with a significant difference in tariffs for storage of goods in the Far Eastern warehouses and warehouse complexes of the Siberian and central regions. The choice of the geographical area for the location of the distribution hub is influenced by the amount of cargo traffic to nearby territories, the frequency of fish products deliveries, the availability of storage tanks. The criterion for choosing is the minimum cost of storing and transporting fish products to the adjacent regions.
where:
– storage cost of a conditional ton of fish products at point i, rubles / ton.
Q - freight traffic to the selected federal district, tons.
– freight traffic to the geographical area of the federal district with the proposed distribution center, tons.
- tariff for 1 ton transportation from point i to point j, rubles / t-km.
- the volume of transport work when carrying goods from point i to point j, t-km.
For the network formed in this way, one uses the shortest path algorithm [1], making the choice of the route in the form (2):
- a less costly route from the point of receiving fish products at sea to node j.
– cost value of the cargo being on the arc connecting nodes i and j.
At each step, the least costly route to the previous node i is chosen plus the cost value of the cargo being on the arc connecting nodes i and j. The iterations are repeated until the calculation reaches the end node corresponding to the consumer’s warehouse. Minimizing supply chain costs by regulating the leverage of supply and lease of storage distribution terminals will affect the seafood supply management strategy.
To Know More About Oceanography & Fisheries Open Access Journal Please click on: https://juniperpublishers.com/ofoaj/index.php
For more Open Access Journals in Juniper Publishers please click on: https://juniperpublishers.com/index.php
0 notes
Text
Analysis of Classic Supercell Storm by SVVP Method in Northwest Part of Fujian on 5 March 2010
Authored by: Yongjiang Yu
Abstract
Using the environment physical field, the CINRAD/SA data of Jianyang and the step velocity volume processing method, the hail processes of a classic supercell storm in the northwest part of Fujian Province in China on March 5, 2010, are analyzed. The result shows that the vertical structure of upper dry and lower wet , strong vertical wind shear, positive vorticity in middle-upper levels and mesoscale low pressure in surface provided the suitable dynamic conditions environmental for the classic supercell storm. The appearance of bounded weak echo regions (BWER), lower-level hook echo and three-body scatter spike can be served as hail features of supercell on weather radar echo images. The cyclonic convergence in low levels is important indicator in the initial and developing stages of the hailstorm system.
Keywords: Supercell; SVVP; Horizontal circulation
Introduction
A series of severe convective storms, which caused a large range of hail thunderstorm and strong wind in Nanping and Sanming cities, occurred in the northwest of Fujian Province of China March 5, 2010. Hail with a maximum diameter of 5cm appeared in Shaowu and Mingxi, and a strong wind of 22 m/s appeared in Sanming. These severe convective storms with large impact range and long-life cycle were very rare and had brought huge losses to the local area. Severe convective weather such as hail was highly destructive and high difficulty in weather forecast [1]. The study of Doppler radar two-dimensional wind vector field structure combined with the analysis of radar echoes could guide hail forecast. Hence, conventional observation data and the SVVP (step velocity volume processing) method base on single Doppler radar data were used to analyze these hail processes, in order to improve the early warning of hail.
Analysis of the Weather Situation
At 08:00 on March 5, 2010 (Beijing Time, the same below), there was a Southwest high-altitude jet greater than 32m/s between South Branch trough and subtropical anticyclone of the 500hPa, and Fujian Province was located in forepart of the southwest jet in front of the South Branch trough. There was a mesoscale low pressure caused by the development of ground inverted trough in the north of Fujian Province, the hail area was located in jet region of the 850hPa(≥20m/s). At the same time, the temperature near the surface increased in the past 24 hours. In terms of humidity conditions, Nanping and Sanming cities were in the wet advection zone, which the difference of dew-point temperature was between 1 and 2 ℃ in 850hpa, between 4 and 8℃ in 700hpa, but were in the dry advection zone(> 12 ℃) in 500hPa [2].
Based on the sounding of Shaowu station at 08:00, it can be found that an inversion layer (dry and warm cover) appeared in the lower troposphere (884hpa), which was conducive to the development of deep convection. With the rise of temperature and the approach of the ground cold front in the afternoon, the Convective Available Potential Energy (CAPE) reached 1535J/kg, and the vertical wind shear (39m/s) was obvious [2]. At the same time, the height of 0℃ and -20℃ was 4.0km and 7.1km respectively, which reached the index threshold of hail. The vertical structure of upper dry and lower wet, strong vertical wind shear, positive vorticity in middle-upper levels and mesoscale low pressure in surface provided the better environmental conditions for the supper-cell storm.
Analysis of the Radar Data
Evolution of Radar Echoes
The storm always maintained the relative isolated state and life-history was 4h 52 min, the storm’s average speed was 75 km/h and the storm was a high centroid convective system. During the mature stage (15:57-18:47) the storm maintained the classic supercell characteristics of the moderate intensity or more mesocyclone, the correlative bounded weak echo regions (BWER), lower-level hook echo and three body scatter spike appeared in middle upper levels (Figure 1). Moreover, it came through three times peak development, the mesocyclone of the storm enhanced and stretched to the ground in the peak period. Between 16:52 and 17:17 (Figure 2), the storm appeared the phenomenon of updating lower-level hook echo and disappearing of BWER, these evolving features were in accordance with the model of tornadoarising supercell [3]. Between 17:41 and 18:47 (Figure 3), the storm came up the similar evolving feature but the more typical is the mesocyclone came to occlusion at last, and then the storm formed vortex-echo which lasted half hour. Besides, between 16:03 and 17:17 the gust front echo appeared in the left front of the storm several times rather than right backward, which was favorable for lasting of the storm[3].
Analysis of Horizontal Wind by SVVP
In this paper, an improved VVP (velocity volume processing) method, SVVP (step VVP) method, was used to analyze horizontal circulation and the divergence and vorticity, in the initial and developing stages of the hailstorm system. The SVVP method gets rid of the problem of an ill-conditioned matrix and many kinematic variables can be estimated for mesoscale and smallscale convective systems when smaller analysis volumes are needed. The SVVP method is effective in application and has a much higher accuracy. It has the potential ability to forecast the supercell storm and is beneficial to decrease the loss of hail disaster [4].
In the afternoon of March 5, 2010, some strong echo of convective weather appeared on the Doppler radar image in the northwestern of Fujian province. It can be seen from Figure 4 that some organized convective cells appear in Nanping and Sanming areas in Northwest Fujian at 16:22. These strong convective cells might develop into super-cell storm with hail and gales and thunder. Figure 4 shows Convective storms can be divided into two parts, one is located in the west of Jianyang radar station (Part A), and the other is in the northeast of Jianyang radar station (Part B). The structure of convective storms A was compact, and the reflectivity was more than 50 dBz with small scale. The structure of convective storms B was loose with multiple echo centers.
The two-dimensional wind vectors at 5 km above the ground level retrieved by SVVP are illustrated in Figure 6. Southwest winds dominate in the whole wind retrieval area. Southeast airflow enters into the convective storms of part A in the Southeast and turns to become northwest wind cyclonically. West airflow enters into the convective storms of part B in the northwest and turns to become southwest wind anti-cyclonically, while southeast winds enter the south and turn to become southwest winds cyclonically. It can be seen from Figure 5 and Figure 6 the cyclonic circulation existed in lower levels is conducive to the development of convective storms in part A, the shear of horizontal wind promotes the development of convective storms in part B.
Conclusion
We analyzed the hail processes of a classic supercell storm in Fujian Province of China on March 5, 2010. The following conclusions can be drawn:
• The dry and warm lid, strong vertical wind shear, positive vorticity in middle-upper levels and mesoscale low pressure in surface provided the better environmental conditions for the hailstorm.
• The appearance of BWER, lower-level hook echo and three-body scatter spike can be served as hail features of supercell on weather radar echo images.
The cyclonic convergence in low levels is important indicator in the initial and developing stages of the hailstorm system.
0 notes
Text
First Record of the Ocean Sunfish, Mola alexandrini (Ranzani 1839), (Tetraodontiformes: Molidae) from the Coastal Waters of Andhra Pradesh, India

Authored by: P Padmavathi
Abstract
Mola alexandrine, commonly known as bump-head sunfish has been reported for the first time from Andhra Pradesh coastal waters. A detailed morphological description of the specimen is provided, and the morphometric and meristic data are compared with those of the same species reported by earlier workers. Historical records of the family Molidae from Indian waters are summarized and discussed.
Keywords: First record; Mola alexandrine; Morphometrics and meristics; Ocean sunfish
Introduction
The ocean sunfishes belonging to the family Molidae are composed of three genera (Ranzania, Masturus and Mola) with five valid species viz., Ranzania laevis (Pennant 1776), Masturus lanceolatus (Lienard 1840), Mola mola (Linnaeus 1758), Mola tecta (Nyegaard et al. 2017) and Mola alexandrini (Ranzani 1839) [1-4]. Family Molidae is monophyletic among highly derived order Tetraodontiformes [5] and characterized by distinctly-shaped body by the lack of true caudal fin, which is replaced by a broad stiff lobe, a pseudo-caudal fin called clavus [6]. These fishes are known to be active swimmers and opportunistic foragers in the pelagic waters of both temperate and tropical oceans [7-9]. The occurrence of ocean sunfishes is rare from Indian coastal waters [10]. However, the presence of some molds has been reported in new areas [11] and previously known distribution ranges are being expanded [12]. These fishes occupy a unique position in marine food web [13,14]. The consumption of these oddly species has not been attracted the folk’s attention due to their rare occurrence and lack of information on their nutritional aspects. However, the meat of the ocean sunfishes is reported to be delicious in Taiwan and Japan [15].
The bump-head sunfish, Mola alexandrini (Ranzani 1839) is a large pelagic species which claimed a record of world’s heaviest teleost fish with a weight of 2,300 kg with 272 cm TL [16]. However, this fish may grow even larger [17]. Sawai et al. [16] found Mola alexandrini (Ranzani 1839) to be synonymous with Mola ramsayi (Giglioli 1883). The present study reports the first record of M. alexandrini from the coastal waters of Andhra Pradesh, India, and an attempt was made to compare the morphological, morphometric, and meristic characters among the known records of the species. The historical records of the family Molidae from the Indian coastal waters are provided and discussed.
Materials and Methods
One specimen of M. alexandrini was collected as by-catch from trawl catches of Kakinada fishing harbor (16° 58′ 30″ N, 82° 16′ 44″ E), East Godavari district, Andhra Pradesh, India (Figure 1). The fish was caught from commercial trawler operated at a depth range of 20-100m on 11th December 2018. The morphological characters were observed in fresh specimen. Morphometric and meristic details were recorded using the standard methods of Fraser-Brunner [6] and Whitley [18]. The species was identified based on the description given by Fraser-Brunner [6]; Sawai et al. [16]; Yosita et al. [17]; Nyegaard et al. [19]. Morphometric measurements were taken as straight-line distances (±1mm) using a 500 cm tape with 1mm gradation.
They included the total length (TL), a linear distance from the tip of the snout to the distal edge of the clavus; pre-clavus band length (PCBL), the straight distance from the tip of snout to the origin of clavus; total body depth (TBD), a linear length between dorsal fin and anal fin tips; body depth (BD), vertical distance between the dorsal and ventral margin of the body where the height is greatest; eye diameter (ED), the distance between the anterior and posterior edges of the orbit; pre-orbital length (POL), the distance between the tip of snout to the origin of eye orbit; pre-dorsal length (PDL), a straight distance from the tip of the snout to the anterior edge of dorsal fin; pre-pectoral length (PPCL), measured from the tip of snout to the anterior end of the pectoral fin; pre-anal length (PAL), a straight distance from the tip of the snout to the anterior end of the anal fin; height of dorsal fin (DFH), the vertical distance from the base to the tip of the dorsal fin; height of anal fin (AFH), the vertical distance from the base to the tip of the anal fin; and length of pectoral fin (PCFL), measured between its origin to the extreme tip. Meristic characteristics included the counts of fin rays in dorsal, pectoral, and anal fins, and clavus ossicles.
Results
Taxonomic position
• Phylum: Chordata
• Class: Actinopterygii
• Order: Tetraodontiformes Berg, 1940
• Family: Molidae Bonaparte, 1835
• Genus: Mola Koelreuter, 1766
• Species: M. alexandrini (Ranzani 1839).
Description
Body orbicular, deep and laterally compressed; skin thick and leathery; scales rectangular; mouth small and terminal; teeth on both jaws fused and beak-like; eyes small; pair of small nostrils in front of eyes; head bump extends from above the eyes to the base of dorsal fin; chin bump from beneath the lower jaw to anal fin base; gill openings small and oval; dorsal and anal fins opposite and triangle shaped; fins with soft rays and spineless; pelvic and caudal fins absent; caudal fin replaced by broad clavus with round margin; smooth band at the base of clavus between dorsal and anal fins; pectoral fin small rounded. Body gray to silvery white dorsally, dusky white ventrally, dorsal and clavus region with reddish brown tinge; fins bluish black, and many irregular paler spots over the body (Figures 2 & 3). The morphometric and meristic characters of the present specimen along with those of earlier works on M. alexandrini are shown in Table 1.
Discussion
The homogeneity in the morphological characters of Mola has created confusion in the species identification. However, the major distinguishing characters for the identification of Mola species are the presence or absence of head bump, chin bump and smooth band back-fold at the base of clavus; shape of the clavus margin; number of fin rays and ossicles in clavus; and the shape of the body scales [6,16,17,19-22]. The diagnostic characters of M. alexandrini observed in the present study such as the presence of head and chin bumps; smooth band at the base of clavus without a back-fold; rounded clavus; 12 clavus ossicles; scales rectangular on middle region of body and paler spots over the body are in conformity with those observed by the earlier workers [6,16,19].
The historical records of the family Molidae for over 65 years (1953-2018) from Indian coastal waters have been presented in Table 2. Based on the historical data, the distribution of the family Molidae in Indian waters is restricted to four species namely M. mola, M. lanceolatus, R. laveis, and M. alexandrini. Of these, M. mola [23] and M. lanceolatus [24] have been reported from coastal waters of Andhra Pradesh. M. alexandrini was reported in Indian waters with the rare occurrence of two records, one from Chennai, Tamil Nadu by Mohan et al. [21] and the other from Kochi, Kerala by Kishor et al. [20]. Hence, it is evident that the current reporting of M. alexandrini is the 3rd record from India and the first ever report from Andhra Pradesh.
In Indian coastal waters, the ocean sunfishes are considered as vagrant species, with only few sporadic sightings. Since 1990’s, however, there has been a considerable increase in the frequency of molids observed in Indian waters [25-30] (Table 2). The occurrence of M. alexandrini in the study area might be due to the fact that the species which are weak may get drifted to the coastal waters by strong currents or in course of chasing specific plankton/diatoms, as they are opportunistic foragers and selective feeders [3,5,13]. Moreover, in recent times there has been a massive development of fisheries and upgraded fishing vessels extended their trawling operations into deeper waters, catching more varieties of fishes in the study region [31-35]. The present report of the species from Andhra Pradesh coastal waters along central east coast of India would help in creating new awareness and scope for the proper documentation of data on this deficient species from the Indian waters [36-47].
N- Number of individuals; TL- Total length; TW- Total weight
To Know More About Oceanography & Fisheries Open Access Journal Please click on: https://juniperpublishers.com/ofoaj/index.php
For more Open Access Journals in Juniper Publishers please click on: https://juniperpublishers.com/index.php
0 notes
Text
Unique Oxbow Wetlands in Assam, India

Authored by: Devashish Kar
Introduction
The water bodies under `Lentic’ category is said to form the `Standing water series’. Although the name is `standing water’ the water in such bodies is in motion in different ways. Hence, `standing water’ does not necessarily mean `static’. It simply means that water does not flow [1-3]. Until recently, many naturalists, including biologists, thought the lentic bodies (wetlands, lakes, etc.) to be much the same wherever they occur; because similarities are often found among different kinds of lentic bodies about their physico-chemical and biological features. Although a partial survival of this idea is still prevalent among many laymen; with the advent of limnology, it has been established that, lentic bodies as a class, manifest a most amazing physico-chemical and biological diversity. Further, as a partial indication of lentic bodies diversity, it could well be stated that lentic bodies could be large, medium or small; deep or shallow; protected or unprotected; with or without inlets and, outlets; fresh, brackish or salt; acidic, neutral or alkaline; hard, medium or soft; turbid or clear; surrounded by bogs, swamps, forest or open shore; high or low in dissolved content; with or without stagnant zones; with marl, muck, sand or clay bottoms; with or without vegetation beds; with high, medium or low biological productivity; young, mature or senescent; and, so on.
However, there could exist many imaginable intergrades within the various groups of characters mentioned above. The remarkable lentic bodies diversity is said to be the effect of multitudinous combinations of many of these characteristics mentioned above. In this connection, in contrast to a `lake’, a `wetland’ is a kind of lentic body whose depth generally does not exceed 6 m [1-3]. Standing waters occur in depressions or in basins, which are doomed from the moment they are formed. Eroded sediments and plant remain from the surrounding land are washed-in and settle at the bottom along with debris from the resident aquatic plants and animals. Gradually, the lake could get shallower until it becomes a `wetland’. Wetlands are, thus, basically `wet- lands’ where the soil is saturated with water for some time during the year. According to IUCN (1970), wetlands are areas of marsh, fen, etc., temporary, or permanent; natural or artificial mass of water, the depth of which generally does not exceed 6 m. Wetlands are areas which contain substantive amount of standing water and little flow.
Concomitant to above, a FW lake is a closed water body of FW which is surrounded by land on all sides. An oxbow type of lentic body (lake/wetland) is created when a river changes its course leading to isolation of a segment of the said river. A pond is a body of standing water which is too small to have a wave-swept beach. Swamps are wetlands with trees. Bogs and fens are vegetated low-lying areas. Bogs have outlets were water from rain runoff and springs flow away. Fens are basins fed by upwelling ground water. Marshes are usually wetlands dominated by a few species of plants, e.g., Cyperus, Scirpus, Echinochloa, Cynodon, etc.
Origin and Evolution of Wetlands
In the tropics, notably in India and in adjoining places, like Bangladesh, etc., wetlands are generally shallow depressions which could normally be in the form of a basin at the centre of hillocks on all sides; or could be abandoned segment of a river (oxbow wetland); or a shallow portion of a river course which is detached from the main river course during the dry season. Sometimes, wetlands in NE India, are formed due to tectonic activities. Further, some wetlands are small kettle holes; others are in the last stages of `succession’ which is triggered when aquatic plants produce organic matter faster than decomposing organisms can re-cycle it. The remains of the plant bodies gradually accumulate until no open water remains. In Assam, and in adjoining Tripura and Bangladesh, 3 kinds of wetlands are generally found. They are locally called as follows [1-3]:
• `Beel’: Perennial wetlands which contain water throughout the year.
• `Haor’ : Seasonal wetlands which contain water only for some period of the year, particularly, during the rainy season. As such, they are also called `floodplain wetlands’.
• `Anua’ : These are peculiar river-formed perennial oxbow-type wetlands which are generally formed due to change in river course and which may or may not retain connection with the original river.
Wetlands in North-East India
The North-Eastern (NE) region of India, a typically difficult topography with undulating terrains, however, provides enough potential for fish production which can supplement food requirement for the region and could provide answer to diminishing protein supply. Situated between 89-97 N Longitude and 20-30 E Latitude, the region encompasses a vast area of 2,55,083 sq. km out of total Indian area of 3.3. million sq. km. Comprising of eight provinces, viz., Arunachal Pradesh, Assam, Manipur, Meghalaya, Mizoram, Nagaland, Tripura, and Sikkim. The lofty Himalayas proudly stands as sentinels to guard the northern and eastern frontiers. The Chittagong Hill tracts form a crescent on the south. The region’s western mountains suddenly rise from the valleys in Bangladesh, leaving only a narrow strip which opens out to the Indian mainland.
The NE region of India displays diversities regarding topography, water resources, biota, climate, race, language, and culture; and the region harbours >100 tribes differing ethnologically yet sharing a common destiny. Besides lotic territories, the lentic water bodies having 0.72 x 10⁶ ha lake coverage in India, constitute great potential of fishery resources. The NE region is blessed with several lentic systems, locally called `Beel, Haor, Anua, Hola, Doloni, Jalah, etc., which alone constitute c 81 % of the total lentic area (0.12 x 10⁶ ha) in Assam. These lentic systems are generally shallow and open, ranging in size from 35 to 3458.12 ha and with depth ranging from 0.25 to 3.0 m (in some, however, the maximum depth may exceed 6.0 m) at LSL. Further, in Assam, there are c 1392 number of wetlands having a total of c 22,896 number of fisheries of different categories; out of which, the number of registered wetlands is only 394 (30.38 %) covering an area of c 70,000 ha; of which, c 19,000 ha is in good condition; c 15,000 ha is in semi-derelict condition and c 35,000 ha is in derelict condition [1-3].
Out of the total of 1392 wetlands in Assam, there are 290 oxbow wetlands (`Anua’) covering an area of 5, 460.60 ha which constitutes approx.0.10 % of the total geographical area of the State and 9.27 % of the total area under wetlands. The smallest of them measures 5.0 ha while the largest one has 582.50 ha of water spread area. Highest number of oxbow wetlands are observed in Golaghat district (104) followed by Nagaon district (71) and Dhubri district (68). Maximum area of oxbow wetlands is in Morigaon district (2143.00 ha) followed by Nagaon (1746.00 ha) and Golaghat (1563.00 ha) districts. Some of the important wetlands under this category are Morikolong and Patoli beel in Nagaon district, Mer beel in Golaghat district and Guruajan in Morigaon district, the Anuas in Cachar district, etc. [1-3].
The Anuas
The `Anua’ (river-formed oxbow wetland) could be potential water bodies for pisciculture and aqua-sports. Some of the significant Anua are Baskandi Anua, Silghat Anua, Algapur Anua, Dungripar Anua, Satkarakandi Anua, Ramnagar Anua, Salchapra Anua, Fulbari Anua and Shibnarayanpur Anua [1-3]. An account of some of these is briefly given below:
Satkarakandi Anua
Satkarakandi Anua (92o 52’41.6” E and 24o 45’8.9” N; altitude, 20.73 m MSL) lies in the Sonai Revenue Circle in the Cachar district of Assam. The wetland is situated at c 15.5 km away from Silchar city. River Barak flows towards the northern side of the wetland. The villages Satkarakandi and Dhanehary are situated on the eastern shore of the Anua. The villages Barahali and Satkarakandirpar are situated towards the south and west of the wetland. The NE and western shores of the Anua are protected by earthen embankments about 4 m in height as a preventive measure against flood. The maximum L and B of the wetland were found to be c 1.75 km and 0.3 km respectively. The Anua was found to have an average depth of c 3.0 m at FSL. During monsoon, the Anua establishes connection with the river Barak through a channel on the northern side of the wetland which is, however, guarded by a sluice gate as a flood-mitigation measure.
The wetland was found to exhibit interesting trends in its physicochemical features of water. The average values of physico-chemical parameters of water were found to be, water temperature 26 oC, Turbidity 25.5. NTU, pH 5.7, DO 4.95 mg/l, FCO2 45.0 mg/l, TA 101 mg/l, conductivity 49 μ mhos/cm., PO4 0.406 mg/l, NO3 0.32 mg/l (Table 1). This wetland is a victim of acute eutrophication being infested by luxuriant population of Eichhornia crassipes. Other forms of Aquatic Macrophytes (AM) include Lemna minor, Eleocharis acutangula, Scripus eriophorum, Salvinia cucullata, Azolla pinnata, Ipomoea aquatica, etc. The following genera/species of phytoplankton generally occur in this wetland, viz., Nostoc, Oscillatoria, Anabaena, Microscysis, Ankistrodesmus, Chlorella, Closterium, Euglena, Ceratium, Cosmarium, Pinnularia, Navicula, etc.
Studies revealed the occurrence of following genera/species of zooplankton: Arcella sp., Brachionus sp., Lecane sp., Keratella sp., Filinia sp., Trichocerca sp., Daphnia sp., Moina sp., Alona sp., Chydorus sp., Dadaya sp., Cyclops sp., Diaptomus sp., etc. Fish diversity recorded 32 valid ichthyospecies belonging to 16 families and 8 orders. Some of the fish species are Notopterus notopterus, Gudusia chapra, Salmophasia bacaila, Amblypharyngodon mola, Osteobrama cotio cotio, Puntius chola, P. conchonius, P. ticto, Botia dario, Mystus cavasius, M. vittatus, Ompok bimaculatus, Wallago attu, Clarias batrachus, Heteropneustes fossilis, Anabas testudineus, Xenentodon cancila, Channa punctatus, Trichogaster fasciatus, Chanda nama, Mastacembelus armatus, Macrognatus pancalus, M. aculeatus, etc.
Fish Yield (FY) as Total landing of fish ranged from c 140-425 kg/ year; while the average annual fish landing was 255.44 kg. Gudusia chapra showed maximum fish yield (c 78 % of the total yield) followed by Puntius ticto (c 12 % of the total yield). The management aspects of Satkarakandi wetland revealed that the wetland suffers from various problems, like overgrowth of aquatic weeds, closure of feeding channels, unsustained fishing, addition of domestic sewage, etc. These could be overcome by certain steps, like deweeding, opening of the feeding canals, sustained fishing, etc.
Baskandi Anua
This oxbow wetland (24o 48’ 36” N and 92o 55’ 22.7” E) lies in the Lakhipur Sub-division of Cachar district in Assam. It is said to have been formed due to change of course of the River Barak [1- 3]. The Anua is situated near the Manipur range of hills. Towards the east, lies the Manipur valley while the Silchar sub-division is situated in the west. The North Cachar Hills is situated towards the north and the province of Mizoram lies towards the south. The catchment soil is found to be mainly sandy loam. Rain is the main source of water for the Anua. This oxbow wetland also receives water from the surrounding catchment having human habitation. The catchment vegetation includes herbs, shrubs and trees including a lot of bamboos.
Baskandi Anua is situated about 20 km away from Silchar city along the NH 53 which connects Silchar with Imphal. The Silchar- Jiribam (Manipur) railway line passes near the wetland. The Rural Development Block HQ is at Baskandi. The length (L), breadth (B) and area (A) of Baskandi Anua respectively are 2.230 km, 205 m and 39.2 ha at FSL and 2.090 km, 190 m and 36.7 ha at DSL. The wetland basin tends to be deeper towards the southern side as compared to the northern. The Anua exhibits variable water level ranging from 0.25 m to 5.85 m at FSL (Jun-Sep) and from 0.14 m to 4.12 m at DSL (Oct-Apr). 16 AM species have been recorded in Baskandi Anua. They belong to 6 free-floating (Azolla pinnata, Eichhornia crassipes, Salvinia cucullata, Lemna minor, Pistia stratiotes, Wolfia sp); 2 rooted submerged (Hydrilla verticillata, Vallisneria spiralis); 6 rooted with floating leaves (Nymphaea nouchali, Nymphoides indicum, N.cristatum, Trapa bispinosa, Euryale ferox, Nelumbo nucifera); and 2 rooted emergent (Jussiaea repens, Muradania nudiflora). Of these, 6 AM species were found to occur throughout the year. These are Azolla pinnata, Eichhornia crassipes, Salvinia cucullata, Trapa bispinosa and Jussiaea repens.
It has been observed that the AM start their seasonal cycle from the germination period in winter while emerging to a vegetative stage in summer and then to monsoon. This was followed by the flowering and fruiting during late monsoon and post-monsoon. Studies revealed wet AM biomass to be ranging from 4.4 to 11.4 kg/m2. Wet biomass was observed to be higher during monsoon and post-monsoon reaching trough value during winter with a concomitant increasing trend during summer. Significant positive correlation of AM biomass with water temperature (r= 0.1820) has been recorded during the study period. Incidentally Baskandi Anua revealed usual values of Physico-chemical parameters of water (Table 1).
Studies revealed the occurrence of 49 forms of phytoplankton belonging to 48 genera under 26 families, 11 orders and 6 classes. The sequential analysis of abundance of phytoplanktonic groups, generally revealed Chlorophyceae (43.51 %) > Myxophyceae (34.78 %) > Bacillariophyceae (15.58 %) > Dinophyceae (4.47 %) > Euglenophyceae (1.14 %) > Chrysophyceae (0.52 %). Some of the abundant forms of phytoplankton are Microcystis aeruginosa, Anabaena, Notoc, Oscillatoria, Chlorella, Volvox, Ankistrodesmus, Closterium, Cosmarium, Ceratium, Euglena, Phacus, Spirogyra, Diatoma, Fragillaria, Synedra, Gyrosigma, Navicula, Pinnularia, etc.
Studies revealed the occurrence of 33 forms of zooplankton belonging to 22 genera under 17 families, 7 orders and 4 classes. The sequential analysis of abundance of zooplanktonic groups, generally revealed Rotifera (64.41 %) > Copepoda (25.14 %) > Protozoa (7.34 %) > Cladocera (3.11 %). Some of the abundant zooplankton forms are Arcella, Centropyxis, Brachionus, Keratella, Lecane, Trichocerca, Filinia, Daphnia, Ceriodaphnia, Simocephalus, Moina, Bosmina, Bosminopsis, Macrothrix, Alona, Pleuroxus, Chydorus, Dadaya, Cyclops, Diaptomus, etc.
13 species of fishes belonging to 10 genera, 6 families and 4 orders have been recorded in Baskandi Anua, viz., Channa striata, Glossogobius giuris, Channa punctata, Gudusia chapra, Macrognathus aral, M. pancalus, Salmophasia bacaila, Badis badis, Chanda ranga, Puntius ticto, Rasbora daniconius, Amblypharyngodon mola, Puntius conchonius (Table 2). Gudusia chapra depicted the highest fish yield (c 75% of the total yield) followed by Puntius, Mystus, Amblypharyngodon, etc. The yield has since declined during the decade beginning 2000 AD with Gudusia chapra showing depleting trend.
Sibnarayanpur Anua
Sibnarayanpur Anua (24o 52’ 51.8” N and 92o 38’ 1.6” E) is an oxbow wetland which is situated at c 32 km from Silchar city. It lies within Katigora Revenue Circle in Cachar district of Assam. It has a L, B and A of c 1.7 km, 0.7 km and 53 ha respectively. The catchment soil is mostly loamy. At present, it seems to have a connection with river Banaimulla. Riparian vegetation is scanty. Riparian land use pattern involves human habitation, fishing, etc. The water of this anua displayed usual values of limnological parameters of its water (Table 1). AM included Azolla pinnata, Cynodon dactylon, Echinochloa stagnina, Eichhornia crassipes, Eleocharis acutangula, Hygrorhiza aristata, Ipomoea aquatica, Jussiaea repens, Nymphaea nouchali, Nymphoides cristatum, Nymphoides indicum, Oryza sativa, Salvinia cucullata, Trapa bispinosa, Vetiveria zizanoides, Polygonum flaccidum, Pistia sp.
Plankton Consisted of forms like Anabaena sp., Oscillatoria sp., Microcystis aeruginosa, Euglena sp., Ankistrodesmus sp., Cosmarium granatum., Volvox sp., Diatoma sp., Fragilaria sp., Gyrosigma sp., Synedra sp., Pinnularia sp., Navicula sp., Arcella sp., Brachionus sp., Keratella sp., Lecane sp., Trichocerca sp., Filinia sp., Daphnia sp., Alona sp., Bosmina sp., Bosminopsis sp., Chydorus sp., Simocephalus sp., Cyclops sp., Diaptomus sp. Fish diversity portrayed by 22 species of fishes belonging to 21 genera, 10 families and 5 orders. The have been recorded in Sibnarayanpur Anua were Gudusia chapra, Securicula gora, Salmophasia bacaila, Cirrhinus cirrhosus, Chela laubuca, Esomus danricus, Labeo rohita, Labeo gonius,Puntius ticto, P. conchonius, Catla catla, Osteobrama cotio, Rita rita,Clupisoma garua, Eutropiichthys vacha, Clarias batrachus, Xenentodon cancila, Monopterus cuchia, Macrognathus pancalus, Mastacembelus armatus,Chanda nama, Badis badis (Table 2). Gudusia chapra usually depicted the maximum fish yield (c 66.3 % of the total yield) followed by Salmophasia bacaila (c 27.2%).
Fulbari Anua
Fulbari Anua (24o 51’ 16.5” N and 92o 39’ 11.9” E) is an oxbow wetland which is situated at c 46 km from Silchar city. It lies within Katigora Revenue Circle in Cachar district of Assam. The catchment soil is mostly loamy. Riparian vegetation is scanty. Riparian land use pattern involves human habitation, fishing, etc. AM included Cynodon dactylon, Eichhornia crassipes, Hydrilla verticillata, Hygrorhiza aristata, Ipomoea aquatica, Jussiaea repens, Nymphaea nouchali, Nymphoides cristatum, Nymphoides indicum, Salvinia cucullata, Trapa bispinosa, Polygonum flaccidum, Pistia sp. Nevertheless, the water of this Oxbow wetland portrayed usual values of ecological parameters.
Plankton consisted of forms like Nostoc sp., Anabaena sp., Microcystis aeruginosa, Euglena sp., Ankistrodesmus sp., Cosmarium granatum., Staursastrum sp., Volvox sp. Ceratium sp., Diatoma sp., Fragilaria sp. Gyrosigma sp., Synedra sp., Pinnularia sp., Navicula sp., Arcella sp., Brachionus sp., Keratella sp., Lecane sp., Trichocerca sp., Filinia sp., Daphnia sp., Ceriodaphnia sp., Alona sp., Bosmina sp., Chydorus sp.,Scapholeberis sp., Simocephalus sp., Cyclops sp., Diaptomus sp. Fish diversity portrayed 7 species of fishes belonging to 6 genera, 6 families and 6 orders, viz., Gudusia chapra, Puntius ticto, .Mystus cavasius, .M. bleekeri, Macrognathus pancalus, Parambassis ranga, Channa punctata (Table 2). Gudusia chapra generally showed maximum fish yield (c 76 % of total yield) followed by Puntius ticto (c 21 %).
Rupairbali Anua
Rupairbali Anua (24o 47’ 7.9” N and 92o 55’ 23.5” E) is an oxbow wetland which is abandoned segment of river Barak situated at c 20 km from Silchar city. It lies within the jurisdiction of Sonai Revenue Circle in Cachar district of Assam. The catchment soil is mostly loamy. AM included Azolla pinnata, Cynodon dactylon, Eichhornia crassipes, Hygrorhiza aristata, Jussiaea repens, Nymphoides cristatum, Salvinia cucullata, Vetiveria zizanoides, Lemna sp. However, the wetland is almost totally choked with Eichhornia crassipes due to very high level of eutrophication.
Plankton included forms like Nostoc sp., Microcystis aeruginosa, Euglena sp., Pinnularia sp., Navicula sp., Arcella sp., Brachionus sp., Daphnia sp., Ceriodaphnia sp., Bosmina sp., Chydorus sp., Cyclops sp., Diaptomus sp. Incidentally, the water of this anua depicted usual values of physico-chemical parameters (Table 1). Fish diversity is portrayed by 24 species of fishes belonging to 21 genera, 15 families and 9 orders have been recorded in this Anua. These are as follows:
Gudusia chapra, Notopterus notopterus,, Amblypharyngodon mola, Labeo gonius, Puntius conchonius, Puntius ticto, Securicula gora, Botia dario, Lepidocephalichthys guntea, Mystus cavasius, Ompok bimaculatus, Xenentodon cancila, Aplocheilus panchax, Parambassis sp., Parambassis ranga, Chanda nama, Badis badis, Oreochromis mossambica, Glossogobius giuris, Anabas testudineus, Trichogaster fasciata, Trichogaster lalius, Macrognathus pancalus, Tetraodon cutcutia (Table 2). Gudusia chapra usually showed the highest fish yield (c 73% of the total yield) followed by Puntius, Badis , Mystus, etc.
Algapur Anua
Algapur Anua (24o 46’ 37.8” N and 92o 53’ 31” E.) is an oxbow wetland, as an abandoned segment of river Barak, is situated at c 18 km from Silchar city. The catchment soil is mostly silty loam. Riparian vegetation is scanty. Riparian land use pattern involves human habitation, fishing, etc. The water of this anua displayed usual values of limnological parameters of its water (Table 1). AM included Alternanthera sessilis, Cynodon dactylon, Eichhornia crassipes, Hydrilla verticillata, Hygrorhiza aristata, Jussiaea repens Nymphaea nouchali, Nymphoides cristatum, Salvinia cucullata, Trapa bispinosa, Polygonum flaccidum, Lemna sp., Pistia sp.
Plankton included forms like Nostoc sp., Spirogyra sp., Microcystis aeruginosa, Euglena sp., Ankistrodesmus sp., Clostridium sp., Cosmarium granatum., Volvox sp., Fragilaria sp., Gyrosigma sp., Synedra sp., Pinnularia sp., Navicula sp., Arcella sp., Brachionus sp., Keratella sp., Lecane sp., Filinia sp., Daphnia sp., Ceriodaphnia sp., Chydorus sp., Macrothrix sp., Cyclops sp., Diaptomus sp.
Fish diversity is depicted by ichthyospecies like Gudusia chapra, Amblypharyngodon mola, Puntius ticto, Botia dario, Lepidocephalichthys guntea, Mystus vittatus, Xenentodon cancila, Channa punctata, Badis badis, Anabas testudineus ,Macrognathus aral, Macrognathus pancalus. Gudusia chapra usually showed maximum Fish yield (c 52 % of the total yield) followed by Puntius ticto (c 18 %).
Silghat Anua
Silghat Anua (24o 47’ 45.5” N and 92o 54’ 27.1” E) is an oxbow wetland which is situated at c 15 km from Silchar city. The catchment soil is mostly loamy. Riparian vegetation is scanty. Riparian land use pattern involves human habitation, fishing, etc. AM included forms like Alternanthera sessilis, Cynodon dactylon, Eichhornia crassipes, Hygrorhiza aristata, Jussiaea repens, Nymphoides indicum, Oryza sativa, Salvinia cucullata, Trapa bispinosa, Polygonum flaccidum, Lemna sp.
Plankton included forms like Nostoc sp., Microcystis aeruginosa, Euglena sp., Ankistrodesmus sp., Cosmarium granatum., Volvox sp. Ceratium sp., Synedra sp., Pinnularia sp., Navicula sp., Arcella sp., Brachionus sp., Keratella sp., Lecane sp., Filinia sp., Daphnia sp., Ceriodaphnia sp., Chydorus sp., Macrothrix sp., Cyclops sp., Diaptomus sp. Incidentally, the water of this anua depicted usual values of physico-chemical parameters.
Fish diversity portrayed by Gudusia chapra, Amblypharyngodon mola, Puntius ticto, Salmophasia bacaila, Mystus vittatus, Channa punctata, Badis badis, Anabas testudineus, Trichogaster lalius, Macrognathus aral.
Gudusia chapra usually showed maximum fish yield (c 59 % of total yield) followed by Puntius ticto (c 26 %).
Dungripar Anua
Dungripar Anua (24o 44’ 40.9” N and 92o 54’ 53.0” E) is an oxbow wetland (also being an abandoned segment of river Barak). It is situated at c 20 km from Silchar city. The catchment soil is mostly loamy. Riparian vegetation is scanty. Riparian land use pattern involves human habitation, fishing, etc. Incidentally, the water of this anua depicted almost a usual pattern of physico-chemical parameters (Table 1). AM included forms like Alternanthera sessilis, Cynodon dactylon, Eichhornia crassipes, Hygrorhiza aristata, Jussiaea repens, Nymphoides indicum, Salvinia cucullata, Trapa bispinosa, Polygonum flaccidum, Lemna sp.
Plankton included forms like Nostoc sp., Microcystis aeruginosa, Euglena sp., Ankistrodesmus sp., Volvox sp. Synedra sp., Pinnularia sp., Navicula sp., Brachionus sp., Keratella sp., Lecane sp., Trichocerca sp., Filinia sp., Daphnia sp., Ceriodaphnia sp., Alona sp., Chydorus sp., Scapholeberis sp., Simocephalus sp., Cyclops sp., Diaptomus sp.
Fish diversity portrayed by Gudusia chapra, Amblypharyngodon mola, Puntius ticto, Salmophasia bacaila, Mystus vittatus, Channa punctata, Badis badis, Trichogaster lalius, Macrognathus aral. Gudusia chapra generally depicted maximum fish yield (c 78 % of the total yield) followed by Puntius ticto (c 12 %), and so on.
Ramnagar Anua
Ramnagar Anua (N 240 49’ 54.2” E 920 45’ 50.7”) is an oxbow wetland which is situated at c 5 km from Silchar city. The catchment soil is mostly loamy. Riparian vegetation is scanty. Riparian land use pattern involves habitation, fishing, etc. It is notable here that, the water of this anua depicted usual values of physico-chemical parameters (Table 1). AM included Alternanthera sessilis, Cynodon dactylon, Eichhornia crassipes, Eleocharis acutangula, Hygrorhiza aristata, Jussiaea repens, Nymphoides indicum, Salvinia cucullata, Trapa bispinosa, Polygonum flaccidum, Lemna sp.
Plankton consisted of forms like Anabaena sp., Oscillatoria sp., Microcystis aeruginosa, Euglena sp., Ankistrodesmus sp., Cosmarium granatum., Volvox sp., Synedra sp., Pinnularia sp., Navicula sp., Arcella sp., Brachionus sp., Keratella sp., Lecane sp., Trichocerca sp., Filinia sp., Alona sp., Chydorus sp., Macrothrix sp., Simocephalus sp. Diaptomus sp.
Fish diversity portrayed by ichthyospecies like Gudusia chapra, Amblypharyngodon mola, Puntius ticto, Salmophasia bacaila, Lepidocephalichthys guntea, Mystus bleekeri, Clarias batrachus, Xenentodon cancila, Channa punctata, Badis badis, Anabas testudineus, Trichogasterlalius, Macrognathus aral, Macrognathus pancalus. Gudusia chapra usually depicted maximum fish yield (c 82 % of total yield) followed by Puntius ticto (c 6 %).
Salchapra Anua
Salchapra Anua (24o 49’ 26.3” N and 92o 39’ 55.5” E) is an oxbow wetland situated at c 18 km from Silchar city. The catchment soil is mostly loamy. Riparian vegetation is scanty. Riparian land use pattern involves human habitation, fishing, etc. Incidentally, the water of this anua depicted usual values of physico-chemical parameters (Table 1). AM included Azolla pinnata, Cynodon dactylon, Eichhornia crassipes, Trapa bispinosa, Oryza sativa, Hydrilla verticillata, Vallisneria spiralis, Nymphoides indicum, Nymphaea nouchali.
Plankton included Nostoc sp., Volvox sp., Gyrosigma sp., Synedra sp., Pinnularia sp., Navicula sp., Centropyxis sp., Brachionus sp., Keratella sp., Lecane sp., Trichocerca sp., Filinia sp., Daphnia sp., Alona sp., Bosmina sp., Cyclops sp., Diaptomus sp.
Fish diversity portrayed by ichthyol species like Gudusia chapra, Amblypharyngodon mola, Puntius chola, Salmophasia bacaila, Mystus vittatus, Badis badis, Anabas testudineus, Trichogaster lalius, Macrognathus aral, Mastacembelus armatus Gudusia chapra usually showed maximum fish yield (c 62 % of the total yield) followed by Puntius (c 18 %).
Discussion
These typical oxbow wetlands (locally called `Anua’) situated in the North-East region of India are unique lentic systems, potentially very much significant for : (a) Aquaculture; (b)Water storage and supply to human habitation; (c) Aqua sports and Aqua tourism; and (d) Flood mitigation (which is sometimes a recurring event in this part of the globe). These potential aquatic systems could also serve as excellent sites of `aquatic sanctuary’ in the event of fast depletion of coveted aquatic biodiversity. The potentials and problems associated with these oxbow wetlands (`Anua’) have been well portrayed in Table 3. Incidentally, the fishes of these oxbow wetlands had since been affected by the hithetto unknown virulent fish disease called the Epizootic Ulcerative Syndrome (EUS), which had been sweeping the freshwater fishes of the earth unhindered, unimpeded, and unabated semi-globally since the 1970s causing colossal loss to the fish biodiversity [4].
To Know More About Oceanography & Fisheries Open Access Journal Please click on: https://juniperpublishers.com/ofoaj/index.php
For more Open Access Journals in Juniper Publishers please click on: https://juniperpublishers.com/index.php
0 notes
Text
Spatial and Temporal Variation of Dissolved Trace Metals from Mexican Caribbean Coast

Authored by: D C Escobedo Urias
Abstract
The concentrations of dissolved trace metals (Fe, Mn, Cr, Cu, Co, Ni, Pb, Zn, Cd, Sr, V, As) were analyzed in 56 water samples from the intertidal zone of the Mexican Caribbean coast during 2019 and 2020. The higher concentrations of dissolved metals (especially Pb, Ni, Cd) in 2019, suggest the influence of anthropogenic inputs mainly related to an intense development of tourism in the region. In 2020, higher variability was observed in the distribution pattern of metals related to the reduction in tourism activity due to the COVID 19 pandemic and the simultaneous enrichment effect from the runoff during the rainy episodes. The generation of anoxic regions in some beaches due to the great accumulation of Sargassum influences the mechanisms of mobilization/enrichment of dissolved metals (especially Ni, Cd). The concentrations of metals showed an increase of two (Ni) to ten times (Pb and As) in the coastal region, which suggests the urgent need for continuous monitoring that supports an adequate management program of the Mexican Caribbean coast.
Keywords: Dissolved trace metals; Tourist beaches; Quintana Roo; Caribbean Sea
Introduction
Beaches are especially tourist dominated regions which is highly dynamic in nature and have different complex system where it often interacts with both land and coastal region. The dynamic beaches often play a major role and act as a bridge between terrestrial and the open marine systems [1,2]. Trace metals often enter to the coastal environment in an array of sources which includes industrial effluents, rainfall runoff, harbor activities, river inputs, tourist activities, land drainage, atmospheric deposition etc. [3]. The continuous anthropogenic pressure of the coastal zone causes various adverse effects such as decrease in water quality and alterations in ecosystem integrity, among others, for which various strategies are carried out to maintain its ecosystem services [4-6].
Riviera Maya is a well-known tourist beaches in Mexico forms part of the “Blue Flag Beaches: Vision 2030” project, which is presently on carried out in some countries around the world. The study aims to create a baseline database in different tourist beaches around the world in the coming decade. Water and sediment of several tourist beaches have already been evaluated for in South Africa (Richards Bay, South Durban, Sodwana Bay & St. Lucia, KwaZulu-Natal Province), India (Chennai Metropolitan City), Miri City, Malaysia, Department of Chocó, Colombia and Acapulco, Santa Rosalia, Loreto, and Huatulco in Mexico [7-17].
The main objective of the present study is to identify the dissolved metal concentrations and the inter elemental relationships in beaches of Cancun-Tulum corridor in the Caribbean Sea region of Mexico. The present results also serve as a first-hand report on dissolved metal concentrations in most important tourists’ region of Quintana Roo in order to understand the sources of contamination and contribute to evolve an adequate coastal management strategy.
Study Area
The study was done during May 2019 and August 2020 to document the concentration pattern of dissolved metals in the tourist beaches in the Mexican Caribbean Sea. The sampling periods of this study were realized during dry season in 2019 and rainy season in 2020 along with the social confinement due to COVID 19 pandemic. It is important to describe an existing nature pressure by the massive arrival of Sargassum which was observed in both years.
Cancun is the highest destination visited by foreign and national’s tourist in Mexico (almost 6.15 million visitors in 2019) with an increasing trend during the last five years. Nearly twenty coastal destinations have been certified as “Blue Flag” beaches (beaches with quality standards assigned by Foundation of Environmental Education [FEE]), and this high-quality standard attracted huge tourist arrivals during the past three decades. However, the region has been severely affected by the arrival of Sargassum species since 2014, a phenomenon that has seriously affected the coastal region of the Mexican Caribbean. During 2019 and 2020 about 38,892 T and 19,054 T respectively were accumulated in this area [18], and this problem is temporarily solved daily for the elimination of Sargassum through manual and mechanical by private and governmental agencies.
The local climate in the region is tropical, where from May to September it is marked as humid and from October to April as dry seasons. The local geology mainly indicates that the Caribbean coast is a carbonate platform composed mainly of limestones, dolomites and evaporites [19]. The Pleistocene limestone and marginal area consist of coral platforms and reefs. In some sites, the karst topographic features with fractures and cave networks (“Cenotes”) that extend up to 12 km inland, frequently have a groundwater discharge to the coast [20-21].
Sampling & Analytical Procedure
The study area is divided into four zones namely: Zone 1 (Z1 - Cancun: samples 1-13); Zone 2 (Z2 - Playa del Carmen: 14 – 31); Zone 3 (Z3 - Tulum: 32 – 42) and Zone 4 (Z4 - Cozumel Island: 43 – 56). The samples were collected in the intertidal region of selected tourist beaches which is occupied by luxurious resorts/ hotels certified as “Blue Flag” beaches and some public beaches (Figure 1). Field parameters pH, conductivity, dissolved oxygen was done directly using the multiparameter Hannah instrument (Model No. HI 9828-25) and the calibration was done using known calibration standards. Samples were collected for dissolved trace metals (1L) in pre-cleaned polyethylene bottles, which was subsequently acidified using high purity HNO3 to a pH of 2 and stored in refrigeration until analysis. Dissolved trace metals Fe, Mn, Cr, Cu, Co, Ni, Pb, Zn, Cd, Sr, V, As and major elements (Ca and Mg) were determined in IPN – CIIEMAD, Mexico using Atomic Absorption Spectrometer (Perkin Elmer Model Analyst 100) following the methods [22,23]. Estimation of as was done using cold vapor technique with hydride generation was utilized. Additionally, known sample solutions were added to all samples to know the recovery percentage of the dissolved metals in seawater. Certified reference material (CRM) (WatRTM Pollution trace metal Lote: P213-500) was used after every 10th sample during the analysis and lanthanum oxides were added to each sample to avoid spectral and non-spectral interferences. The overall precision in the present analysis of dissolved trace metals varied from 93.18 to 107.43% for the analyzed metals.
Calculating water quality index & Statistics
Determination of water quality in terms of metal concentration was done using the Heavy metal evaluation index (HEI) [24] using the formula:
Where Hc is the monitored value of the ith parameter and Hmac is the maximum allowable concentration of the ith parameter The HEI values are classified into three categories: HEI ˂ 400 (Less contamination); 400 – 800 (Medium contamination) and ˃ 800 (High contamination) respectively. Spearman correlation analysis (R-mode) was done for each zone separately using STATISTICA (version 12.0) to analyze the geochemical relationship of dissolved trace metals in the region.
Results and Discussion
Major elements and environmental variables
The results of pH, conductivity and dissolved oxygen showed a similar trend in both monitoring seasons, with a clear influence of the rainy season on conductivity in 2020 (Figure 2a-c). The concentrations and distribution of pH in the region during both years did not indicate any important change, and the lowest values observed in Playa del Carmen (Z2) and Tulum (Z3) are directly related to groundwater discharges through the region which was corroborated by the high association with the other environmental variables mainly during 2019, in addition to the zonal advection and the changes in the surface wind force [25,26]. The conductivity of both years showed a significant variation (2019: Z4 ˃ Z1 ˃ Z2 ˃ Z3; 2020: Z1 ˃ Z2 ˃ Z4 ˃ Z3) with average values of 54.57 and 40.2 mS cm-1 in 2019 and 2020 respectively. The relationship between the environmental variables pH and conductivity did not show significance between them except for the Playa del Carmen region in both years, and the abrupt changes in the conductivity values during both seasons together with the observed values, suggest the control of oxygen in water over the redox potential of seawater [27]. The three-fold increase in conductivity values in 2020 than 2019 infers that rainfall episodic events are all specific features of shallow coastline and freshwater discharge influencing this parameter [28,29].
Dissolved oxygen indicates a variation from 3.91 to 10.51 mg L-1 in 2019 (avg. 7.79) and 2.72 to 9.82 mg L-1 in 2020 (avg. 6.94). Zone wise calculated values indicates that Z2 ˃ Z3 ˃ Z1 ˃ Z4 respectively. The low distribution of DO is directly related to the organic matter degradation/ remineralization in the coastal region as well the terrestrial ground water which is recirculated in sea water [30]. Moreover, the low-oxygen ground water discharges due to the karst topography features present in the region will directly contribute to low oxygen level diluting the DO in coastal bottom waters [31]. The very low value (< 5 mg L-1) in Z2, Z3 is characterized by intermittent discharge of effluents/runoff and moreover heavy presence of the degrading Sargassum species in the coastal regions especially in low tidal areas [32,33].
The distribution of Ca and Mg were similar in both seasons (Figure 2d-e), and their concentrations in 2019 (averages Ca: 346 mg L-1, Mg: 761 mg L-1) and 2020 (average Ca: 400 mg L-1 and Mg: 771 mg L-1) indicate a geogenic origin associated with the dissolution of the carbonate mineral (calcite and magnesite), which is the predominant rural rock in this region and reaches the coast through of groundwater enriched by treated or untreated wastewater [34]. The slightly higher average of Ca observed in 2020 was associated with a higher entry of groundwater and surface water from the runoff during the rainy season and that enriched the coast despite the decrease in the contributions of tourist activity because of the pandemic. Additionally, the large amount of organic matter contributed by Sargassum in both seasons, facilitated the dissolution of these minerals on the coast [35-37].
Dissolved trace metal concentrations (Fe, Mn, Cr, Cu, Ni, Co, Pb, Zn, Cd, Sr, V, As)
The concentration pattern of dissolved trace metals in seawater in the present study is in the following descending order (based on zonal avg.): 2019 Zone 1: Sr ˃ Pb ˃ Ni ˃ Co ˃ Fe ˃ Zn ˃ Cu ˃ V ˃ Cd ˃ Mn ˃ Cr ˃ As; Zone 2: Sr ˃ Pb ˃ Ni ˃ Co ˃ Fe ˃ Zn ˃ Cu ˃ Cd ˃ V ˃ Mn ˃ Cr ˃ As; Zone 3: Pb ˃ Sr ˃ Ni ˃ Co ˃ Fe ˃ Zn ˃ Cu ˃ Cd ˃ Mn ˃ Cr ˃ V and Zone 4: Pb ˃ Ni ˃ Co ˃ Sr ˃ Fe ˃ Cu ˃ Zn ˃ Cd ˃ Mn ˃ Cr ˃ V. Likewise, during 2020 in Zone 1: Sr ˃ Pb ˃ As ˃ Cu ˃ Fe ˃ Ni ˃ Zn ˃ Cd ˃ V ˃ Mn ˃ Co ˃ Cr; Zone 2: Sr ˃ Pb ˃ As ˃ Cu ˃ Fe ˃ Ni ˃ Zn ˃ Co ˃ Cd ˃ V ˃ Mn ˃ Cr; Zone 3: Sr ˃ Pb ˃ Cu ˃ As ˃ Zn Fe ˃ Ni ˃ Mn ˃ Co ˃ Cd ˃ V ˃ Mn ˃ Cr; Zone 3: Sr ˃ Pb ˃ Cu ˃ As ˃ Zn ˃ Fe ˃ Ni ˃ Mn ˃ Co ˃ Cd ˃ V ˃ Cr and Zone 4: Sr ˃ Ni ˃ Pb ˃ Cu ˃ Zn ˃ As ˃ Fe ˃ Co ˃ V ˃ Cd ˃ Mn ˃ Cr respectively (Figures 3,4).
The concentration pattern of dissolved Sr in the region is high compared to other metals, indicating that they are strongly influenced by variations in composition based on the rocks of the continental bed [38]. The high concentrations of Sr in Z1 and Z2 in both periods (1.980 – 16.610 μg L-1) suggest dissolution of the young carbonate rocks, where complex geochemical interactions are generated from the evaporites. This is also supported by the variable mix of groundwater, where carbonates from the oldest Cretaceous or Cenozoic (Cancun and Puerto Morelos) dissolve to release Sr, and in the presence of fracture zone (near Tulum) and sinks closer to the coastal section where entry of submarine groundwater has already been reported [39,40].
Fe and Mn concentrations during 2019 showed a similar distribution pattern and values in all zones (Fe ranges: 0.95- 3.64 mg L-1, Mn: 51-1174 mg L-1), while in 2020 it was observed greater variability with higher concentrations in Cancun and Playa del Carmen and lower in Tulum and Cozumel compared to the previous year (Figure 3a-b). The main source of Fe and Mn in this region is enrichment in groundwater inflow [41]. In 2019, the concentration of these elements had its origin mainly in the use of water from tourist and urban activities [42], which maintained very similar values throughout the region expect some sampling sites (S. No: 14,16,17,18,21,27). During 2020, although there was a reduction in tourism in the region (46%) with simultaneous decrease in anthropogenic sources of Fe and Mn, only in Tulum and Cozumel where this effect was clearly observed. This evident the fact that Cancun and Playa del Carmen have an important residing population (911,503 and 333,800 inhabitants respectively) [43] that endure the anthropogenic contribution of these metals. Additionally, during 2020, the intense rain (62 mm) by tropical storm “Marco” in August [44] which contributes high influx of terrigenous material and enriched groundwater towards the coastal zone.
The dissolved chromium concentrations in the present study indicate a different pattern compared to other metals analyzed (Figure 3c). The Cr distribution presents a higher average in Z1 (0.704 and 0.502) and Z2 (0.560 and 0.444) for 2020 and 2019 respectively. The concentrations obtained in both stations remained high for normal karstic environment, suggesting an enrichment due to anthropogenic activity [42]. In addition, the large amount of organic matter produced by the decomposition of Sargassum accumulated on the coast, especially the ligands result in higher concentration of Cr in solution [45,46]. In 2020, the obtained pattern for Cr indicates that the greater variability of Cr in that year was associated with rainfall in Z1 and Z2.
Ni showed higher concentrations in 2019, associated with its anthropogenic use as a component of paint on fishing boats in the tourist area [42] and others human activities. In 2020, confinement conditions in areas with a lower population result in lower concentrations, while high runoff impose a greater variability in Cancun and Playa del Carmen (Figure 3). Unlike the other dissolved metals, Co concentrations were higher during 2020, which was related to the redox sensitive nature of this element often released in the dissolved phase by decomposed organic material near the interface sediment-water [47,48]. In the area the accumulation of large amounts of Sargassum stimulated this mechanism, in addition, increasing the leaching of these materials because of runoff and the more intense waves during the “Marco” storm.
The highest values of Cu, Ni, Pb in 2019 in zones 1 and 2 are mainly due to the high movement of ferry services, construction and development activities in the region [42]. During 2019, higher concentrations of Pb detected in coastal waters which mainly due to high tourist activity, the use of fuels for local transport (boats, ferries, jet skis, automobiles). The pattern observed during 2020 was determined by runoff events along with decrease in tourist activity and urban activities mainly in Z1 and Z2 (Figure 4). The Zn values in the study region result from enrichment provoked using construction materials. The seasonal variation showed slightly low concentrations in 2020 (averages 2019: 1.36, 2020: 1.09 mg L-1; Figure 4a) caused by low anthropogenic activity related with confinement, and the higher variation in Cancun and Playa del Carmen was related to runoff events. The seasonal distribution of V for both stations show a similar pattern, where the presence of V is commonly noted in the karst groundwater environment [49].
The obtained results infer the slight variation in 2020 that the V source acquired from the runoff and its pathway from the local construction sites that they noticed with the use of steel alloys for construction [49]. The V in dissolved phase is generally scavenged by the oxidation of Fe- Mn markedly in the sediment-water through advective process [50]. Hence, it is evident for higher values in 2020 indicates resuspension during the storm events in the coastal region which increases in the dissolved V phase [51]. Sequential order of Zn in the present study suggest that it is behind Pb and Cu in both the years, indicating that it is due to the resuspension from the sediments high volume of suspended particulate matter in the dynamic region [52]. The concentrations of as obtained in the present work were found below the contamination levels, but the values during 2020 infers the influence of runoff which is enriched with higher concentration of as due to huge dumping and subsequent decomposition of Sargassum in the local land and near the beaches. Since, the decomposition of Sargassum mainly results with the discharge of leachates as their major byproduct which has major impact in the coastal environment [53].
In general, the results obtained showed differences in the intensity of anthropogenic activities between the sampling periods, which had a strong influence on the concentrations of dissolved metals during 2019 and 2020. The reduction of tourist activities by 47.5% during the COVID 19 pandemic had the greatest impact in areas with the smallest resident population (Tulum and Cozumel) [43]. On the other hand, in Cancun and Playa del Carmen, dissolved metals associated with anthropogenic activities showed greater variability and higher concentrations during 2020, which inferred the high influx of metals due to land-based rainfall and the intense mixing processes in the coast because of the tropical storm “Marco” registered during the month of August in the region [2,44].
Statistical analysis
The zonal wise correlation matrices for both years are presented separately in tables 1 and 2. The results of environmental variables (pH, DO and conductivity) with metals indicate that terrestrial, anthropogenic sources, the biogenic process, and hydrography play a significant role in the pattern of dissolved metals in the region between seasons. A clear difference was observed in the correlations of the physicochemical parameters and the concentration and variability of the metals in the area. In 2019, significant correlations were obtained with Cr, Ni, Co and Cd (Table 1), which suggests the entry of groundwater enriched with these metals that originate in urban, tourist and construction activities (Table 1) [42]. During 2020, a strong correlation was observed between trace metals and the main elements (Ca, Mg) (Table 2), associated with the effect of metal carryover by rainwater from urban areas during the rainy season in the coastal zone [42], that increased the concentrations of all metals, mainly those associated with anthropogenic activities in Cancun and Playa del Carmen, which due to being urban areas and having a high resident population (911,503 and 333,800 inhabitants respectively).
In the case of Tulum and Cozumel, the concentrations of metals in 2020 were lower, due to the reduction of the tourist influx, except for the case of metals from natural sources such as Sr and V which maintained similar patterns between samplings (Figure 4, Table 2). The results of the correlation analysis of Ca and Mg ions with some trace metals showed a strong association for 2019, especially with Sr and V due to their natural origin. The correlation of Mn with dissolved trace metals in the 2020 season especially infers that in sub oxic conditions the reduction of Mn occurs and acts as a scavenger for other metals with a high content of organic matter along the coast [54]. During this year, a strong correlation was obtained between all metals, mainly in Cancun and Playa del Carmen, which suggests that their concentrations were determined by common processes (Table 2), such as high urban activity. Dissolved Vanadium is almost last in the sequential order which correlates with high Fe values where high organic materials affect the flux of V leading to removal from seawater under high pH values [55].
Heavy metal evaluation index (HEI)
Calculated HEI values for all the four zones were done for 2019 and 2020 separately. All the trace metals (except Ni & Cd) were lower than the ˂400 indicating that the region is not contaminated with reference to beach water. However, Ni (1598, 735) and Cd (4355, 4050) were higher in both years 2019 & 2020 respectively. Higher values of Cd in both the seasons indicate strong active remineralization due to regular presence of high organic matter from in the study area dominant with coral sandy nature [55,56]. Likewise, Ni is also high in the present study enriched due to the various sub-oxic or anoxic regions in the coastal beaches, where mobilization of Ni takes place [57]. Moreover, higher dissolved Ni is often released into higher saline regions in the coast and minimum desorption takes place at freshwater seawater interface [58,59]. Overall, various coastal management practices are implemented by the local government, nevertheless natural geochemical process is disturbed due to excessive presence of organic materials which aids in enriching this metal well above the permissible limits.
Comparative studies
Comparison values of dissolved trace metals with other tourist beaches and coastal regions around the world indicates a twofold increase of Ni, tenfold increase of Pb and as (Table 3) [3,60-71]. Likewise, comparing the permissible limits with reference to EPA, and CONAGUA there is a two-to-ten-fold increase in the coastal region for most of the metals (except Sr, V) indicating that the strong developmental activities all along the coast in the coastal cities and tourism related pleasure trips have exerted the pressure on the coastal waters. Compared to other coastal beaches Cr, Ni, Pb, Cd and as indicates enrichment of two to five-fold which is mainly due to tourist, various developmental and recreational activities practiced in the study zone.
All values in mg L-1 ; AAS: Atomic Absorption Spectrometry; FAAS: Flame Atomic Absorption Spectrometry; ICPMS: Inductively coupled plasma mass spectrometry; *: Stripping voltammetry; **: Spectrophotometry
Conclusion
This study presents the results generated during two different years (2019 and 2020) suggest that the measured physicochemical variables have no direct relationship with the distribution of dissolved trace metals. The higher concentrations of dissolved trace metals in 2019 are mainly due to intense tourism development activity in the coastal stretch, while in 2020, the greater variability in concentrations related to the drop-in tourism activity due to the social confinement, and the eventual effect of terrestrial runoff during the rainy season. Although the anthropogenic pressure on the coastal ecosystem decreased during the pandemic period, it is clear that the region has a long way to go that requires a continuous effort to generate scientific knowledge that provides adequate information to identify the mixed pressures of anthropogenic and natural factors and with this, generate an adequate program for the management of natural resources of the Mexican Caribbean coast.
To Know More About Oceanography & Fisheries Open Access Journal Please click on: https://juniperpublishers.com/ofoaj/index.php
For more Open Access Journals in Juniper Publishers please click on: https://juniperpublishers.com/index.php
0 notes
Text
Happy Easter-Juniper Publishers

Juniper Publishers wishes Happy Easter to you and your family members!
0 notes
Text
Critical Habitats: Reproduction and Nesting Beaches of the Horseshoe Crab (Limulus polyphemus) in Champotón, Campeche, México

Authored by: Hector Javier Ortiz Leon
Introduction
Limulus polyphemus inhabits specific coastal ecosystems during its life cycle, such as Rhizophora mangle forests and coastal plains in juvenile stages; bays, estuaries and coastal lakes during ambulatory stages and intertidal zones in adult stages since it carries out its reproductive cycle there [1,2]. The more frequently term used to define areas considered key to the survival of a species is “critical habitat”, and the most important are those associated to feeding and reproduction [3]. For conservation of the horseshoe crab, the intertidal zone is a critical habitat. For this species, beaches with slopes between 15° to 20°, coarse sand and tides seem to be important for reproductive aggregations and feeding [4,5].
Few studies have addressed factors related to the critical habitat of L. polyphemus, but it has been found that geochemical and erosive factors are relevant in the selection of breeding and nesting beaches [6,7]. During the 2018, the Icahao, Flamenco and Km 148 beaches were sampled to analyze the relationship between the granulometry and the beach slope with the critical habitat of L. polyphemus in the South-central Gulf of Mexico in Champotón, Campeche.
Selection of beaches was based on three criteria: 1) presence of corpses and/or exuviae, 2) differences in slope and 3) differences in sand granule size. Sand collection was done excavating 30 cm deep with a core and then 500 grams were recovered [5]. Two sand samples per site, and a total of six samples were collected. For the assessment of the granulometry Wentworth protocol modified by Román-Sierra was applied [8,9]. The sand samples were dried in the open air, and 100 g was subsampled and sieved in an automatic sieving Cole-Parmer machine for 15 minutes. We used six sieve sizes (14, 20, 30, 45, 100, 200). The beach slope was measured using a SUUNTOPM-5 manual clinometer.
Night treks were conducted at each site for 4 hours at 1-hour interval to determine the abundance of L. polyphemus in the intertidal zone. At the Icahao and Flamenco beaches 82% and 57% of the sand size, respectively, was considered coarse, both with granules size between 0.5-1 milimiters, while the Km 148 beach shows dominance of fine sand (51%), with granules size ranging 0.074-0.125 mm. The slope of the Flamenco and Icahao beaches was 18° and 16°, respectively, and at Km 148 beach was 14°. Icahao and Flamenco also show the higher abundance of L. polyphemus with 55 and 46 individuals, whereas in Km 148, 19 individuals were observed.
Relationship between size particle, slope, and L. polyphemus abundance
The size of the sand granules with the abundance of the horseshoe crab shows a strong relationship, with higher abundance in beaches with coarse sands, while flattened slopes are associated with lower number of individuals (Figure 1). Icahao and Flamenco show more suitable characteristics for reproduction and nesting and therefore are considered critical habitats subject to protection [7,10] (Figure 2). It is currently known that the horseshoe crab can detect, at a distance, the nature of the sediments for their reproduction (6). Therefore, the granulometry of the beaches plays a fundamental role in the establishment of nests, since sand granules greater than 0.5mm allow an optimal oxygen flow [6,7,11], while slopes greater than 15° prevent the substrate in the intertidal zone from becoming saturated with water, thus reducing anoxemia for optimal development of the eggs [6,7].
Conclusion
The critical habitat of the horseshoe crab in Champotón is characterized by granules size between 0.5-1mm of coarse sand and beach slopes between 16° to 18°. The grain size and slope play an important role in the reproductive cycle of L. polyphemus and their characterization allows the identification of beaches that might be critical habitats and potential sites of conservation.
To Know More About Oceanography & Fisheries Open Access Journal Please click on: https://juniperpublishers.com/ofoaj/index.php
For more Open Access Journals in Juniper Publishers please click on: https://juniperpublishers.com/index.php
0 notes
Text
Sea Piracy and Armed Robbery in the Gulf of Guinea and Its Effect on Shipping Cost and Nigeria’s Economic Growth

Authored by: Anyanwu Okechukwu Julius
Abstract
Purpose: The Due to the increasing rate of economic damages of insecurity to the Nigerian maritime industry with cases of loss of revenue to the federal government occasioned by; high freight charges for Nigeria bound cargoes, high insurance premium chargeable on both ships and cargoes, coming to Nigerian and total boy-cut of the Nigerian ports by most shipping lines. The researcher has been led to carry out research on sea piracy and armed robbery in the Gulf of Guinea and its effect on shipping cost and Nigeria’s economic growth. This research was set out to realize some specific objectives, while research hypotheses were formulated in this regard to address the objectives of this study.
Design/methodology/Approach: The research adopted ex-post facto design. Data were sourced through secondary means from Nigeria Maritime Administration and Safety Agency’s (NIMASA) statistical bulletin, EViews version 12 statistical, forecasting, and modeling was used and simple regression analysis was used to model the relationship between the dependent and independent variables in the research hypothesis which was tested at 5% level of significance.
Findings: The result of the analyses indicated that the model shows that piracy inversely relates with economic growth of Nigeria. It also found out that there is significant relationship between piracy and armed robbery and the cost of shipping due to premium paid because of piracy activities.
Originality/value: This research has X-rayed that Nigeria’s maritime sector is bedeviled by various crimes related activities that affect revenue generation and contribution from this sector. Effective ways of curbing this menace have been highlighted in this work. This paper will provide NIMASA reasonable information with the activities of pirates in the Nigerian waters and how to curb their excesses and may act as a working document.
Keywords: Sea piracy; Armed robbery; Shipping cost; Economic growth
Introduction
Background Information
Shipping has for a long time been recognized as one of the strong catalysts for socio-economic development. This means of transport mode is one of the cheapest and efficient means of transportation over a long distance. However, shipping operations have suffered a lot of challenges in insecurity along its maritime domain and corridors. Armed attacks against ships in the oil-rich Gulf of Guinea surged in 2018, making these waters off west and central Africa the world’s most dangerous maritime route. The United States (U.S) office of Naval Intelligence (ONI) documented 146 incidents of piracy and armed robbery in the Gulf of Guinea in 2018, a 24% increase over 2017 records. The increase in these attacks confirms that the gulf of Guinea’s status as the main locus for maritime insecurity in Africa, which had long been associated with the Horn of Africa, particularly Somalia. Rising piracy and armed robbery in the Gulf of Guinea reflects the region’s growing prominence in global maritime trade, as well as capacity and coordination gaps among the region’s navies [1].
The economic effects of piracy extended beyond littoral states to land-locked countries, which depend on these ports for their imports and exports. According to the United Nations Assessment mission on piracy in the Gulf of Guinea, the annual loss to the economy of west African sub region of piracy is estimated at $2billion [2]. In Nigeria, Piracy threatens the vital fishing industry and regional trade, and long with bunkering, reduces oil revenue and therefore potential financial support for the Delta region [1]. This study will analyse the effect of sea piracy and armed robbery on cost of shipping and Nigeria economic growth and assess the relationship between piracy and the Gross Domestic Products from maritime generated activities. The overall objective of this report is to provide a clear understanding of the relationship between the effect of sea piracy and armed robbery and the nation economy.
Problem Identification
Nigeria is a major force in international trade, with 70 percent of goods coming to west and central Africa destined to Nigeria, out of which 80 percent of the traded goods are transported by sea (UNCTAD, 2009). Therefore, the study of Maritime Domain Safety is crucial to the sub-region. Nigeria remains the hotspot of piracy in Africa. In 2016, the International Chambers of Commerce (ICC) recorded an increase of 157% in Nigeria alone (14 in 2015 compared to 36 piracy attacks in 2016), Abhyankar [3]. Nigeria account for over 60% of total seaborne traffic for the 16 nations in the West African sub-region [4], as warning to mariners in and near Nigeria waters become more common, increased shipping cost for Nigeria and Gulf of Guinea destinations are likely as shippers begin to pack higher insurance premiums into their pricing.
Because increase shipping costs are typically passed onto consumers, they are likely to be inflationary pressures for vital goods and services throughout the region if Nigeria piracy persists. Despite the attacks on Western oil interests, piracy in Nigeria receives less attention than in other regions of the world. Without external pressure and with a federal government either unwilling or unable to act, piracy is likely to increase as a result, conditions in Delta region will continue to deteriorate for many of its inhabitants, providing more incentive for individuals with limited economic opportunities to turn to maritime crime. Piracy and armed robbery have been seen as having serous effect on the economic activities of Nigeria especially high level of premium paid and cost of movement of goods and services not considering the loss of lives and properties within the regions in the Gulf of Guinea. Against the backdrop of this incidence, this work is on the sea piracy and armed robbery in the Gulf of Guinea and its effect on cost of shipping and Nigeria’s economic growth.
Objectives
The aim of the study is sea piracy and armed robbery in the Gulf of Guinea and its effect on Nigeria’s economy.
The specific objectives include:
• To analyses the extent cost of ransom on Premium paid affects shipping cost.
• To investigate the relationship between sea piracy and Nigeria’s economic growth.
Research Hypotheses
HO1: There is no significant relationship between the cost of ransom and Premium paid by shipping companies.
HO2: There is no significant relationship between sea piracy and Nigeria’s economic growth?
Justification of Study
The information from the study would assist the Federal government of Nigeria, Ministries of Petroleum and Transport (Maritime), International Oil and Shipping Companies on how to curb piracy attack in and around Nigeria waterway. It would assist Production and Marine Companies on how to operate and protect their business assets from eminent attack by pirates. Assist regional body like ECOWAS and East African Community (EAC) to adopt similar measures used in curbing piracies and criminality in the Gulf of Aden or Arabian Peninsula.
Scope of the study
From the diagram above, the light-yellow area of the Gulf of Guinea of the map shows the of the activities of pirates that is majorly under attempted attack within the period of this investigation (research work) (Figure 1). Also, the deep yellow colour area of the map shows the of the activities of pirates that is majorly boarded to commit crimes and robbery attack within the period of this investigation (research work). While the blue area of the Gulf of Guinea of the Gulf of Guinea map shows the activities of pirates that is majorly under firing on vessels by the pirates and armed robbers attack within the period of this investigation (research work). The activities are majorly in the area linking Ibadan, port Harcourt and within the surroundings. However, the pink colour area of the guinea map shows the activities of pirates that is majorly under hijacking of vessels by the pirates and armed robbers attack within the period of this investigation (research work). The activities are majorly in the area linking port Harcourt and with the Gulf of Guinea.
Related Literature Review
Economic impacts of piracy on the Commercial Shipping Industry
Most of all international trade is transported by sea, both in terms of Value and weight [5], while millions of people make use of maritime transport for travel and recreation [6]. The presence of pirates in several regions around the world affects maritime transport. The economic impacts of sea piracy on commercial shipping are derived from both the threat of piracy and the consequences of actual attacks. The threat of attacks has prompted changes in vessel management, including routing, speed, and scheduling adjustments; provoked the application of various security measures, including the use of armed guards and the installation of citadels and razor wire, among other equipment; and raised the cost of insurance, including both ‘war risk’ and ‘kidnap and ransom’ insurance premiums [7]. The impact of actual attacks has resulted in the payment of ransoms for kidnapping and hijackings not covered by insurance; and incurred losses due to damage to or theft of the crew’s belongings, cargo, and the vessel [8].
The economic impact on regional nations
Countries bordering with Gulf of Guinea, suffers the greatest regional economic impact of piracy. Between 2006-2018 piracy negatively impacted maritime trade, tourism, and stability in the Region, as discussed below. The international community has increasingly taken note of piracy in the Gulf of Guinea due to the growing threat this activity represents, not only to the lives of sailors, but to both the regional and global economy. Since they derive their profits from the sale of oil and other goods rather than the ransoming of hostages, pirates in the Gulf of Guinea have proven to be significantly more violent than their Somali counterparts. Vessels are frequently sprayed with automatic weapons fire, and the murder of crew members is not uncommon. Recent events indicate that these pirates are even willing to attack vessels with security personnel aboard, evidenced by the recent killing of two Nigerian sailors guarding an oil barge. Given that pirates are now adopting heavier weapons and more sophisticated tactics, this violence is only likely to increase [9].
Beyond the bloodshed, the expansion of piracy in the Gulf of Guinea poses a dire threat to local economies, potentially undermining what little stability currently exists in the region. Oil revenue, which many countries in the region rely upon, is seriously threatened by pirate activity; 7 percent of Nigeria’s oil wealth is believed lost due to such criminality. Additionally, instability in the Gulf has sharply decreased revenue collected from trade; Benin, whose economy depends on taxing ships entering the port of Cotonou, has experienced a 70 percent decline in shipping activity due to piracy. Furthermore, as piracy drives up insurance premiums for international shipping companies, the price of imported goods in the region could spike, further imperilling local economies. If these local economies falter, development and stability in the region could quickly deteriorate [10].
However, the effects of piracy in the Gulf could well extend far beyond Africa, with potential ramifications for the larger global economy and the United States in particular. The estimated 3 million barrels of oil produced daily by the nations around the Gulf ultimately feed the North American and European markets. Nigeria alone is the fifth-largest supplier of oil to the United States and by 2015 could account for a quarter of U.S. oil consumption. However, given the rate at which attacks on oil tankers are increasing, the ability of these nations to reliably provide oil to the international market could be in question. Early 2012 saw a doubling in the number of attacks on oil tankers, with as many as eight hijackings in a month. If this dramatic trend continues, the flow of oil from the Gulf of Guinea to the United States and the West could slow considerably.
modelling
The most direct and obvious consequence of piracy is economic. Nigeria loses $25.5 billion annually to piracy in its coastal waters. Much of this loss revolves around the theft of crude oil now put at 300, 000 barrels per day or 12 percent of daily production. Between 2003 and 2008, illegal maritime activities cost Nigeria $92 billion. The threat of piracy is of grave concern to ship owners and to those who hire ships. Ship owners sustain heavy losses on hijacked ships which are demobilized for a long time. This is compounded by the threat to the crew. These factors are increasingly compelling mariners to avoid routes that pass through Nigerian waters, while vessels find it difficult to crew ships [11].
Piracy also exerts an indirect impact on the Nigerian economy. It has disrupted Nigeria’s commercial fishing industry. Although the domestic fish market accounts for just 20 percent of all the fish consumed in Nigeria, that percentage has steadily decreased over the past five years because of the rise in piracy, according to a 2007 study by the United States Department of Agriculture. This has resulted in a sharp decline in fish consumption, now put at 7.5 kg annually, well below the 13 kg recommended by the FAO. Nigeria now imports between 700,000 and 900,000 metric tons of fish at the cost of over N50 billion annually to make up for this shortfall – an enormous outlay that is perforating the nation’s finances. Thus, we see that the impact of piracy extends well beyond the province of maritime security to economics, in terms of lost jobs in the commercial fisheries sector, to even nutrition by reason of its impact on the local availability of fish proteins for our children.
The direct economic cost of piracy.
The main direct cost of piracy, including the cost of ransoms, piracy insurance premiums deferent equipment, re-routing vessels away from piracy risk zone, naval deployments in piracy hot zones, piracy prosecutions, and organization budgets dedicated to reducing piracy.
The Cost of Ransoms
One of the most spectacular increases in the cost of piracy in recent years has been the increasing price of ransoms paid to release hijacked ship. Ransoms are generally sought by Somali pirates. Pirates in the other regions have more often stolen the vessels or cargo, rather than ransoming the value of the seafarers’ lives and their ship. In November 2010, the highest ransom on record $ 9.5 million, was paid to Somali pirates to release the (Samho Dream) South Korean oil tanker [12]. Indeed 2010 set a remarkable record for the cost of ransoms, with the year kicking off to a $ 7 million ransoms paid in January to release the Greek super tanker (MV Moran Centaurs’), which had been carrying $162 million of crude oil from Saudi Arabia to the United States. The ransoms demonstrated the exponential increase in the price of ransoms in recent years. In 2005 ransoms averaged around $ 150.000 (Payne,2010). By 2009, the average ransom was around $ 3.4 million. In 2010, ransoms are predicted to average around $5.4 million [13].
Problematically, increasing ransom payments appear to be lightening negotiations and therefore the duration seafarers are held hostage; the average length of negotiations has more than doubled over the past year as pirates seek and receive, larger ransom payments. Ships were held for an average of 106 days between April and June of 2010, up from just 55 days in 2009, and the last four ship release in November 2010 were held for an average of 150 days (NPR,2010). Seafarers now face the likelihood of three tour month captivity. The total cost of ransom is estimated to be around double the value actually paid to pirates. The total cost is duplicated by several factors such as the of cost of negotiations, psychological trauma counselling, repair to ship damage caused while it is held captive, and the physical delivery of the ransom money, often done by helicopter or private plane (BBC News, February 5, 2009). Finally, large costs result from ship being held and out of service for instance, it cost around $3milllion for cargo ship to be held for two months at a charter hire rate of $50,000 per day (Kraska) (Table 1). By doubling the cost for the estimate cost of ransoms for 2016 and 2017 ($415 million) to incorporate excess cost such as negotiation and delivery fees, we approximate that over the past two years, around $830 million has been spent on ransoms.
Source: IMB, 2011
The Cost of Insurance
In reaction to the growing threat and cost of ransoms, the maritime insurance industry has responded by increasing its shipping rates and premiums, especially in designated high-risk piracy zones. Shipping insurance comes in four main types: war risk, kidnap and ransom, cargo, and hull insurance
• War Risk: War Risk insurance is an excess charge for a vessel transiting a war risk area. The Gulf of Aden was classified as a war risk area by Lloyd’s market Association (LMA) joint war committee in May 2008. Since this date, the cost of war risk premiums has increase 300-fold (insurance broker marsh McLennan, June 26, 2009), from $500 per ship, per voyage, to up to $150 per ship, per average, in 2010 (UNODC). Other regions affected by piracy have also been classified as war risk zones in the past, such as the Malacca strait between 2005 and 2006.
• Kidnap and Ransom (K&R); Generally, K&R insurance covers the crew against ransom demand, but not the vessel or cargo. However, some marine insurance policies have recently expanded to include both crew and property. Insurance giant Munich Re-estimates that K&R premium increased tenfold between 2008 and 2009 (GIRO, marine piracy 2010).
• Cargo: Cargo insurance covers goods transported by a vessel. The excess premium on cargo transiting piracy region is estimated to have increased by between $25 and $100 per container in the few years (Emmanuel, “Time to Join the Fight against Maritime Piracy, September 23, 2010).
• HULL: Hull insurance covers physical damage to the ship, including harm from heavy sea, collision, sinking, collapsing, grounding, fire, or piracy. It estimated that piracy has doubled the cost of hull insurance. In calculating the global cost of maritime piracy, we take the largest insurance premiums related to piracy (War risk and K&R) and multiply these rates by 90% of the total ship traffic transiting the high-risk region of the Gulf of Aden (around 30,000 ships). We deduct 10% of ship traffic under the assumption that this proportion of ships opts to re-route around the Cape of Good Hope and is therefore not liable for insurance premiums (Table 2).
Source: IMB 2011
In the war risk region, note that as piracy continues to increase across the globe, and insurance against piracy attacks becomes an increasingly lucrative business, we may witness premiums decrease as competitors move into the market. As one marine underwriter at Lloyd’s of London stated, “Traditional carriers have been cutting each other so much to get the premium in that the price has fallen off the end of a cliff.
The Cost of Re-Routing
For some vessels, especially low and slow-moving ships, which are at the greatest risk of piracy attack, avoiding risk zones altogether may be a safer or cheaper option. For example, some ships may opt to avoid the risk of transiting through the Gulf of Aden and Suez Canal, and instead take the longer voyage around the cape of good hope while robust data on the proportion of ship owners and masters who re-route their vessels via this longer route is not readily available, some companies have announced that they are diverting their fleet. For example, AP Moller Maersk, European largest ship owner, is diverting all 83 tankers, as are the Norwegian stole tanker fleet, Odell shipping group (with a fleet of 90 tankers), and frontline. We also know that Egypt’s Suez Canal revenue (fees collected from ships transiting the Suez Canal) has decreased by 20% in the past couple of years [12].
The cost of deterrent security equipment
Ship owners attempt to protect their property and crew from pirate attacks by preparing their ships with security equipment and/or personnel prior to transiting a high-risk zone. Robust data on the proportion of ships purchasing deterrence equipment, and the type of deterrence equipment, is not easily accessed. Nevertheless, average cost of deterrence equipment and personnel are listed in table – below. These rates reflect cost for equipment used to transit around the Horn of Africa. Since this is the area that the ship owners would likely be most interested in purchasing deterrent equipment. Just as for the cost of insurance premiums above the approximate a lower bound (10% of ships) and an upper bound (70% of ships). Estimate for the total cost of deterrence equipment to the shipping industry. We calculate that the total cost of deterrence equipment to the shipping industry is between $360 million and $2.5 billion per year (Table 3).
Measures to deal with maritime piracy
Regional Cooperation
The Djibouti Code of Conduct: In 2009 a high-level meeting of 17 countries from the Western Indian Ocean, Gulf of Aden and Red Sea areas met in Djibouti and adopted a “Code of conduct concerning the repression of piracy and armed robbery against ships in the Western Indian Ocean and the Gulf of Aden”. There are signatories to the code of conduct to undertake wideranging commitments to cooperate in seizing, investigating and prosecuting pirates in the region, and to review their relevant national laws. The code of conduct allows authorized officials to board the patrol ships or aircraft of another signatory. Nine countries have so far signed the code of conduct. These include Djibouti, Ethiopia, Kenya, Madagascar, the Maldives, the Seychelles, Somalia, Tanzania, and Yemen [14].
Source: MARAD, 2010
International Cooperation
United Nations Recognizing the seriousness of maritime piracy in the Gulf of Aden, the Secretary-General of the United Nations has called fora multifaceted approach to combating piracy “to ensure that the political process and the peacekeeping efforts of the African Union and the strengthening of institutions work in tandem”. The United Nations Security Council has been actively engaged in formulating adequate responses to the issue of piracy. Several UN Security Council resolutions have been adopted to address the delivery of humanitarian aid to Somalia and the protecting and escorting ships employed by the World Food Programme.
Role of the bank in combating piracy
The impact on sea borne trade and maritime economic opportunities pose serious challenges to Africa’s development agenda. The Bank can play an important part in combating piracy [15].
Improvements in port security
Michael Baker observes that shipping companies send smaller, older, and cheaper ships to Africa because the ports cannot handle modern fleets. As a result, shipping companies deploy their remaining smaller and slower ships for transport to and from Africa, increasing the number of easy targets for pirates and further impeding Africa’s ability to export products efficiently. The Bank can contribute by increasing resources to improve port infrastructure, Daniel [16].
Possible direct effects of modern maritime piracy
The possible direct effects include.
Delays caused by attempted attacks themselves due to escaping maneuvers.
• Damage to the ship or cargo incurred in the attack.
• Loss of safe and cash money.
• Loss of cargo.
• Loss of hire.
• Loss of operation during the attack and investigation procedures.
• Loss of the whole ship as a cause of hijacking.
• Kidnap and ransom money for ship and seafarers.
• Investigation costs.
• Costs of negotiating and delivering the money.
• Contractual penalties due to delayed or damaged delivery.
• Cargo fraud with phantom- or ghost-ships.
With daily vessel operating costs ranging from US $10,000 to US $50,000 or more, spending a week in a port while sometimes untrained or corrupted local police doing their investigation will usually cost a lot more in lost time than a small pirate attack itself. Munich Re Group [17].
Possible indirect effects of modern maritime piracy
• Security cost like: costs incurred in the fight against piracy; additional security measures, additional security costs, increase transport price, insurance costs [17].
• Insurance cost: Possible effects in respect to insurance costs are higher premium in piracy-prone areas, additional kidnap, and ransom insurance, change in trade routes [14].
Procedures of the IMO change continuously. The official warning today is to sail 250 nautical miles of the East coast of Africa. This will lead to non-optimal economic routes and a price increase of maritime transport [18].
• Effects of change in shipping routes are longer distance, longer travel time; Avoiding some ports, Increase costs; Increase transport price, Arbitrariness of piracy
Luft [19] stated that piracy is especially dangerous for energy markets. Most of world’s oil and gas is shipped through the dangerous piracy-prone regions. Targets of piracy attacks include most classes of vessels. According to Berkeley [20], only the most expensive or well-equipped shipping companies will find it economically feasible to bring imports into piracy-prone waters. As a result, due to the possible arbitrariness of pirates, the following effects can mention: Increased competition energy markets; increase world’s oil price; increase general price levels; change in level playing field; specialization.
Doing business in a riskier environment could lead to higher investment risk premiums. Furthermore, crew impact of piracy can be enormous. Attacks, hostages, injuries, risk of being killed and traumas will lead to possible claims for damages by members of the crew and their relatives. Working in such environment will be less pleasant and can lead to a smaller labour market for the shipping industry. Modern pirates are taking advantage of the small size of the crew on modern cargo vessels. Shipping companies have to re-think about the size of their crew. Possible effects are: Increasing investment risk premiums; Crew impact; Claims of crew and family, smaller labour pool, less quality maritime transport service, increased workload on board, doublepay danger money; increase transport price [21].
Liability Maritime Transport
Pirate attacks against vessels can be used as a political tool to disrupt vessel passage through certain maritime bottlenecks [22]. This is especially true in the case of the strategically important Malacca Straits where most Middle East oil exports to Asia and most commerce between Asia and Europe pass. Due to fear of bottlenecks and changing steaming routes, it will lower the liability of maritime transport. It could create the need to count with higher inventory levels due to the potential piracy to cause bottlenecks in world’s delivery systems. This will reduce the benefits of just-in-time manufacturing processes and undermining supply chain management.
Effects are summed up below:
• Lower liability maritime transport.
• Costs of higher inventory levels
• Less (grow) of demand maritime transport.
Environmental impact of piracy
Piracy could lead to environmental disasters with oil tankers. There are known cases where the bridge left unmanned after an attack. Collision with another vessel or grounding could lead to environmental disasters. The costs of these kinds of disasters can be considered as tremendous. Effects are: Environmental and ecological catastrophe as well as major chokepoint closed for a long period of time.
The Resource Dependency Theory
This research is based on the resource dependency theory. Resource dependency theory has its origins in open system theory as such organizations have varying degrees of dependence on the external environment, particularly for the resources they require to operate [23]. This therefore poses a challenge of organization facing uncertainty in resource acquisition [24] and raises the issue of firm’s dependency on the environment for critical resources [25]. The external control of these resources may decrease managerial discretion frequently, interfere with the accomplishment of organizational objective, and eventually intimidate the existence of the focal organization. Confronted with the costly situation of this nature, management aggressively directs the organization to manage the external reliance to its advantage. Organization success is defined as organizations maximizing their power [24].
Nigeria economy mainly depends on oil and gas revenue especially as most of these resources are deposited in her ocean bed. Hence its exploitation and exploration depend to a large extent on the activities of the Nigeria Maritime sector. The external environment (piracy and armed robbery) therefore affects the activities of the maritime sector (revenue) to a great extent. The political, environmental, social, and technological factors on the external environment hence affect the activities and performance of the maritime industry as it is resource based. Therefore, the activity of the pirates which is a social factor affects the operation and performance of the maritime industry as poor performance will likely result during the period of high piracy activities. Controlling the social factor (piracy attack) of the external environment therefore will impact positively on the maritime sector (revenue generation).
The Weakness of the Failed States Theory
It is imperative to associate politics to crime, this is to have a clear understanding of reasons for maritime violent behavior. The Failed State Theory (FST) was advanced by Weber. He defined a failed state as a political body that has disintegrated to a point where basic conditions and responsibilities of a sovereign government no longer function properly.
Similarly, if a state weakens as well as average of living declines, it brings the likelihood of government fail meaning that, the state has been brought ineffective hence unable to enforce its laws uniformly and make provisions for fundamental goods and services to her citizens due to issues not limited to high crime rates, acute corruption in the polity, poor bureaucracy, ineffective judiciary as well as military interference in politics. Some of the characteristics of a failed state include 1) Partial or total loss of control of her territory or of the monopoly of legitimate use of physical force therein, 2) Attrition of rightful authority to make collective decisions, 3) Incapability of making provision of public services and, 4) Inability or poor interaction with other states as a full member of the international community. According to Monteclos [22], he insisted that failed states ease piracy which diminishes the authority of the state.
In his opinion, the correlation between piracy and state control is multifarious. African countries especially in Nigeria, the failed state theory can easily be seen in incessant attacks by pirate in the maritime domain. The criticism in colonial legacy of Nigeria has been attributed to the weakness of the Nigerian state. The Biafran War period 1967-1970 also may have contributed to this, also last decade of the Movement for the Emancipation of the Niger Delta (MEND), made demands for resource control of the Niger Delta resources. This gave rise to many groups in the area demand for rather their inheritable portion of the “national cake” without contest to the authority of the State.
Furthermore, Jones [26] stated that the Nigerian Government’s role as regard to piracy in Nigerian waters is confusing; according to him officials of the government conspire with the pirates and militant groups to really weaken the authority of the State. Security forces (police, Navy, Army) attack the militants and partake in illegal oil trading, piracy and kidnappings which is the core under-current factor befalling the Nigerian economy as currently palpable corruption in our faces.
Most governors of the oil-producing states also to get rid of opponents, fund their unlawful activities, yet also fund the leading political parties, Monteclos [22] also asserted that “the Nigerian State herself is associated in maritime piracy as analysis of government agencies made some revelations in this regard. According to him the army, concludes in the shade deals with the militants to divide up the booty and bargain a status quo”. The Nigerian Navy on the same hand is corrupt and caught up in illegal drug and oil trading behavior. The weakness of state theory explains why the officials of Navy, Army, Customs, and Port Authorities of today still update pirates and militants in the places the where about of boats and the real values of their cargo, this has contributed to inability of winning the war against maritime piracy both in Nigeria and Gulf of Guinea over the years.
Methodology
Method of data collection
The data for this study was sourced through the secondary means. Data were collected through several publications, textbooks, International Maritime Organisation. Seminar papers and Nigerian Maritime Administration and Safety Agency (NIMASA) annual bulletins and International Maritime Bureau (IMB), etc.
Research Design
Research design provides the glue that holds the research project together. Ex-post facto research design was therefore used for this study.
Analytical Method used
The simple regression analysis was used to model the relationship between the dependent and independent variables in the research hypothesis. Hypothesis one is on cost of ransom and the premium paid by the shipping company. Cost of ransom is a proxy for the activities of piracy and premium paid affects the revenue generated by the company, hence, the model for the relationship is
MAREV= f(PIRACY) (1)
Y = Bo +B1X1 + u
Where:
Y = Maritime revenue
Bo = Constant
X1 = Piracy incident
U= error term
The second model is on sea piracy and Nigeria’s economic growth. The model for this hypothesis is
GDP= f(PIRACY) (2)
Y = Bo +B1X1 + u
Y= GDP proxy for economic growth
X1= piracy incidents
U= error term
Presentation and Analyses of Data
The data as obtained from the Nigerian Maritime Security agency (Table 4)
Time series statistical data on piracy and armed robbery attacks against ships in Nigeria, associated insurance costs/ premium paid by shippers and ship owners, piracy induced revenue losses by industrial fishing sector and GDP maritime transport.
Analysis of Data and test of hypotheses
Hypothesis One (HO1): There is no significant relationship between the cost of ransom and Premium paid by shipping companies.
Dependent Variable: MAREV
Method: Least Squares
Date: 03/01/20 Time: 13:12
Sample (adjusted): 2000 2017
Included observations: 18 after adjustments (Table 5)
Source: IMB Piracy and Armed Robbery Reports Against Ships (2004, 2007, 2011, 2015 and 2019 editions). Central Bank of Nigeria Statistical Bulletin (2010, 2013 and 2019 editions). Marine insurance Digest, (2007, 2012 and 2019 editions). Nigerian Industrial Trawler Owners Association (NITOA)
The output above shows that there is a negative relationship between piracy and premium paid by the shipping company. This implies that as piracy activities increase, the company pays more ransom, and this leads to fall in maritime revenue. The coefficient of determination is high and shows that the model explains about 89.9% of the total variation in the model. The overall regression is significant as the p-value is less the 5% level of significance.
Hypothesis two (HO4): There is no significant relationship between sea piracy and Nigeria’s economic growth?
Dependent Variable: GDP
Method: ARDL
Date: 03/01/20 Time: 13:13
Sample (adjusted): 2001 2018
Included observations: 18 after adjustments
Maximum dependent lags: 4 (Automatic selection)
Model selection method: Akaike info criterion (AIC)
Dynamic regressors (4 lags, automatic): PIRACY
Fixed regressors: C
Number of models evaluated: 20
Selected Model: ARDL (1, 0)
Note: final equation sample is larger than selection sample (Table 6)
The model shows that piracy inversely relates with economic growth. The model is rightly signed and significant. The overall regression is significant, and the coefficient of determination explains about 99.7% of the variation in the model.
Discussion of Results
From the hypothesis one, there is no significant relationship between the cost of ransom and Premium paid by shipping companies. The output showed that there is a negative relationship between piracy and premium paid by the shipping company. This implies that as piracy activities increase, the company pays more ransom, and this leads to fall in maritime revenue. From the review of various literatures and analyses of the data, it was observed that piracy incidents and activities adversely affect revenue of the maritime industry as well as the nation’s economic growth. It increases the cost of security through increasing insurance premiums. It leads to drop in revenue and scares foreign investors. It also increases the costs of imported goods. This is in line with Berkeley (2005), who opined that only the most expensive or wellequipped shipping companies will find it economically feasible to bring imports into piracy-prone waters
The second hypothesis which depicts that piracy inversely relates with economic growth. The above output indicates that piracy is positively related with economic growth. The increase in the activities of the pirates will for force the company and ship users to increase the cost of insurance of the cargoes and vessels. The model is rightly signed and significant. It is in line with Munich Re Group [17], it is far more difficult for the insurers to reduce the incurred loss then for their clients, if the insurance companies getting aware of a new increase of piracy in some dangerous waters, then it is a fact that the insurance premiums will rise, which certainly affects the output of maritime transport and directly affecting the economic growth of Nigeria [27-28].
Conclusion
The traumatic effect on the shipper (cargo owner) carrier (ship owner) the insurers and the crew/passengers on board the subject matter embarking on the voyage. Also, the position of Nigeria in the maritime prone areas statistical data as obtained from the annual piracy report /publication from the international organizations was also featured. The proactive suppression of these armed attacks is not only the responsibility of the international shipping industry out of the terminal operators, port authorities, and industry but of the terminal operator’s ports authorities, coast guards and relevant local, regional, and national government or coastal states. Such bodies face many problems not least the growing sophistically of organized criminals, but only by their commitment and co-operation can the growing problem of armed attacks on ship be contained. From the findings, political instability in the country and around the coast guards has been seen as a major contributory factor since most of the piracy incidents with the growing importance of maritime trade in the nation’s development need not to be jeopardized on the ground of grievance of political marginalization.
Recommendation
In the light of the findings of this study, the following recommendations are made
• There should be regional cooperation and international cooperation among trading nations and coastal areas.
• There should be production of knowledge products for security measures.
• There should be contributory financial resources scheme for fighting piracy and improvements in port security.
• Anti-piracy laws should be enacted to seal with sea pirates’ development of piracy.
Vessels should be instructed not to anchor in high-risk areas.
To Know More About Oceanography & Fisheries Open Access Journal Please click on: https://juniperpublishers.com/ofoaj/index.php
For more Open Access Journals in Juniper Publishers please click on: https://juniperpublishers.com/index.php
0 notes
Text
Zooplankton Diversity and Composition of Malampaya Inner Sound, Taytay, Palawan, Philippines

Authored by: Arlene L Avillanosa
Abstract
Zooplankton samples were taken in six sampling stations at Malampaya Inner Sound, Taytay, Palawan, to determine its abundance, distribution, and diversity, and composition related to the complete lunar cycle during the month of April 2007. Horizontal towing and vertical hauling of 333 μm plankton net was conducted from the afternoon to midnight, two hours before the onset of the moon phase. 27 zooplankton taxa belonged to eight (8) different phyla identified. During the entire lunar phase, arthropods, chordates, cnidarians, and chaetognaths were present. Zooplankton appears in great abundance during nighttime, full moon, and high tide based on 1-month sampling. Higher zooplankton diversity was observed during the new and full moon, largely represented by arthropods, particularly copepods and decapods. Generally, the area has a high number of individuals but low in diversity. A more extended sampling period and more sampling events should be conducted in the area to correlate zooplankton abundance and composition among lunar phases. Wind and current pattern and nutrient composition should be taken to better understand the plankton productivity in Malampaya Inner Sound.
Keywords: Zooplankton; Abundance; Diversity; Lunar cycle
Introduction
Plankton are organisms that live suspended in the water column and drift with the current. They include protists, animals, plants, and bacteria, where most are microscopic. Zooplankton (animal plankton) are also known as the primary consumers in the oceans that primarily feed on phytoplankton (plant plankton) and serve as food for higher trophic level organisms. Although they are small, their great abundance and diversity can support larger animals. Estuarine is important, ecologically, and physically, i.e., their value to human welfare. They are used as a waste disposal site that continually enriches them with nutrients, creating conditions of exceptionally high productivity. It serves as the region essential to many marine organisms’ life history and development, particularly on their larval stages (meroplankton) and host commercial and recreationally important finfish and shellfish. It is also a vital breeding ground or nursery region [1]. The presence of high productivity may indicate an abundance of higher trophic level organisms provided by an essential index of biological production in estuaries [2]. It was reported that representative genera of estuarine zooplankton include the copepods, mysids, and amphipods [1]. Zooplankton in estuaries is generally represented by organisms belonging to phylum Arthropoda, mainly composed of copepods. Copepods are the net zooplankton in the oceanic system [2].
As an estuary, such as Malampaya Sound may harbor a large population of zooplankton, which could initially explain the area’s high fish population, i.e., the “fishbowl of the Philippines” during the 1950s [3]. Various studies and reports in Malampaya Inner Sound indicate the abundance of commercially important aquatic resources in the area. The presence and abundance of plankton play a significant role in supporting the large fish population in the area. However, studies on these minute species that serve as food for bigger marine organisms are limited. This paper presents the Malampaya Inner Sound zooplankton diversity, composition, and abundance based on lunar phases.
Materials and Methods
Sampling area and station
The study was conducted in Malampaya Inner Sound, located in the western part of the province, adjacent to El Nido, Palawan, Philippines, covering about 200,155 ha. It is 14.4km long and 6.4km wide, with depths of 5.5 to 16.5m in the middle. The sound offers significant ecological features and livelihood opportunities for its surrounding communities. Most of the population is primarily engaged in fishing and secondarily in farming. Others are involved in agriculture and seaweed culture and the culture of fish in cages. Interestingly, it is the only known habitat for Irrawaddy dolphins in the Philippines. Six sampling stations (Figure 1) were initially established using the Geographical Positioning System (GPS) during a preliminary survey. The characteristic of each site served in the identification of sampling stations. Two sampling stations were in highly populated areas or near the communities (Stations 1 and 6) and another from a cove (Station 2), protected from the strong current. The remaining three sites were established in the open water (Stations 3, 4, and 5).
Sampling method and analysis
There were four sampling events within a month. Horizontal towing and vertical hauling of 333μm plankton net was done approximately two hours before the onset of the moon phase. Horizontal towing parallel to the coastline was done for 10 minutes in every sampling station at a speed of approximately 1.0 m/s. After towing, the plankton net was retrieved, then washed down from the outside, or the net was lowered to the water several times to allow plankton to be washed down to the cod-end bucket below, and the sample was kept in a bottle with a label. Vertical hauling was also conducted. The plankton net was lowered 2-3 minutes in the water and then retrieved as was done with the horizontal tow. The 5% buffered formalin solution was used to preserve the samples prepared and stored for a week before the scheduled sampling. Labels were placed into the bottles, where samples were kept. All samples collected were brought to the WPU-PPC laboratory. Identification was done using the works of [4-7]. Relative compositions, abundance, and distribution were determined for every station and compared among the different lunar phases. Both abundance and distribution were analyzed and expressed in individual/ml. Species diversity was derived using the Shannon-Weaver index [8].
S
H’= -Σ P log2Pi
i =1
Where: S= is the total number of species
Pi= is the proportion of the number of species i to the total of individual, that is P i= n i / N; then one might as well cast the equation for H’ directly in terms of the observed values of ni.
N = is the total number of individuals; n1, n2…n3 are the respective value of individuals of each species
Results and Discussion
Zooplankton taxa
A minimum of 27 zooplankton taxa belonged to 20 families and eight phyla, namely: phylum Arthropoda, Chordata, Cnidaria, Chaetognatha, Echinodermata, Mollusca, Granureticulosa (Foraminifera), and Annelida. A total of 49 genera were identified, while seven were unidentified. Organisms under the phylum Arthropoda have the largest number of zooplankton representatives in the entire sampling event. The zooplankton taxa in the area are consistent with the findings of [3], although they collected their samples during the daytime. In their study, the zooplankton of Malampaya Sound belongs to seven different zooplankton phyla, namely, Arthropoda, Chordata, Annelida, Chaetognatha, Cnidaria, Mollusca, and Echinodermata. In the present study, phylum Granureticulosa (Foraminifera) was collected and the above-mentioned phyla. The high number of representatives belonging to the phylum Arthropoda supports the fact that Arthropoda is the largest phylum in the animal kingdom [9]. Among macrobenthos, crustaceans, polychaetes, and mollusks commonly dominate the estuarine plankton communities [1]. It is common to find copepod species such as Acartia, Centropages, and Eurytemora. The largest number of different copepods taxa/genus found in the area is expected since these organisms are the net zooplankton in the oceanic ecosystem particularly in an estuarine environment as cited by [9]. According to [3], copepods are the primary zooplankton found in the area. The cladocerans (Evadne and Penelia), ostracods (Cypridina), and decapods (Lucifer) mostly in larval stages, mysis, zoea, shrimp larvae, brachyuran zoea, and megalopa larvae form the other components of phylum Arthropoda in the area. Many larval forms in which organisms, particularly arthropods, pass through different larval stages before becoming an adult probably explain the dominance in several this group partly [1]. He also added that light, which occurs 12 hours a day in the tropics, is the principal factor that influences molting, spawning, and growth of estuarine fauna. Another reason for these high larval forms is that coastal nekton commonly uses estuaries as a nursery ground, probably for the advantage of protection and abundance of food as cited by [3]. Collected organisms such as the chaetognaths or the arrow worms, annelids, echinoderms, mollusk, and cnidarians, coincide with those organisms collected by in their study. It indicates that they are a permanent zooplankton resident in the area.
Abundance and Distribution
With horizontal towing, zooplankton population was relatively higher in stations 1, 5 and 6 (>30 ind/ml) compared with stations 2, 3 and 4 (<25 ind/ml). The greatest abundance of 68 ind/ml zooplankton was observed at station six, as indicated in Figure 2, which occurred largely during full moon and last quarter samplings. It was followed by station 1 (Guinlo), which had 35 ind/ ml. With vertical hauling, station 4 has the highest zooplankton abundance (17 ind/ml), followed by 16 ind/ml at station 6. It was observed that horizontal and vertical abundance except in Station 6 were somewhat inversely proportional, i.e., if abundance in the station of horizontal towing was high, its vertical samples have lower abundance. Another observation is the sudden zooplankton increase during the last quarter, particularly at stations 5 and 6 when tide level ranges are at their maximum.
Zooplankton also tends to be collected more abundantly using horizontal towing. In terms of sampling events, great abundance occurred during the first sampling event (full moon) and decreased as the sampling event progressed (Figure 3). Plankton abundance varies horizontally, vertically, and seasonally. As indicated in the results, Station 6 has the highest abundance. This large population of zooplankton in the area, especially during the full moon, last quarter (horizontal towing), and new moon (vertical hauling), may be due to sampling time, tide levels, and other characteristics. The towing distance is more important than the size of the net in determining the accuracy of the samples as cited by [10]. Sampling events correspond with nighttime (1700 to 0200 HR) and varying tide levels. Higher abundance was noted using horizontal towing since, during nighttime, zooplankton tends to migrate at the surface, preferably to feed and avoid predators [2]. Zooplankton migrates upward during the night and descends during the day [11]. Tide levels have a relationship with zooplankton abundance; as tide level increases, zooplankton abundance increases, and low tide level may indicate less zooplankton population [12]. It was reported by that as the tide level increases, organisms migrate into the shallower areas of tidal flats, searching for food. As the tide recedes and pressure declines, these organisms retreat toward deeper water.
The highest abundance at station six can be attributed to the stations, location, and sampling site characteristics. The area is situated near shore and near human communities, which has something to do with phytoplankton production. Zooplankton migrate to the surface layer where phytoplankton are rich to feed on rich phytoplankton production. Phytoplankton need dissolved nutrients, sunlight, and other factors which could be found on the surface to be used for photosynthesis [2]. Another reason is that the area is in coastal waters; as cited by [13], phytoplankton production is enhanced at any latitude in coastal waters. He also emphasizes that landmasses of tropical effects can directly influence the abundance and higher plankton production in coastal waters of tropical regions, which can be attributed to the input of nutrients, trace metals, and organic matter. Humic substances and fecal wastes from near human communities and fish cages may be partly associated with this high abundance of zooplankton. Increased nutrient availability due to run-off and regeneration in shallow-water, stabilization, and other factors are involved [14]. The area receives large amounts of nutrients and organic nutrients from the land through river run-off, absorbed by phytoplankton and consequently grazed by zooplankton. Station 1 followed station 6 in terms of abundance with 43 ind/ml. Most of the samples were collected during the full moon and new moon (horizontal), and last quarter (vertical). Unlike station 6, station 1, although characterized as a community-near area, is not heavily populated, and no river can be found in the area. There are also fewer fish cages compared with Station 6. Stations 4 and 5 are in the open water and have an abundance of 42 ind/ml (horizontal + vertical). This abundance may be due to the area’s characteristics, which is deeper (10m); hence, many individuals were collected. A larger area was covered for sampling. Zooplankton distribution is affected by depth, proximity to landmass, nutrient levels, biotic interactions, and indirectly by diurnal migrations as cited by [14]. Stations 2 and 3 have 27 ind/ml (horizontal + vertical), although most samples were from horizontal towing.
The increase in zooplankton at stations 5 and 6 during the last quarter sampling can be attributed to the mild water current observed during the sampling. The distribution of zooplankton being suspended in water is affected mainly by circulation patterns and wind directions as cited by [14]. According to [3], Malampaya Sound has two pronounced seasons; dry from November to April (northeast monsoon) and wet during the year. Since stations 6 and 5 are found the opposite to the sounds’ opening to the open sea and on the southeast part, there could be a possibility that zooplankton may be driven by a strong wind that induced current during sampling event, causing a sudden increase of zooplankton in these stations. In line with this, [14] in their study of the Ragay Gulf, Philippines, reported that zooplankton tends to increase during the northeast monsoon. However, this study cannot be confirmed since there is no available data for current and wind patterns during the sampling period.
The observed decrease in zooplankton abundance as the sampling event proceeded from full moon to first quarter may be due to the sampling period (April) and phytoplankton production. The spring (February/March) increase in light and water temperature initiates a spring phytoplankton bloom in mid-latitude estuaries [1]. In relation to this, [15] states that zooplankton appears in great abundance after phytoplankton bloom has passed. Zooplankton rise in middle March to April throughout the sea as cited by [16]. In Florida, maximum production rates usually occur during the summer months due to the strong development of holoplankton and meroplankton [1]. The observed dominance of arthropods in zooplankton samples except during the first quarter in which chordates exceed arthropods might be because arthropod is the largest animal phylum where many zooplankton organisms belong [9]. It also has the highest representative taxa in the entire sampling event. The copepods and decapods constantly dominate many Arthropods in the area [3]. The higher number of individuals during full moon sampling is due to the sampling event conditions and samples collected.
Both tide level and sampling during night trigger zooplankton abundance attributed to the tendency of zooplankton to migrate and increase during high tide levels. According to [12], when the tide was highest, zooplankton increases. Chordates tend to increase during the last quarter and exceed the number of arthropods during the first quarter due to the bulk samples of ichthyoplankton (eggs and larva) and Oikopleura sp. This event can be related to the sampling season temperature. Summer (May) is associated with the increased temperature that strongly influenced the development of fishes which are poikilotherms. The maximum production usually occurs during the summer months due to the strong development of holoplankton and meroplankton [1]. He added that light, which appears 12 hours a day, is the principal factor influencing the molting, spawning, and growth of estuarine fauna. The presence of mollusks and annelids during full moon and last quarter and forams during full moon indicates that these organisms require certain tide levels to migrate. Cnidarians increased as the sampling event proceeded, particularly jellyfish larvae. This could be attributed to the season and temperature. According to Tandoc (pers. comm.) jellyfish tend to increase during summer (April-May). As evidence for this increasing jellyfish population, during this study, a jellyfish factory in the area resumes its operation simply because jellyfish are abundant during this time. Chaetognaths consistently occur in all sampling events. This can be explained by the abundance of their food source since chaetognaths’ primary foods are copepods [1].
Zooplankton composition
As shown in Figure 3A, during the full moon, zooplankton was represented by eight different phyla. A large proportion of full moon samples consist of phylum Arthropoda (>50%), particularly copepods (Oithona, Centropages and Acartia, cladocerans (Penelia.), decapods (Lucifer & Brachyuran zoea), and barnacles (Balanus). This was followed by phylum Chordata (39%), consisting of fish eggs, larvae, and Oikopleura sp. Phylum Mollusca and phylum Annelida occurred with a minimum number of individuals collected (4%). Phylum Cnidaria (1%) includes jellyfish larvae and Foraminifera, Chaetognatha (Sagitta), and Echinodermata comprised the remaining parts of the samples (<1%). With fewer samples collected than full moon sampling, zooplankton composition during the last quarter (Figure 3B) did not greatly vary with the full moon results, i.e., samples were constantly dominated or a large fraction of samples belong to phylum Arthropoda except for the increase of phylum Chordata (45%), which is mainly due to the Oikopleura spp. and ichthyoplankton. Phylum Cnidaria, especially jellyfish larvae, tend to increase and are as abundant as Chaetognatha (Sagitta) (2%). In contrast, phylum Annelida decreased as phylum Mollusca reduced in numbers. Foraminifera were not collected again during the last three sampling events. Phylum Echinodermata was also not present during the last quarter sampling.
In Figure 3C, during new moon sampling, which is the same as other sampling events, large samples collected belong to phylum Arthropoda with an increasing number (70%) than the other sampling events. Phylum Chordata (26%) consistently followed this large dominance of phylum Arthropoda. Chaetognatha consistently occurred with lesser (1%) individuals collected. Phylum Echinodermata reappeared during new moon sampling. This was an interesting incident but needed further investigation for its explanation. Phylum Cnidaria notably increased during this sampling event (3%). In the first quarter (Figure 3D), unlike other sampling events, phylum Chordata dominated the collected samples (46%) while phylum Arthropods (44%) was only second in abundance. Chaetognatha continues to occur, slightly increased to 2%, and Cnidaria further increased to 7%. Phylum Echinodermata has less than 1%, Annelida, Mollucsca, and Foraminifera were not collected during this sampling event. Zooplankton tends to decrease as sampling events proceeded, starting from the full moon towards the first quarter.
Zooplankton composition varied from one event to another based on different lunar phases. The Arthropoda tends to increase during the full moon and new moon samplings. In contrast, the Chordata tends to increase during the last quarter and dominates during the first quarter over Arthropoda. Comparing all the sampling events, the Cnidaria increases from the full moon to the first quarter. The Echinodermata was absent last quarter, and Chaetognatha was consistently collected in the sampling events. Still, Foraminifera, Mollusca, and Annelida were only taken during the full moon and last quarter (Figure 4), which coincide with the high tide. The analysis is made only on taxonomic or ecological groups of organisms thought to be important and easy to identify. It is impossible to measure the diversity of an entire community considering all species [8]. The observed high diversity during new moon and full moon sampling may correspond to the sampling time, conditions, and samples collected, i.e., nighttime sampling, its tide levels, and the samples’ composition
Although fewer individuals are present during the new moon than the full moon and last quarter, it has the highest diversity noted on both sampling methods. Most samples belong to phylum Arthropoda during new moon sampling, composed of more than 20 zooplankton taxa, such as the different decapods and copepods. Unlike full moon and last quarter, which has a high abundance or number of collected zooplankton, samples were high. Still, one or two zooplankton taxa just dominated these. The population with a high number of species (taxa) but occur without clear dominance has higher diversity than the low diversity population there are few dominating species or taxa [13]. This statement is true or the same with the results of this study in which full moon and new moon are abundant but dominated by only a few taxa while last and first quarter has less but without domination on its composition. The full moon, which has the 39 zooplankton taxa identified with the highest abundance, ranked only second in diversity. This is due to some taxa that have a meager individual (<5 ind. during the entire sampling period) and those taxa such as Oikupleura, eggs, and copepods that dominate the samples. Thus, there is an imbalance in the population, causing the samples to have lower diversity than the new moon. The diversity decreases when a community becomes dominated by one or fewer species [8]. Diversity tends to increase with an increase in the number of species (taxa), and hence, the number of samples is true in the case of the full moon.
In parallel with a full moon and new moon sampling, the first quarter, which has fewer taxa and samples collected, becomes higher in diversity than last quarter, which is abundance next to the full moon number of samples. These results also correspond to the first reason, i.e., the dominance of species or taxa in a population or samples can cause low diversity. During the last quarter, samples collected are dominated mainly by eggs, barnacles nauplii, Oikopleura sp, and copepods have less diversity compared to the first quarter. Although with fewer species and individuals, the first quarter had a proportionate distribution of samples for every taxon, indicating higher diversity. The higher diversity during the new moon and full moon than the first and last quarter is due to samples collected. Most of the samples belong to the phylum Arthropoda, which comprises many representative taxa during the full moon and new moon. Chordates, composed only of ichthyoplankton with only five representatives, increased and dominated the samples during the last and first quarters. Another possible cause for this high diversity of full moon and the new moon is the incidence of spring tides during these lunar phases.
Horizontal and vertical diversity
Diversity for horizontal towing was higher during new moon and full moon sampling events than last and first quarters. This high diversity was observed from the new moon first, followed by the full moon, first and last quarters. Zooplankton abundance was higher during the full moon and last quarter while less abundant during the new moon and first quarter, opposite to that in diversity index (Table 1). The same with diversity in horizontal towing, the new moon consistently had the highest diversity, followed by the full moon, first quarter, and last quarter. It is also in contrast with the abundance results, in which full moon and last quarter had the highest abundance while new moon and first quarter were lesser.
H’- species diversity; eH- species evenness; * - horizontal sampling; **- vertical sampling
In parallel with full moon and new moon sampling, first quarter which has a smaller number of taxa and samples collected becomes higher in terms of diversity than last quarter which is in terms of abundance is next to full moon number of samples. These results also correspond to the first reason, i.e., dominance of certain species or taxa in a population or samples can cause low diversity. During last quarter, samples collected are dominated mainly by eggs, barnacles nauplii, Oikopleura sp, and copepods have less diversity compared to first quarter. First quarter, although with a smaller number of species and individuals, had a proportionate distribution of samples for every taxon indicating higher diversity. The higher diversity during new moon and full moon compared to first and last quarter is due to samples collected. During full moon and new moon most of the samples belong to phylum Arthropoda which are composed of many representative taxa. Chordates, which is composed only of ichthyoplankton with only 5 representatives increased and dominated the samples during last and first quarters. Another possible caused for this high diversity of full moon and new moon is the incidence of spring tides which occur during these lunar phases, when tide level ranges are at its maximum.
Conclusion and Recommendations
Based on the results, most of the collected samples during the present study coincided with the organisms, which were also found by [3]. Spring phytoplankton bloom triggers zooplankton abundance. Human communities and current patterns affect zooplankton abundance. Arthropods (53%), mainly copepods, decapods, and chordates (38%) such as ichthyoplankton and Oikopleura , are the major zooplankton found in the area. Zooplankton decreases as the sampling event proceeded (full moon, last quarter, new moon, and first quarter). Arthropods are the most dominant during the full moon and new moon, while chordates during the first and last quarters. Sampling time, conditions influence the diversity of zooplankton in this study and samples collected. A more comprehensive correlation study must be conducted, at least three months, to determine whether there is a relationship between zooplankton composition and its abundance regarding the various lunar phases. Physical and chemical parameters, particularly nutrient rates composition such as nitrogen, phosphorus, silicon, and wind direction or current pattern, should be carried out to understand better the plankton’s productivity, which characterizes the area’s overall productivity.
To Know More About Oceanography & Fisheries Open Access Journal Please click on: https://juniperpublishers.com/ofoaj/index.php
For more Open Access Journals in Juniper Publishers please click on: https://juniperpublishers.com/index.php
0 notes
Text
Prospect of Marine Bioactive Peptides as DPP4 Inhibitor

Authored by: Md Morshedul Alam
Abstract
Dipeptidy peptidase 4 (DPP4) is an enzyme that plays important role in metabolism and due to its exacerbating role in glucose metabolism, it is essential to inhibit its function to ameliorate Type 2 Diabetes Mellitus (T2DM). Vildagliptin, sitagliptin and some other drugs are being used worldwide. As a new source, marine derived bioactive peptide having DPP4 inhibitory effect would have a promising role to control its regulatory effect on disease manifestation.
Keywords: DPP4 inhibition; Marine derived origin; Marine bioactive peptide
Abbreviations: DPP4: Dipeptidy Peptidase 4; T2DM: Type 2 Diabetes Mellitus; GIP: Glucose-Dependent Insulinotropic Polypeptide; GLP1: Glucagon-like Peptide-1; ROS: Reactive Oxygen Species, RAGE: Receptor for Advanced Glycation End Products; FDA: Food and Drug Administration; APCs: Antigen-Presenting Cells
Introduction
Dipeptidyl peptidase 4 (DPP4)/CD26 is a serine exopeptidase enzyme that cleaves the N-terminal dipeptides with proline or alanine amino acids from the N-termini of polypeptides leading to regulate the activities of a number of peptide hormones and chemokines. It is known that DPP4 is responsible for the degradation of several incretins such as glucagon-like peptide-1 (GLP1), glucose-dependent insulinotropic polypeptide (GIP), thus regulating the blood glucose level by sensitizing insulin secretion [1]. Upon T cell stimulation, DPP4 expression is markedly up-regulated along with its increased release in soluble form in the blood, which also suggests DPP4 as a T cell co-stimulatory molecule that exerts its effect through binding to adenosine deaminase and interacting with T cell receptor complex. Bunch of studies suggests that DPP4 is a novel adipokine, which is correlated with the amount of adipose tissue inflammation, and insulin resistance as well. Several reports suggest that DPP4 is also released in soluble form exerts lots of cellular effects such as stimulation of reactive oxygen species (ROS), induction of inflammation in smooth muscle cells. Generally, soluble DPP4 interacts to cell surface receptor(s) and executes numerous effects such as activation of T cells, induction of smooth muscle cells inflammation, stimulation of insulin resistance in various tissues, augmentation of CD86 in antigen-presenting cells (APCs), enhancement of smooth muscle cell proliferation, stimulation of reactive oxygen species (ROS) generation and induction of receptor for advanced glycation end products (RAGE) gene expression, and so on [2].
To manage the excessive adverse effects of DPP4 at the cellular level, scientists are suggesting some pharmacological intervention as a drug and in this case vildagliptin, sitagliptin, approved by the Food and Drug Administration (FDA), are most widely used. Beside these two drugs, saxagliptin and alongliptin are also being suggested [3]. Most of the cases these drugs are approved to be used in a combinatorial therapy like in combination with metformin, sulphonylureas, thiazolidinediones etc. As an alternative source of DPP4 inhibitor, marine derived sources would have a great potential in therapy [4] and more specifically marine derived bioactive peptides production would be one of the areas of utmost interest in DPP4 inhibitor activity. It is known that ficin digested gliadins-derived peptides possess strong dipeptidyl peptidase 4 inhibitory activity as well as antihypertensive and antioxidant activities. As a functional food or dietary supplement, marine peptides derived from seaweeds, sponges, fish-skin, fish-bones, fish-scales, mollusks, crustaceans and marine byproducts including substandard muscles, viscera and trimmings would have a great potential targeting DPP4 inhibition. It is known that Gly-Pro-Ala peptide works as a DPP4 inhibitor, which has a great relevance as a natural source for Type II diabetes mellitus (T2DM) management in both in vitro and in vivo through incretin effect. In one study using RubisCO of Halophila stipulacea, a sea grass, lots of bioactive peptides were found by using chymotripsine digestion, which showed strong DPP4 inhibitory activities such as GL, PL, GF, KY, RL, TY, VF. In the same species, trypsine digestion gives DPP4 inhibitory activity with the bioactive peptide sequence of DF. Proteinase K digestion also gives DPP4 inhibitory function with TP, SP, KP, EP, QP, AY, EY, GV, HI, QV, RI, TP and so on. In line with these, pancreatic elastase digestion provides several important bioactive peptide sequences having DPP4 inhibitory role such as RA, PL, WT, ET, KG, KT, NV, RG, and so on [5]. Thus, marine source as a bioactive peptide would have huge potential.
The recent age, blue economy emerged a lot of potential and various countries are now focusing on exploring the marine resources in their coastal region. Various pharmaceutical companies are also searching for new sources of secondary metabolites and as a DPP4 inhibitory agent, bioactive peptide from marine origin would open a new window to explore this field.
To Know More About Oceanography & Fisheries Open Access Journal Please click on: https://juniperpublishers.com/ofoaj/index.php
For more Open Access Journals in Juniper Publishers please click on: https://juniperpublishers.com/index.php
0 notes