
Don't wanna be here? Send us removal request.
Statistics
We looked inside some of the posts by kobbyben and here's what we found interesting.
Average Info
Notes Per Post
1
Likes Per Post
1
Reblog Per Post
0
Reply Per Post
0
Time Between Posts
4 days
Number of Posts By Type
Text
5
Last Seen Tumblr Blogs


Fun Fact
Tumblr.com is the 103rd most visited website in the world.
Text
The univariate graph of the period of heavy drinking of alcohol:

This graph is unimodal, with its highest peak at 40 to 50% period of heavy drinking. It seems to be skewed to the left with higher frequencies at the right.
The univariate graph of the type of coolers consumed in the last 12 months:

This graph is unimodal, with its highest peak at 40 to 50% of the type of coolers consumed in the last 12 months. It seems to be skewed to the right with higher frequencies frequencies at the left.
The univariate graph of the type of beer consumed in the last 12 months:

This graph is unimodal, with its highest peak at 50 to 60% of the type of beer consumed in the last 12 months. It seems to be skewed to the right with higher frequencies at the left.
The univariate graph of the type of wine consumed in the last 12 months:

This graph is unimodal, with its highest peak at 80 to 90% of the type of wine consumed in the last 12 months. It seems to be skewed to the right with higher frequencies at the left.
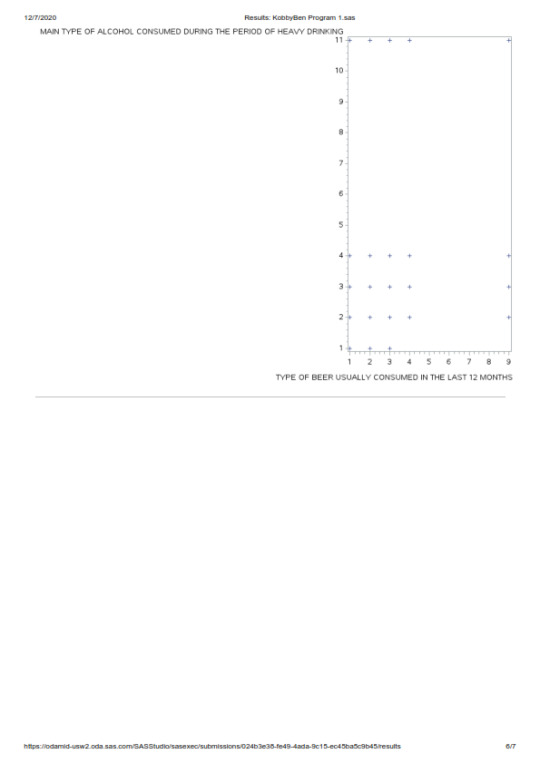
The graph above plots the main type of alcohol consumed during the period of heavy drinking to the type of beer usually consumed in the last 12 months. We can see that the scatter graph does show a clear linear relationship/trend between the two variables.
0 notes
Text
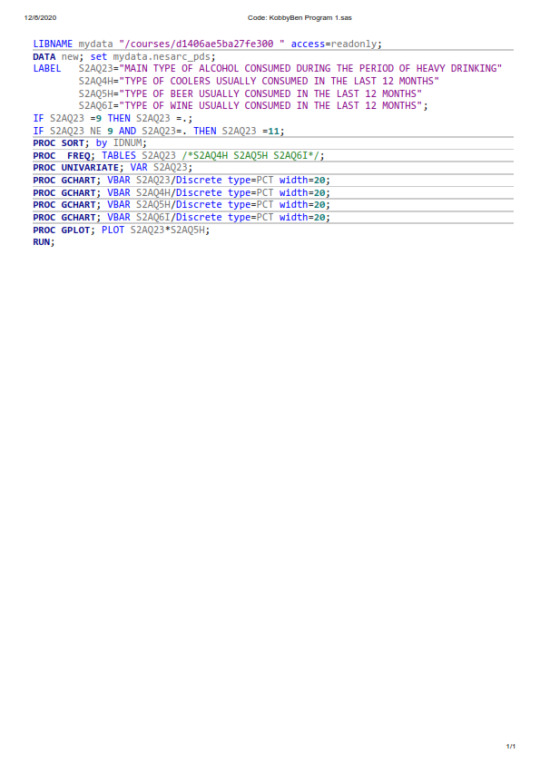
SAS Data Management Assignment 2


In this coding program the missing/unknown data were set aside and also coding was done only in valid data and recorded.
For the data, 4.18% represents coolers, 28.66% represents beer, 8.54% represents wine, 14.50% represents liquor and 44.12% represents people who either abstain or are unknown of the type of alcohol consumed during the period of heaviest drinking.
0 notes
Text
SAS Data Management Assignment 1


A random sample of 43,093 adults were asked the following question, “ What type of alcohol do you consumed during the period of heavy drinking?” Of the total number, about 5.17% chose category 1 which was Coolers, 35.46% chose category 2 which was Beer, 10.57% chose category 3 which was Wine, 17.94% chose category 4 which was Liquor, and 30.94% chose category 9 which was uknown(missing data).
For the next question, the same students were asked “What type of Coolers, Beer and Wine consumed in the last 12 months?
The data gathered are as follows:
For Coolers; about 39.96% chose category 1 which was wine coolers 42.50% chose category 2 which was malt-based coolers, 9.02% chose category 3 which was liquor-based coolers, 7.77% chose 4 which was prepackaged cocktails/mixed drinks and 0.39% chose category 9 which was people who did not drink or unknown if drank wine in last 12 months.
For Beer; about 56.66% chose category 1 which was regular beer 1.61% chose category 2 which was malt liquor, 39.77% chose category 3 which was lite or reduced calorie beer, 1.57% chose 4 which was low-alcohol beer and 0.25% chose category 9 which was people who did not drink or unknown if drank wine in last 12 months.
For Wine; about 82.80% chose category 1 which was regular wine,11.74% chose category 2 which was champagne or sparkling wine, 1.89% chose category 3 which was fortified wine (including sheery, .port, sake), 3.21% chose 4 which was low alcohol fruit-flavored wine and 0.35% chose category 9 which was people who did not drink or unknown if drank wine in last 12 months.
0 notes
Text
Alcohol Consumption
After going through the codebook for the NESARC study, I have decided to pay a close into alcohol consumption. For now I will include all of the relevant variables in my personal codebook. Friends and relatives that I have known over the years consume a large number of alcohols across different periods of time. Some seemed to have irregular drinking behavior and others drink quite often. I am interested in exploring the association between the level of drinking and main type of alcohol consumed. I add to my codebook variables reflecting main type of alcohol consumed during period of heaviest drinking and frequency.
Tape Location Source Code Frequency Item value and description 453-453 S2AQ23 1802 1. Coolers 12351 2. Beer 3681 3. Wine 6248 4. Liquor 10745 9. Unknown 8266 BL. NA, lifetime abstainer
0 notes