
Don't wanna be here? Send us removal request.
Statistics
We looked inside some of the posts by mooreolith and here's what we found interesting.
Average Info
Notes Per Post
18K
Likes Per Post
13K
Reblog Per Post
5K
Reply Per Post
5
Time Between Posts
2 months
Number of Posts By Type
Text
13
Last Seen Tumblr Blogs


Fun Fact
Tumblr was created by web developers David Karp and Marco Arment.
Text
Fresh, Crisp Links
I've taken a break from the graph project to completely redo two other projects, eight-queens and notebook.
Eight Queens now looks much cleaner, no longer generates solutions (don't you love *deleting* code?) but keeps a sort of high score leaderboard of all the solutions in the browser's localStorage (from which they can easily be deleted if needed).
Notebook can now open files from a url query parameter, (like so), and if you use var, you have acess to previously run cells' defined variables. I cleaned up the UI some and made it relatively mobile friendly.
Here are some notebook links:
MicroGrad, a javascript translation of Andrej Karpathy's MicroGrad. It works, but I just figured out why, and don't really know how, just that.
Even Odd I, a generator function that returns true when it's been called an odd number of times, and false when it's been called an even number of times.
Even Odd II, a function returning an is object with properties .odd and .even, generators that return true if both have been called an odd number of times, and false for even.
To play with them, click to open, then select Run Cell.
0 notes
Text
Recent Endeavors
I've been spending time trying to write THE graph visualization. I broke the task down into three parts: A layout-graph, responsible for the layout calculation (where everything should be, at every next step of the animation); a scene-graph, responsible for translating graph construction functions (add/remove vertex/edge) to Three.js function calls; and finally a layer of html5 web component to control the scene-graph.
I might skip the last layer and jump straight to steps 4 and 5, app and profit. Step 1 has room for future improvement. Step 2 turned out pretty good, and step 3 is still in task purgatory.
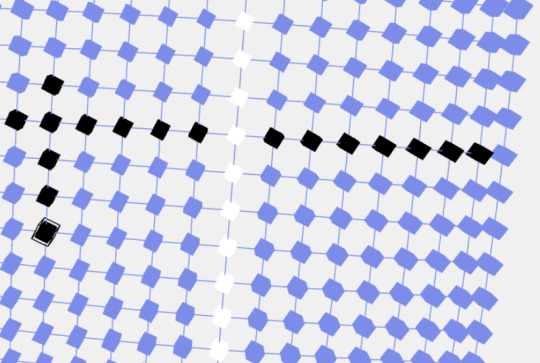
At first, I tried writing the layout-graph in Rust, but quickly ran aground on the sharp ridges ownership rules' various error incarnations. So I gave up on Rust and dug up an old javascript version doing almost exactly the same thing, and already had its constants tweaked. The result is this image.
In other news, the notebook is indeed capable of rendering the scene-graph. Although the mechanism for referring to a specific cell is still somewhat clunky and hard-codey, it also allows you to use all the DOM functions I've learned to love. Buttons, graphs, charts.
0 notes
Text
Ok, so obviously nowhere is being gotten with this... who designed this system. When was this system designed? Where was it designed? How was it designed? and why was it designed.

8K notes
·
View notes
Text
We are chemistry sets looking for mutual love, respect and understanding from other chemistry sets, interpreting each others outward appearances as estimations of each others' chemical compositions, while manipulating our own chemistry sets to perform tricks back and forth with the other chemistry set. Back and forth, back and forth. Until one of them's done playing with the other chemistry set.

10K notes
·
View notes
Text
Forgetting Account Names And Passwords
So, I was online since I was 14 or so. Almost everything requires a password. Over 21 years, that makes a lot of passwords, including easy to remember ones, hard to remember ones, forced to change ones, and a lot of forgotten ones.
For some reason, I never learned to write down my passwords until recently, and now we have password managers (which I recommend... lastpass was a popular, I'm currently using protonmail's.
But the past two decades have been rough on my accounts. There might be a boneyard of pictures and writings (eek!) from a long ago, that I no longer have access to, and that stings.
I guess what I'm trying to say is... I made my user name obvious enough, I think, and if we were separated by a forgotten password, I hope you'll drop me a note.
1 note
·
View note
Text
Mal was anersch: A Bild vo' voagesta

Shot on my Samsung Galaxy S21 in Night Mode at 30x digital zoom.
2 notes
·
View notes
Text
Also, I'm trying to learn and follow the process: This looks serious enough. I made a little repository that includes the same things. It's now called "layout".
Tweaking Constants
I am writing out a barebones physics inspired graph layout calculation (yes, the same one), but without the graphics distractions, in hopes of figuring out suitable constants for the graph, once completed. Perhaps it will even yield a working model I can plug into another visual implementation-attempt, simple-graph.
Drum roll: calculation.js: https://gist.github.com/mooreolith/917381f0fc41aec19722fcf638702d8c
It takes no arguments, (you can fiddle with the variables in the source code, and important ones are module exported) and writes its file outputs to metrics.csv, which you can conveniently import to the spreadsheet application of your choice. At least that's what I'm doing with it.
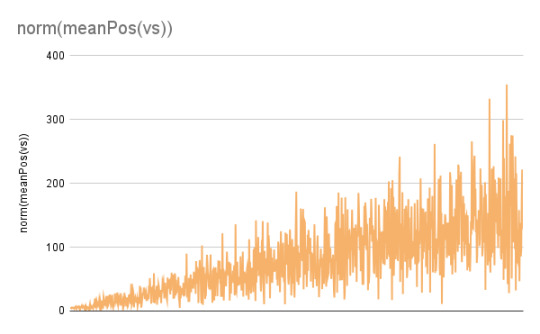
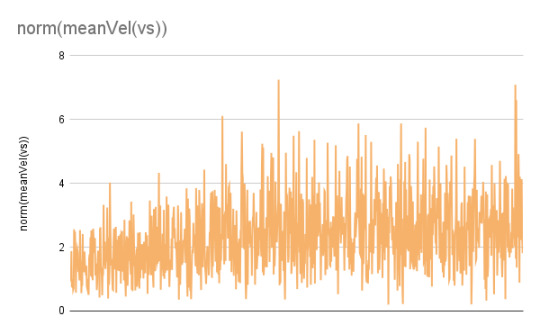
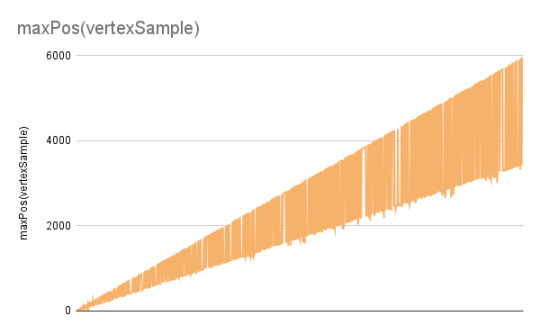
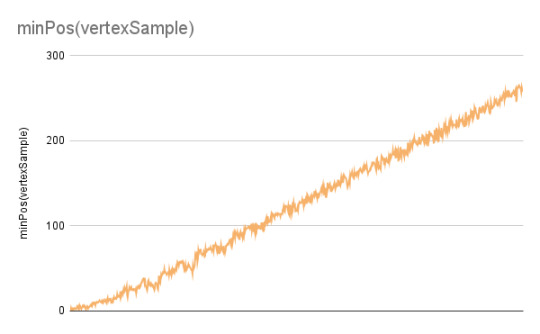
Here we have, from upper left clockwise to lower left:
norm(maxPos(vs)), where vs stands for vertexSample
norm(meanVel(vs))
(norm) minPos(vertexSample)
(norm) maxPos(vertexSample)
The graphs probably show a graph alternatingly swinging into and out of itself, each time gaining momentum, (from one of the misconfigured calculations).
Next I'll try to wire these constants and metrics up to a machine learning library. I don't know how to use these yet, but I'll try to work through the tutorials.
In the meantime, maybe I can approximate how to flatten these curves. This batch is from a thousand iterations of layout().
1 note
·
View note
Text
Tweaking Constants
I am writing out a barebones physics inspired graph layout calculation (yes, the same one), but without the graphics distractions, in hopes of figuring out suitable constants for the graph, once completed. Perhaps it will even yield a working model I can plug into another visual implementation-attempt, simple-graph.
Drum roll: calculation.js: https://gist.github.com/mooreolith/917381f0fc41aec19722fcf638702d8c
It takes no arguments, (you can fiddle with the variables in the source code, and important ones are module exported) and writes its file outputs to metrics.csv, which you can conveniently import to the spreadsheet application of your choice. At least that's what I'm doing with it.
Here we have, from upper left clockwise to lower left:
norm(maxPos(vs)), where vs stands for vertexSample
norm(meanVel(vs))
(norm) minPos(vertexSample)
(norm) maxPos(vertexSample)
The graphs probably show a graph alternatingly swinging into and out of itself, each time gaining momentum, (from one of the misconfigured calculations).
Next I'll try to wire these constants and metrics up to a machine learning library. I don't know how to use these yet, but I'll try to work through the tutorials.
In the meantime, maybe I can approximate how to flatten these curves. This batch is from a thousand iterations of layout().
1 note
·
View note
Text
Spinner Wuerfel

The cubes spin, the edge moves with the cubes, and if you click a cube, a slightly bigger wireframe cube appears. I am rewriting fourd.js. Whereas that time I wrote the constants as scalars, this time I wrote them as Vector3s. Of course, you can turn the scene around, and look at the arrangement of cubes from mutliple angles.
When done, this will be a force directed graph visualization, wrapped in a web component I'm calling simple-graph. It's nothing fancy, there's no webassembly involved, there's no C++ in my webpage. (Not that that's not cool, and I totally still want to do that, again).
Oh, and, and the cubes spin around their x and y axes.
1 note
·
View note
Text
Reading old Code
SOURCES=src/cpp/Settings.h src/cpp/Settings.cpp src/cpp/Vertex.h src/cpp/Vertex.cpp src/cpp/Edge.h src/cpp/Edge.cpp src/cpp/BarnesHutNode3.h src/cpp/BarnesHutNode3.cpp src/cpp/LayoutGraph.h src/cpp/LayoutGraph.cpp src/cpp/DynamicMatching.h src/cpp/DynamicMatching.cpp
Line 8 from my Makefile responsible for compiling the C++ source into WebAssembly. Just like Assembly runs against your machine, and thus provides a target for high level languages to compile to, your WebAssembly runs on a WebAssembly RunTime, and can be targeted by high level languages like C++, or, as I hear, Rust.
Vertex, Edge, Graph, BarnesHutNode3, DynamicMatching
My problem is that I have no idea if these are even correct (and every reason to doubt it), at the same time that I'm trying to guess at the correct value for the settings, with the help of some machine learning I'm unfamiliar with.
I'm trying to get it all done at once.
The Graph should be self explanatory, the BarnesHutNode3 is like a six sided die, it's a way of recursively dicing up space six ways (three axis, x, y, and z) for the purpose of grouping calculations normally done on pairs of vertices. The calculation can then be performed using pairs of these groups, or a vertex and a group, saving time and energy.
The Dynamic Matching is described by Veldhuizen (2007). It's like a Proxy for the Graph, in that it reacts to the Graph's add/remove vertex/edge methods, adding some behavior of its own. Roughly speaking, it's a type of structure "derived" from the graph, a summary, which consulted before calculating the rest of the layout can guide it, making the calculation more efficient.
Previous versions I've implemented closely following the math of the paper have gotten 1,000 vertices drawn comfortably, but left out the dynamic matching part. This version has it, maybe. I should probably reread that old code, which is the hardest thing to do.
0 notes
Text
Introduction
Hi, you might not know me, so here's a little introduction. I'm hoping to make some new friends here.
My name is Josh, I'm 35 years old, grew up in Bamberg, Germany, and currently live in North Las Vegas, Nevada in the United States.
I studied Computer Science and Software Engineering in college, though not to completion. There's a certain kind of irony in studying the tools of the HR trade used to filter me out of a decent living. Oh well.
I'm currently staying with my parents, and life is... good. I am working on a 20th century paper called Dynamic Multilevel Graph Visualization. I have a C++ core that does the layout calculations, but I am stuck on configuring it/ensuring the calculation is entered correctly.
My aim is to use a machine learning library to guess sane starting values for these settings.
1 note
·
View note

