
Don't wanna be here? Send us removal request.
Statistics
We looked inside some of the posts by mymlstudies and here's what we found interesting.
Average Info
Notes Per Post
2
Likes Per Post
2
Reblog Per Post
0
Reply Per Post
0
Time Between Posts
21 days
Number of Posts By Type
Text
4
Last Seen Tumblr Blogs


Fun Fact
Forty percent of Tumblr users are between the ages of 18 to 25.
Text
K-means Titanic
k-means cluster analysis was conducted to identify underlying subgroups of test data in the Kaggle titanic survival simulation scenario.
based on few passenger records on 4~6 variables that can possibly predict survivability on the titanic event.
Clustering variables measuring whether or not a passenger would be survived. Variables are Age, Fare, Embarked, Class, Sex, and Siblings. All clustering variables were standardized to have a mean of 0 and a standard deviation of 1.
Data were randomly split into a training set that included 70% of the observations (N=499) and a test set that included 30%. A series of k-means cluster analyses were conducted on the training data specifying k=1-9 clusters, using Euclidean distance. The variance in the clustering variables that was accounted for by the clusters (r-square) was plotted for each of the nine cluster solutions in an elbow curve to provide guidance for choosing the number of clusters to interpret.
Figure 1. Elbow curve of r-square values for the nine cluster solutions
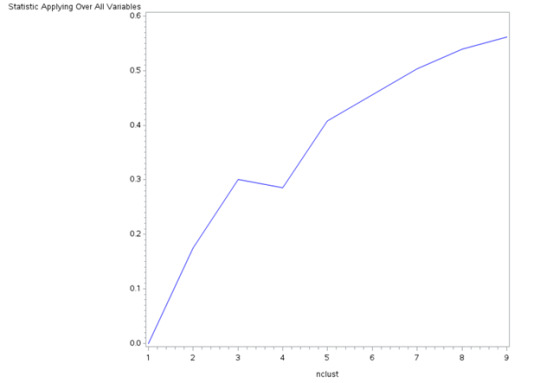
The elbow curve was inconclusive, suggesting that the 3 and 4-cluster solutions might be interpreted. The results below are for an interpretation of the 4-cluster solution.
Figure 2. Plot of the first two canonical variables for the clustering variables by cluster.
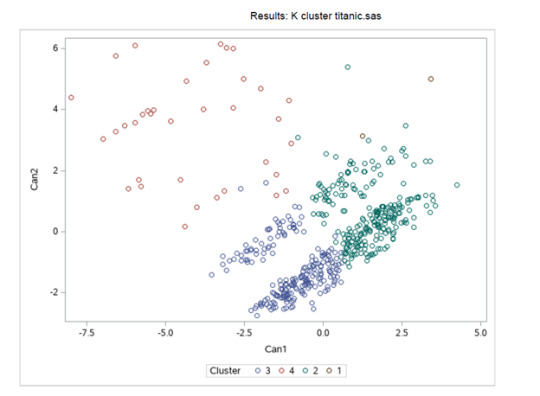
Canonical discriminant analyses were used to reduce the 9-clustering variable down a few variables that accounted for most of the variance in the clustering variables. A scatterplot of the first two canonical variables by cluster (Figure 2 shown below) indicated that the observations in clusters 2 and 3 were densely packed with relatively low within cluster variance, and did not overlap very much with the other clusters. Cluster 1 was generally distinct, but the observations had greater spread suggesting higher within cluster variance. Observations in cluster 4 were spread out more than the other clusters, showing high within cluster variance. The results of this plot suggest that the best cluster solution may have fewer than 4 clusters, so it will be especially important to also evaluate the cluster solutions with only 2 clusters.
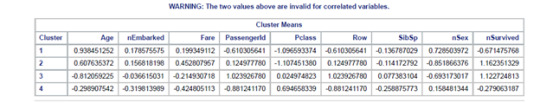
The means on the clustering variables showed that, compared to the other clusters, nSurvived in cluster 2 and 3 had more chances to survived on the clustering variables. Compared to other clusters with less than 1 cluster means. Does having these groups with nSex closer to be with more composed of men and less likely to have siblings on board. Also with age group on the mid ranges. While Embarked, Fare, and Pclass shows no apparent significance.
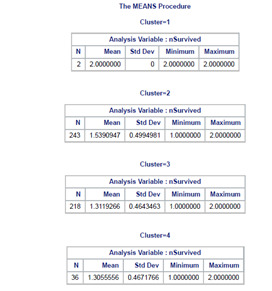
In order to externally validate the clusters, an Analysis of Variance (ANOVA) was conducting to test for significant differences between the clusters on nSurvived. Cluster 1 is neglected due to its few sample size.

SAS Code Used:
data clust;
set SASUSER.titanic;
if Sex="male" then nSex=2;
if Sex="female" then nSex=1;
if Embarked="S" then nEmbarked=1;
if Embarked="C" then nEmbarked=2;
if Embarked="Q" then nEmbarked=3;
if Survived=0 then nSurvived=1;
if Survived=1 then nSurvived=2;
idnum=_n_;
keep idnum Age nEmbarked Fare PassengerId Pclass Row nSex SibSp nSurvived;
if cmiss(of _all_) then delete;
run;
ods graphics on;
proc surveyselect data=clust out=traintest seed = 123
samprate=0.7 method=srs outall;
run;
data clus_train;
set traintest;
if selected=1;
run;
data clus_test;
set traintest;
if selected=0;
run;
proc standard data=clus_train out=clustvar mean=0 std=1;
var Age nEmbarked Fare PassengerId Pclass Row nSex SibSp nSurvived;
run;
%macro kmean(K);
proc fastclus data=clustvar out=outdata&K. outstat=cluststat&K. maxclusters= &K. maxiter=300;
var Age nEmbarked Fare PassengerId Pclass Row SibSp nSex nSurvived;
run;
%mend;
%kmean(1);
%kmean(2);
%kmean(3);
%kmean(4);
%kmean(5);
%kmean(6);
%kmean(7);
%kmean(8);
%kmean(9);
data clus1;
set cluststat1;
nclust=1;
if _type_='RSQ';
keep nclust over_all;
run;
data clus2;
set cluststat2;
nclust=2;
if _type_='RSQ';
keep nclust over_all;
run;
data clus3;
set cluststat3;
nclust=3;
if _type_='RSQ';
keep nclust over_all;
run;
data clus4;
set cluststat4;
nclust=4;
if _type_='RSQ';
keep nclust over_all;
run;
data clus5;
set cluststat5;
nclust=5;
if _type_='RSQ';
keep nclust over_all;
run;
data clus6;
set cluststat6;
nclust=6;
if _type_='RSQ';
keep nclust over_all;
run;
data clus7;
set cluststat7;
nclust=7;
if _type_='RSQ';
keep nclust over_all;
run;
data clus8;
set cluststat8;
nclust=8;
if _type_='RSQ';
keep nclust over_all;
run;
data clus9;
set cluststat9;
nclust=9;
if _type_='RSQ';
keep nclust over_all;
run;
data clusrsquare;
set clus1 clus2 clus3 clus4 clus5 clus6 clus7 clus8 clus9;
run;
* plot elbow curve using r-square values;
symbol1 color=blue interpol=join;
proc gplot data=clusrsquare;
plot over_all*nclust;
run;
* plot clusters for 4 cluster solution;
proc candisc data=outdata4 out=clustcan;
class cluster;
var Age nEmbarked Fare PassengerId Pclass Row SibSp nSex nSurvived;
run;
proc sgplot data=clustcan;
scatter y=can2 x=can1 / group=cluster;
run;
* validate clusters on GPA;
* first merge clustering variable and assignment data with GPA data;
data gpa_data;
set clus_train;
keep idnum SVD1;
run;
proc sort data=outdata4;
by idnum;
run;
proc sort data=SVD_data;
by idnum;
run;
data merged;
merge outdata4 SVD_data;
by idnum;
run;
proc sort data=merged;
by cluster;
run;
proc means data=merged;
var SVD1;
by cluster;
run;
proc anova data=merged;
class cluster;
model SVD1 = cluster;
means cluster/tukey;
run;
Thanks for reading!!!
0 notes
Text
Lasso Regression Assignment
Using the same survival dataset Titanic from https://www.kaggle.com/c/titanic
I used this as my simulation of the lasso regression finding the best model. Although the Titanic dataset only has few predictors I would select top 3 as my very best predictors out from the lasso regression results run using SAS studio. Below you'll see the SAS code used.
data new;
set SASUSER.titanic;
if Sex="male" then nSex=2;
if Sex="female" then nSex=1;
if survived=0 then nSurvived=1;
if survived=1 then nSurvived=2;
* delete observations with missing data;
ods graphics on;
* Split data randomly into test and training data;
proc surveyselect data=new out=traintest seed = 123
samprate=0.7 method=srs outall;
run;
* lasso multiple regression with lars algorithm k=10 fold validation;
proc glmselect data=traintest plots=all seed=123;
partition ROLE=selected(train='1' test='0');
model nSurvived = Pclass nSex Age SibSp Fare
/selection=lar(choose=cv stop=none) cvmethod=random(10);
run;
I find SAS Studio to be very easy to work with as it has a user interface and complier combined. Based on the results.
Top 3 predictors are:
Sex, Passenger Class Designation, Fare paid in value.


And test and train shows similar outcomes as seen on the ASE.


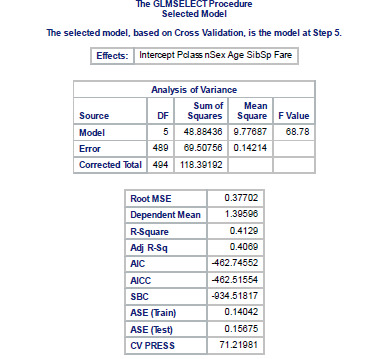
Therefore, predictors for best survival according to simulated values are Sex, Pclass, & Fare . Best model is the whole dataset considering it only has few variables. Excluding class type data [embarked]
0 notes
Text
Random Forest Assignment
For this next assignment I’m still using the Titanic dataset to simulate a random forest. The main goal is to see only the critical explanatory variable with the high importance using GINI. The response variable is still the survival 0 – didn’t survive 1 – survive. This is simulation will help us focus on the few variables that has the best fit actually predict the outcome which is who will likely will survive. So let’s get to it.
Using SAS Enterprise Miner to simulate the dataset is what I’ve chosen simple because I wanted to try a no-code option and to best illustrate the results. Below is the model diagram used:

At this point, I've already configured the variables for everything to run the simulation. The results are:
Sex, Row, Fare, & Age are the important Var to consider ThanKs for reading!


0 notes
Text
Classification Tree
Project title: Applied SAS classification tree using known dataset online (Week 1 Assignment)

Decision tree analysis was performed to test nonlinear relationships among a series of explanatory variables and a binary, categorical response variable. All possible separations (categorical) or cut points (quantitative) are tested. A popular dataset for classification tree was used for illustration purpose only. Titanic dataset is perfect to try to create a decision tree. The goal is to create a relatively easy to make decision tree that will represent the response variable who will survived on the titanic illustrated using the decision tree. I took the liberty of excluding some columns from the original dataset that are considered to be unique text type data to focus on categorical and numerical data that are relevant to the decision tree. The following explanatory variables were included as possible contributors to a classification tree model evaluating survived experimentation (my response variable), PassengerId, Pclass, Sexnum, Age, SibSp, Parch, Fare, Embarkednum are the only columns used and coded. For the this survived analyses, the entropy “goodness of split” criterion was used to grow the tree and a cost complexity algorithm was used for pruning the full tree into a final subtree. Decision tree model shows AUC values of range 0.88 ~ 0.89 indicating considerable acceptable results. While also checking different random seed still giving similar decision tree and AUC to check bias-variance.

The Sexnum was the first variable to separate the sample into two subgroups. Split between male and female. Giving relative & importance scores of (1, 11). Proving to be the most significant explanatory variable. From the train dataset females tends to survive 74% compared to males with only 19%. Of the Sexnum (gender), a further subdivision was made with the Pclass variable of 1st 2nd 3rd class. Wherein 1st and 2nd class more likely to survive for females. For males 2nd or 3rd class has a slight chance to survive. The last important explanatory variable is Age. Showing high chance to survive for female above the age of 25 and very minimal chance for males ages 9 to 28.


Dataset for reference only
https://www.kaggle.com/c/titanic
2 notes
·
View notes