
Don't wanna be here? Send us removal request.
Statistics
We looked inside some of the posts by naveenkrishna002 and here's what we found interesting.
Average Info
Notes Per Post
2
Likes Per Post
2
Reblog Per Post
0
Reply Per Post
0
Number of Posts By Type
Text
1
Last Seen Tumblr Blogs


Fun Fact
Tumblr Inc. is using 66 technologies for its website.
Text
Unveiling Market Insights: Exploring the Sampling Distribution, Standard Deviation, and Standard Error of NIFTY50 Volumes in Stock Analysis
Introduction:
In the dynamic realm of stock analysis, exploring the sampling distribution, standard deviation, and standard error of NIFTY50 volumes is significant. Providing useful tools for investors, these statistical insights go beyond abstraction. When there is market volatility, standard deviation directs risk evaluation. Forecasting accuracy is improved by the sample distribution, which functions similarly to a navigational aid. Reliability of estimates is guaranteed by standard error. These are not only stock-specific insights; they also impact portfolio construction and enable quick adjustments to market developments. A data-driven strategy powered by these statistical measurements enables investors to operate confidently and resiliently in the financial world, where choices are what determine success.
NIFTY-50 is the tracker of Indian Economy, the index is frequently evaluated and re-equalizing to make sure it correctly affects the shifting aspects of the economic landscape in India. Extensively pursued index, this portrays an important role in accomplishing, investment approach ways and market analyses.
Methodology
The data was collected from Kaggle, with the (dimension of 2400+ rows and 8 rows, which are: date, open, close, high, low, volume, stock split, dividend. After retrieving data from the data source, we cleaned the null values and unnecessary columns from the set using Python Programming. We removed all the 0 values from the dataset and dropped all the columns which are less correlated.
After completing all the pre-processing techniques, we imported our cleaned values into RStudio for further analysis of our dataset.
Findings:
Our aim lies in finding how the samples are truly representing the volume. So, for acquiring our aim, we first took a set of samples of sizes 100 and 200 respectively. Then we performed some calculations separately on both of the samples for finding the mean, standard deviation, sampling distribution and standard error. At last we compared both of the samples and found that the mean and the standard deviation of the second sample which is having the size of 200 is more closely related to the volume.
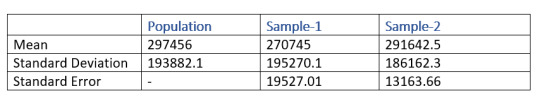
From the above table, the mean of the sample-2 which has a size of 200 entity is 291642.5 and the mean of the sample-1 is 270745. From this result, it is clear that sample-2 is better representative of the volume as compared to sample-1
Similarly, when we take a look at the standard error, sample-2 is lesser as compared to sample-1. Which means that the sample-2 is more likely to be closer to the volume.
Population Distribution.
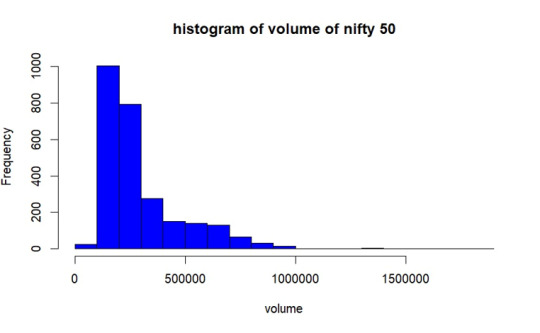
As per the graph, In most of the days from the year 2017 to 2023 December volume of trading of NIFTY50 was between 1lakh- 2.8lakhs.
Sample Selection
We are taking 2 sample set having 100 and 200 of size respectively without replacement. Then we obtained mean, standard deviation and standard error of both of the samples.
Sampling Distribution of Sample- 1
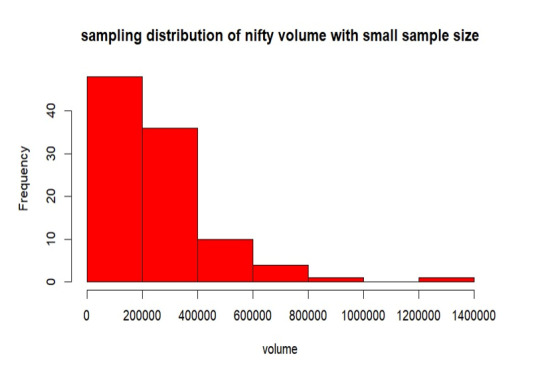
From the above graph, the samples are mostly between 0 to 2 lakhs of volume. Also, the samples are less distributed throughout the population. The mean is 270745, standard deviation is 195270.5 and the standard error of sampling is 19527.01.
Sampling Distribution of Sample- 2
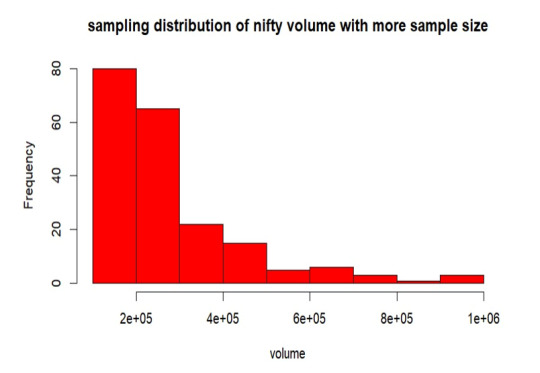
From the above graph, the samples are mostly between 0 to 2 lakhs of volume. Also, the samples are more distributed than the sample-1 throughout the volume. The mean is 291642.5, standard deviation is 186162.3 and the standard error of sampling is 13163.66.
Replication of Sample- 1
Here, we are duplicating the mean of every sample combination while taking into account every conceivable sample set from our volume. This suggests that the sample size is growing in this instance since the sample means follow the normal distribution according to the central limit theorem.
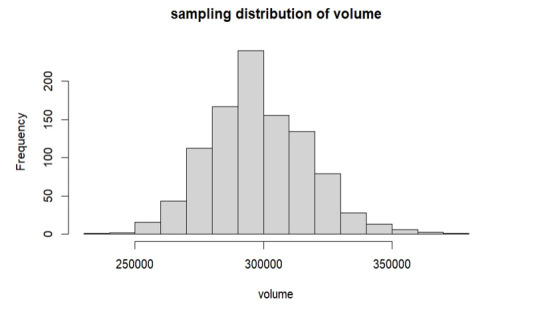
As per the above graph, it is clear that means of sample sets which we have replicated follows the normal distribution, from the graph the mean is around 3 lakhs which is approximately equals to our true volume mean 297456 which we have already calculated.
Conclusion
In the observed trading volume range of 2 lakhs to 3 lakhs, increasing the sample size led to a decrease in standard error. The sample mean converges to the true volume mean as sample size increases, according to this trend. Interestingly, the resulting sample distribution closely resembles the population when the sample mean is duplicated. The mean produced by this replication process is significantly more similar to the population mean, confirming the central limit theorem's validity in describing the real features of the trade volume.
2 notes
·
View notes