
Don't wanna be here? Send us removal request.
Statistics
We looked inside some of the posts by omega1010 and here's what we found interesting.
Average Info
Notes Per Post
1
Likes Per Post
1
Reblog Per Post
0
Reply Per Post
0
Time Between Posts
6 days
Number of Posts By Type
Text
5
Last Seen Tumblr Blogs


Fun Fact
Premium Tumblr themes are available from anywhere between $9 to $49.
Text
Data Management and Visualization - Week 4
Hi, This is Tarun Rao. I am writing this Blog post on Tumblr to showcase my assignments of the Data Management and Visualization Course on Coursera.
Assignment - 4
In this assignment, we have to represent our variables in visual form like graphs. In this case, all of the variables(Income, Alcohol & Life) are quantitative variables. Therefore I firstly plot each univariant and then plot the scatter plot(Q → Q) for the bivariant graph for each research question. After that, I divided them into categories (concert quantitative to categorical). Then again univariant graph of all and bar chart(c →c) for the bivariant graph.
Step 1: Univariant graphs of all the variables (Quantitative)


Step 2: Bivariant graph for research question


Step 3: Conversation from quantitative to categorical

Univariant graphs of all the variables


Step 5: Bivariant graph

Conclusion
From the scatter plot , it seems like these variables are not correlated but from the bar chart we can say that , If gambling is less, Alcohol consumption is less we can say that moderate alcohol consumption can contribute to more alcohol consumption.
0 notes
Text
Data Management and Visualization - Week 3
Hi, This is Tarun Rao. I am writing this Blog post on Tumblr to showcase my assignments of the Data Management and Visualization Course on Coursera.
Assignment 3
We have to implement data management decisions for our chosen variables. Data management decisions include coding out missing data, coding in valid data, recoding variables etc.
My Program
# -*- coding: utf-8 -*- """ Spyder Editor
This is a temporary script file. """
import pandas import numpy # any additional libraries would be imported here
data = pandas.read_csv('nesarc_pds.csv', low_memory=False)
# bug fix for display formats to avoid run time errors - put after code for loading data above pandas.set_option('display.float_format', lambda x:'%f'%x)
print (len(data)) #number of observations (rows) print (len(data.columns)) # number of variables (columns)
print()
#counts and percentages (i.e. frequency distributions) for each variable print('counts for S12Q1 – EVER GAMBLED 5+ TIMES IN ANY ONE YEAR') c1 = data['S12Q1'].value_counts(sort=False) print (c1)
print()
print('percentages for S12Q1 – EVER GAMBLED 5+ TIMES IN ANY ONE YEAR') p1 = data['S12Q1'].value_counts(sort=False, normalize=True) print (p1)
print()
print('counts for S12Q2B1 – HAPPEN IN THE LAST 12 MONTHS') c2 = data['S12Q2B1'].value_counts(sort=False, dropna=False) print(c2)
print()
print('percentages for S12Q2B1 – HAPPEN IN THE LAST 12 MONTHS') p2 = data['S12Q2B1'].value_counts(sort=False, dropna=False, normalize=True) print (p2)
print()
print('counts for CONSUMER – DRINKING STATUS') c3 = data['CONSUMER'].value_counts(sort=False) print(c3)
print()
print('percentages for CONSUMER – DRINKING STATUS') p3 = data['CONSUMER'].value_counts(sort=False, normalize=True) print (p3)
print()
print('counts for S2AQ8E – HOW OFTEN DRANK 5+ DRINKS OF ANY ALCOHOL IN LAST 12 MONTHS') c4 = data['S2AQ8E'].value_counts(sort=False, dropna=False) print(c4)
print()
print('percentages for S2AQ8E – HOW OFTEN DRANK 5+ DRINKS OF ANY ALCOHOL IN LAST 12 MONTHS') p4 = data['S2AQ8E'].value_counts(sort=False, dropna=False, normalize=True) print (p4)
print()
print('counts for S2AQ10 – HOW OFTEN DRANK ENOUGH TO FEEL INTOXICATED IN LAST 12 MONTHS') c5 = data['S2AQ10'].value_counts(sort=False, dropna=False) print(c5)
print()
print('percentages for S2AQ10 – HOW OFTEN DRANK ENOUGH TO FEEL INTOXICATED IN LAST 12 MONTHS') p5 = data['S2AQ10'].value_counts(sort=False, dropna=False, normalize=True) print (p5)
# recode missing values to python missing (NaN) data['S12Q1']=data['S12Q1'].replace(9, numpy.nan) data['S12Q2B1']=data['S12Q2B1'].replace(9, numpy.nan) data['S2AQ8E']=data['S2AQ8E'].replace(99, numpy.nan) data['S2AQ10']=data['S2AQ10'].replace(99, numpy.nan)
#if you want to include a count of missing add ,dropna=False after sort=False print('counts for S12Q1 with 9 set to NAN and number of missing requested') MC1 = data['S12Q1'].value_counts(sort=False, dropna=False) print(MC1)
print('counts for S12Q2B1 with 9 set to NAN and number of missing requested') MC2 = data['S12Q2B1'].value_counts(sort=False, dropna=False) print(MC2)
print('counts for CONSUMER – DRINKING STATUS') c3 = data['CONSUMER'].value_counts(sort=False, dropna=False) print(c3)
print('counts for S2AQ8E with 99 set to NAN and number of missing requested') MC3 = data['S2AQ8E'].value_counts(sort=False, dropna=False) print(MC3)
data['S2AQ10']=data['S2AQ10'].replace(99, numpy.nan)
print('counts for S2AQ10 with 99 set to NAN and number of missing requested') MC4 = data['S2AQ10'].value_counts(sort=False, dropna=False) print(MC4)
#coding in valid data data['S2AQ8E'].fillna(100, inplace=True) data['S2AQ10'].fillna(100, inplace=True) data['S12Q2B1'].fillna(100, inplace=True)
print ('S2AQ8E with Blanks recoded as 20 and 99 set to NAN') # check coding chk2 = data['S2AQ8E'].value_counts(sort=False, dropna=False) print(chk2)
print ('S2AQ10 with Blanks recoded as 20 and 99 set to NAN') # check coding chk3 = data['S2AQ10'].value_counts(sort=False, dropna=False) print(chk3)
print ('S12Q2B1 with Blanks recoded as 3 and 99 set to NAN') # check coding chk4 = data['S12Q2B1'].value_counts(sort=False, dropna=False) print(chk4)
#recoding values for S2AQ8E into a new variable, RECODES2AQ8E recode1 = {1: 365, 2: 300, 3: 115, 4: 96, 5: 48, 6: 30, 7: 12, 8: 9, 9: 4.5, 10: 1.5, 11: 0} data['RECODES2AQ8E']= data['S2AQ8E'].map(recode1)
#recoding values for S2AQ10 into a new variable, RECODES2AQ10 recode2 = {1: 365, 2: 300, 3: 115, 4: 96, 5: 48, 6: 30, 7: 12, 8: 9, 9: 4.5, 10: 1.5, 11: 0} data['RECODES2AQ10']= data['S2AQ10'].map(recode2)
print ('RECODES2AQ8E with Blanks recoded as 20 and 99 set to NAN') # check coding chk5 = data['RECODES2AQ8E'].value_counts(sort=False, dropna=False) print(chk5)
print ('RECODES2AQ10 with Blanks recoded as 20 and 99 set to NAN') # check coding chk6 = data['RECODES2AQ10'].value_counts(sort=False, dropna=False) print(chk6)
#examining frequency distributions for age print('counts for AGE') c6 = data['AGE'].value_counts(sort=False) print(c6)
print('percentages for AGE') p6 = data['AGE'].value_counts(sort=False, normalize=True) print (p6)
# quartile split (use qcut function & ask for 4 groups - gives you quartile split) print ('AGE - 4 categories - quartiles') data['AGEGROUP4']=pandas.qcut(data.AGE, 4, labels=["1=0%tile","2=25%tile","3=50%tile","4=75%tile"]) c7 = data['AGEGROUP4'].value_counts(sort=False, dropna=True) print(c7)
# categorize quantitative variable based on customized splits using cut function # splits into 3 groups (18-20, 21-22, 23-25) - remember that Python starts counting from 0, not 1 data['AGEGROUP3'] = pandas.cut(data.AGE, [17, 20, 22, 25]) c8 = data['AGEGROUP3'].value_counts(sort=False, dropna=True) print(c8)
# bug fix for display formats to avoid run time errors - put after code for loading data above pandas.set_option('display.float_format', lambda x:'%f'%x)
Output
runfile('C:/Data-Management-And-Visualization/Week2/nesarc1.py', wdir='C:/Data-Management-And-Visualization/Week2') 43093 3010
counts for S12Q1 – EVER GAMBLED 5+ TIMES IN ANY ONE YEAR 1 11153 2 30885 9 1055 Name: S12Q1, dtype: int64
percentages for S12Q1 – EVER GAMBLED 5+ TIMES IN ANY ONE YEAR 1 0.258812 2 0.716706 9 0.024482 Name: S12Q1, dtype: float64
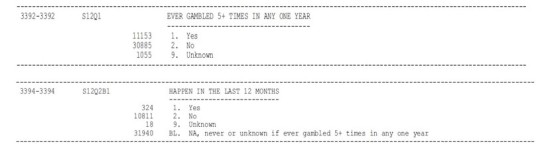
counts for S12Q2B1 – HAPPEN IN THE LAST 12 MONTHS 1 324 2 10811 9 18 31940 Name: S12Q2B1, dtype: int64
percentages for S12Q2B1 – HAPPEN IN THE LAST 12 MONTHS 1 0.007519 2 0.250876 9 0.000418 0.741188 Name: S12Q2B1, dtype: float64
counts for CONSUMER – DRINKING STATUS 1 26946 2 7881 3 8266 Name: CONSUMER, dtype: int64
percentages for CONSUMER – DRINKING STATUS 1 0.625299 2 0.182884 3 0.191818 Name: CONSUMER, dtype: float64
counts for S2AQ8E – HOW OFTEN DRANK 5+ DRINKS OF ANY ALCOHOL IN LAST 12 MONTHS 99 164 11 18892 4 787 1 356 2 288 8 619 3 605 7 854 5 950 6 929 9 1169 10 1333 16147 Name: S2AQ8E, dtype: int64
percentages for S2AQ8E – HOW OFTEN DRANK 5+ DRINKS OF ANY ALCOHOL IN LAST 12 MONTHS 99 0.003806 11 0.438401 4 0.018263 1 0.008261 2 0.006683 8 0.014364 3 0.014039 7 0.019818 5 0.022045 6 0.021558 9 0.027127 10 0.030933 0.374701 Name: S2AQ8E, dtype: float64
counts for S2AQ10 – HOW OFTEN DRANK ENOUGH TO FEEL INTOXICATED IN LAST 12 MONTHS 99 200 11 17436 4 272 1 167 2 109 8 601 3 184 7 902 5 510 6 539 9 1690 10 4336 16147 Name: S2AQ10, dtype: int64
percentages for S2AQ10 – HOW OFTEN DRANK ENOUGH TO FEEL INTOXICATED IN LAST 12 MONTHS 99 0.004641 11 0.404613 4 0.006312 1 0.003875 2 0.002529 8 0.013947 3 0.004270 7 0.020931 5 0.011835 6 0.012508 9 0.039218 10 0.100620 0.374701 Name: S2AQ10, dtype: float64 counts for S12Q1 with 9 set to NAN and number of missing requested NaN 1055 2.000000 30885 1.000000 11153 Name: S12Q1, dtype: int64 counts for S12Q2B1 with 9 set to NAN and number of missing requested 1 324 2 10811 9 18 31940 Name: S12Q2B1, dtype: int64 counts for CONSUMER – DRINKING STATUS 1 26946 2 7881 3 8266 Name: CONSUMER, dtype: int64 counts for S2AQ8E with 99 set to NAN and number of missing requested 99 164 11 18892 4 787 1 356 2 288 8 619 3 605 7 854 5 950 6 929 9 1169 10 1333 16147 Name: S2AQ8E, dtype: int64 counts for S2AQ10 with 99 set to NAN and number of missing requested 99 200 11 17436 4 272 1 167 2 109 8 601 3 184 7 902 5 510 6 539 9 1690 10 4336 16147 Name: S2AQ10, dtype: int64 S2AQ8E with Blanks recoded as 20 and 99 set to NAN 99 164 11 18892 4 787 1 356 2 288 8 619 3 605 7 854 5 950 6 929 9 1169 10 1333 16147 Name: S2AQ8E, dtype: int64 S2AQ10 with Blanks recoded as 20 and 99 set to NAN 99 200 11 17436 4 272 1 167 2 109 8 601 3 184 7 902 5 510 6 539 9 1690 10 4336 16147 Name: S2AQ10, dtype: int64 S12Q2B1 with Blanks recoded as 3 and 99 set to NAN 1 324 2 10811 9 18 31940 Name: S12Q2B1, dtype: int64 RECODES2AQ8E with Blanks recoded NaN 43093 Name: RECODES2AQ8E, dtype: int64 RECODES2AQ10 with Blanks recoded NaN 43093 Name: RECODES2AQ10, dtype: int64 counts for AGE 32 873 64 453 96 13 33 846 65 448
62 454 94 24 31 861 63 458 95 16 Name: AGE, Length: 81, dtype: int64 percentages for AGE 32 0.020259 64 0.010512 96 0.000302 33 0.019632 65 0.010396
62 0.010535 94 0.000557 31 0.019980 63 0.010628 95 0.000371 Name: AGE, Length: 81, dtype: float64 AGE - 4 categories - quartiles 1=0%tile 11269 2=25%tile 10779 3=50%tile 10472 4=75%tile 10573 Name: AGEGROUP4, dtype: int64 (17, 20] 2183 (20, 22] 1482 (22, 25] 2173 Name: AGEGROUP3, dtype: int64
Conclusion
I have chosen 5 variables. So I have 5 frequency distribution tables. I have taken several data management decisions. These include coding out missing data, coding in valid data, recoding variables and grouping variables.
0 notes
Text
Data Management and Visualization - Week 3
Hi, This is Tarun Rao. I am writing this Blog post on Tumblr to showcase my assignments of the Data Management and Visualization Course on Coursera.
Assignment 3
We have to implement data management decisions for our chosen variables. Data management decisions include coding out missing data, coding in valid data, recoding variables etc.
My Program
# -*- coding: utf-8 -*- """ Spyder Editor
This is a temporary script file. """
import pandas import numpy # any additional libraries would be imported here
data = pandas.read_csv('nesarc_pds.csv', low_memory=False)
# bug fix for display formats to avoid run time errors - put after code for loading data above pandas.set_option('display.float_format', lambda x:'%f'%x)
print (len(data)) #number of observations (rows) print (len(data.columns)) # number of variables (columns)
print()
#counts and percentages (i.e. frequency distributions) for each variable print('counts for S12Q1 – EVER GAMBLED 5+ TIMES IN ANY ONE YEAR') c1 = data['S12Q1'].value_counts(sort=False) print (c1)
print()
print('percentages for S12Q1 – EVER GAMBLED 5+ TIMES IN ANY ONE YEAR') p1 = data['S12Q1'].value_counts(sort=False, normalize=True) print (p1)
print()
print('counts for S12Q2B1 – HAPPEN IN THE LAST 12 MONTHS') c2 = data['S12Q2B1'].value_counts(sort=False, dropna=False) print(c2)
print()
print('percentages for S12Q2B1 – HAPPEN IN THE LAST 12 MONTHS') p2 = data['S12Q2B1'].value_counts(sort=False, dropna=False, normalize=True) print (p2)
print()
print('counts for CONSUMER – DRINKING STATUS') c3 = data['CONSUMER'].value_counts(sort=False) print(c3)
print()
print('percentages for CONSUMER – DRINKING STATUS') p3 = data['CONSUMER'].value_counts(sort=False, normalize=True) print (p3)
print()
print('counts for S2AQ8E – HOW OFTEN DRANK 5+ DRINKS OF ANY ALCOHOL IN LAST 12 MONTHS') c4 = data['S2AQ8E'].value_counts(sort=False, dropna=False) print(c4)
print()
print('percentages for S2AQ8E – HOW OFTEN DRANK 5+ DRINKS OF ANY ALCOHOL IN LAST 12 MONTHS') p4 = data['S2AQ8E'].value_counts(sort=False, dropna=False, normalize=True) print (p4)
print()
print('counts for S2AQ10 – HOW OFTEN DRANK ENOUGH TO FEEL INTOXICATED IN LAST 12 MONTHS') c5 = data['S2AQ10'].value_counts(sort=False, dropna=False) print(c5)
print()
print('percentages for S2AQ10 – HOW OFTEN DRANK ENOUGH TO FEEL INTOXICATED IN LAST 12 MONTHS') p5 = data['S2AQ10'].value_counts(sort=False, dropna=False, normalize=True) print (p5)
# recode missing values to python missing (NaN) data['S12Q1']=data['S12Q1'].replace(9, numpy.nan) data['S12Q2B1']=data['S12Q2B1'].replace(9, numpy.nan) data['S2AQ8E']=data['S2AQ8E'].replace(99, numpy.nan) data['S2AQ10']=data['S2AQ10'].replace(99, numpy.nan)
#if you want to include a count of missing add ,dropna=False after sort=False print('counts for S12Q1 with 9 set to NAN and number of missing requested') MC1 = data['S12Q1'].value_counts(sort=False, dropna=False) print(MC1)
print('counts for S12Q2B1 with 9 set to NAN and number of missing requested') MC2 = data['S12Q2B1'].value_counts(sort=False, dropna=False) print(MC2)
print('counts for CONSUMER – DRINKING STATUS') c3 = data['CONSUMER'].value_counts(sort=False, dropna=False) print(c3)
print('counts for S2AQ8E with 99 set to NAN and number of missing requested') MC3 = data['S2AQ8E'].value_counts(sort=False, dropna=False) print(MC3)
data['S2AQ10']=data['S2AQ10'].replace(99, numpy.nan)
print('counts for S2AQ10 with 99 set to NAN and number of missing requested') MC4 = data['S2AQ10'].value_counts(sort=False, dropna=False) print(MC4)
#coding in valid data data['S2AQ8E'].fillna(100, inplace=True) data['S2AQ10'].fillna(100, inplace=True) data['S12Q2B1'].fillna(100, inplace=True)
print ('S2AQ8E with Blanks recoded as 20 and 99 set to NAN') # check coding chk2 = data['S2AQ8E'].value_counts(sort=False, dropna=False) print(chk2)
print ('S2AQ10 with Blanks recoded as 20 and 99 set to NAN') # check coding chk3 = data['S2AQ10'].value_counts(sort=False, dropna=False) print(chk3)
print ('S12Q2B1 with Blanks recoded as 3 and 99 set to NAN') # check coding chk4 = data['S12Q2B1'].value_counts(sort=False, dropna=False) print(chk4)
#recoding values for S2AQ8E into a new variable, RECODES2AQ8E recode1 = {1: 365, 2: 300, 3: 115, 4: 96, 5: 48, 6: 30, 7: 12, 8: 9, 9: 4.5, 10: 1.5, 11: 0} data['RECODES2AQ8E']= data['S2AQ8E'].map(recode1)
#recoding values for S2AQ10 into a new variable, RECODES2AQ10 recode2 = {1: 365, 2: 300, 3: 115, 4: 96, 5: 48, 6: 30, 7: 12, 8: 9, 9: 4.5, 10: 1.5, 11: 0} data['RECODES2AQ10']= data['S2AQ10'].map(recode2)
print ('RECODES2AQ8E with Blanks recoded as 20 and 99 set to NAN') # check coding chk5 = data['RECODES2AQ8E'].value_counts(sort=False, dropna=False) print(chk5)
print ('RECODES2AQ10 with Blanks recoded as 20 and 99 set to NAN') # check coding chk6 = data['RECODES2AQ10'].value_counts(sort=False, dropna=False) print(chk6)
#examining frequency distributions for age print('counts for AGE') c6 = data['AGE'].value_counts(sort=False) print(c6)
print('percentages for AGE') p6 = data['AGE'].value_counts(sort=False, normalize=True) print (p6)
# quartile split (use qcut function & ask for 4 groups - gives you quartile split) print ('AGE - 4 categories - quartiles') data['AGEGROUP4']=pandas.qcut(data.AGE, 4, labels=["1=0%tile","2=25%tile","3=50%tile","4=75%tile"]) c7 = data['AGEGROUP4'].value_counts(sort=False, dropna=True) print(c7)
# categorize quantitative variable based on customized splits using cut function # splits into 3 groups (18-20, 21-22, 23-25) - remember that Python starts counting from 0, not 1 data['AGEGROUP3'] = pandas.cut(data.AGE, [17, 20, 22, 25]) c8 = data['AGEGROUP3'].value_counts(sort=False, dropna=True) print(c8)
# bug fix for display formats to avoid run time errors - put after code for loading data above pandas.set_option('display.float_format', lambda x:'%f'%x)
Output
runfile('C:/Data-Management-And-Visualization/Week2/nesarc1.py', wdir='C:/Data-Management-And-Visualization/Week2') 43093 3010
counts for S12Q1 – EVER GAMBLED 5+ TIMES IN ANY ONE YEAR 1 11153 2 30885 9 1055 Name: S12Q1, dtype: int64
percentages for S12Q1 – EVER GAMBLED 5+ TIMES IN ANY ONE YEAR 1 0.258812 2 0.716706 9 0.024482 Name: S12Q1, dtype: float64
counts for S12Q2B1 – HAPPEN IN THE LAST 12 MONTHS 1 324 2 10811 9 18 31940 Name: S12Q2B1, dtype: int64
percentages for S12Q2B1 – HAPPEN IN THE LAST 12 MONTHS 1 0.007519 2 0.250876 9 0.000418 0.741188 Name: S12Q2B1, dtype: float64
counts for CONSUMER – DRINKING STATUS 1 26946 2 7881 3 8266 Name: CONSUMER, dtype: int64
percentages for CONSUMER – DRINKING STATUS 1 0.625299 2 0.182884 3 0.191818 Name: CONSUMER, dtype: float64
counts for S2AQ8E – HOW OFTEN DRANK 5+ DRINKS OF ANY ALCOHOL IN LAST 12 MONTHS 99 164 11 18892 4 787 1 356 2 288 8 619 3 605 7 854 5 950 6 929 9 1169 10 1333 16147 Name: S2AQ8E, dtype: int64
percentages for S2AQ8E – HOW OFTEN DRANK 5+ DRINKS OF ANY ALCOHOL IN LAST 12 MONTHS 99 0.003806 11 0.438401 4 0.018263 1 0.008261 2 0.006683 8 0.014364 3 0.014039 7 0.019818 5 0.022045 6 0.021558 9 0.027127 10 0.030933 0.374701 Name: S2AQ8E, dtype: float64
counts for S2AQ10 – HOW OFTEN DRANK ENOUGH TO FEEL INTOXICATED IN LAST 12 MONTHS 99 200 11 17436 4 272 1 167 2 109 8 601 3 184 7 902 5 510 6 539 9 1690 10 4336 16147 Name: S2AQ10, dtype: int64
percentages for S2AQ10 – HOW OFTEN DRANK ENOUGH TO FEEL INTOXICATED IN LAST 12 MONTHS 99 0.004641 11 0.404613 4 0.006312 1 0.003875 2 0.002529 8 0.013947 3 0.004270 7 0.020931 5 0.011835 6 0.012508 9 0.039218 10 0.100620 0.374701 Name: S2AQ10, dtype: float64 counts for S12Q1 with 9 set to NAN and number of missing requested NaN 1055 2.000000 30885 1.000000 11153 Name: S12Q1, dtype: int64 counts for S12Q2B1 with 9 set to NAN and number of missing requested 1 324 2 10811 9 18 31940 Name: S12Q2B1, dtype: int64 counts for CONSUMER – DRINKING STATUS 1 26946 2 7881 3 8266 Name: CONSUMER, dtype: int64 counts for S2AQ8E with 99 set to NAN and number of missing requested 99 164 11 18892 4 787 1 356 2 288 8 619 3 605 7 854 5 950 6 929 9 1169 10 1333 16147 Name: S2AQ8E, dtype: int64 counts for S2AQ10 with 99 set to NAN and number of missing requested 99 200 11 17436 4 272 1 167 2 109 8 601 3 184 7 902 5 510 6 539 9 1690 10 4336 16147 Name: S2AQ10, dtype: int64 S2AQ8E with Blanks recoded as 20 and 99 set to NAN 99 164 11 18892 4 787 1 356 2 288 8 619 3 605 7 854 5 950 6 929 9 1169 10 1333 16147 Name: S2AQ8E, dtype: int64 S2AQ10 with Blanks recoded as 20 and 99 set to NAN 99 200 11 17436 4 272 1 167 2 109 8 601 3 184 7 902 5 510 6 539 9 1690 10 4336 16147 Name: S2AQ10, dtype: int64 S12Q2B1 with Blanks recoded as 3 and 99 set to NAN 1 324 2 10811 9 18 31940 Name: S12Q2B1, dtype: int64 RECODES2AQ8E with Blanks recoded as 20 and 99 set to NAN NaN 43093 Name: RECODES2AQ8E, dtype: int64 RECODES2AQ10 with Blanks recoded as 20 and 99 set to NAN NaN 43093 Name: RECODES2AQ10, dtype: int64 counts for AGE 32 873 64 453 96 13 33 846 65 448
62 454 94 24 31 861 63 458 95 16 Name: AGE, Length: 81, dtype: int64 percentages for AGE 32 0.020259 64 0.010512 96 0.000302 33 0.019632 65 0.010396
62 0.010535 94 0.000557 31 0.019980 63 0.010628 95 0.000371 Name: AGE, Length: 81, dtype: float64 AGE - 4 categories - quartiles 1=0%tile 11269 2=25%tile 10779 3=50%tile 10472 4=75%tile 10573 Name: AGEGROUP4, dtype: int64 (17, 20] 2183 (20, 22] 1482 (22, 25] 2173 Name: AGEGROUP3, dtype: int64
Conclusion
I have chosen 5 variables. So I have 5 frequency distribution tables. I have taken several data management decisions. These include coding out missing data, coding in valid data, recoding variables and grouping variables.
0 notes
Text
Data Management and Visualization - Week 2
Hi, This is Tarun Rao. I am writing this Blog post on Tumblr to showcase my assignments of the Data Management and Visualization Course on Coursera.
Assignment 2
We have to pick one programming language out of SAS and Python and I chose Python as it is easy to understand and is feature loaded. I have called my chosen data set (NESARC) and calculated frequency distribution for my chosen variables through the python code.
My Program
# -*- coding: utf-8 -*- """ Spyder Editor
This is a temporary script file. """
import pandas
import numpy
# any additional libraries would be imported here
data = pandas.read_csv('nesarc_pds.csv', low_memory=False)
#upper-case all DataFrame column names - place afer code for loading data aboave data.columns = list(map(str.upper, data.columns))
print (len(data)) #number of observations (rows) print (len(data.columns)) # number of variables (columns)
print()
#counts and percentages (i.e. frequency distributions) for each variable print('counts for S12Q1 – EVER GAMBLED 5+ TIMES IN ANY ONE YEAR') c1 = data['S12Q1'].value_counts(sort=False) print (c1)
print()
print('percentages for S12Q1 – EVER GAMBLED 5+ TIMES IN ANY ONE YEAR') p1 = data['S12Q1'].value_counts(sort=False, normalize=True) print (p1)
print()
print('counts for S12Q2B1 – HAPPEN IN THE LAST 12 MONTHS') c2 = data['S12Q2B1'].value_counts(sort=False, dropna=False) print(c2)
print()
print('percentages for S12Q2B1 – HAPPEN IN THE LAST 12 MONTHS') p2 = data['S12Q2B1'].value_counts(sort=False, dropna=False, normalize=True) print (p2)
print()
print('counts for CONSUMER – DRINKING STATUS') c3 = data['CONSUMER'].value_counts(sort=False) print(c3)
print()
print('percentages for CONSUMER – DRINKING STATUS') p3 = data['CONSUMER'].value_counts(sort=False, normalize=True) print (p3)
print()
print('counts for S2AQ8E – HOW OFTEN DRANK 5+ DRINKS OF ANY ALCOHOL IN LAST 12 MONTHS') c4 = data['S2AQ8E'].value_counts(sort=False, dropna=False) print(c4)
print()
print('percentages for S2AQ8E – HOW OFTEN DRANK 5+ DRINKS OF ANY ALCOHOL IN LAST 12 MONTHS') p4 = data['S2AQ8E'].value_counts(sort=False, dropna=False, normalize=True) print (p4)
print()
print('counts for S2AQ10 – HOW OFTEN DRANK ENOUGH TO FEEL INTOXICATED IN LAST 12 MONTHS') c5 = data['S2AQ10'].value_counts(sort=False, dropna=False) print(c4)
print()
print('percentages for S2AQ10 – HOW OFTEN DRANK ENOUGH TO FEEL INTOXICATED IN LAST 12 MONTHS') p5 = data['S2AQ10'].value_counts(sort=False, dropna=False, normalize=True) print (p4)
# bug fix for display formats to avoid run time errors - put after code for loading data above pandas.set_option('display.float_format', lambda x:'%f'%x)
Output
runfile('C:/Data-Management-And-Visualization/Week2/nesarc1.py', wdir='C:/Data-Management-And-Visualization/Week2') 43093 3010
counts for S12Q1 – EVER GAMBLED 5+ TIMES IN ANY ONE YEAR 1 11153 2 30885 9 1055 Name: S12Q1, dtype: int64
percentages for S12Q1 – EVER GAMBLED 5+ TIMES IN ANY ONE YEAR 1 0.258812 2 0.716706 9 0.024482 Name: S12Q1, dtype: float64
counts for S12Q2B1 – HAPPEN IN THE LAST 12 MONTHS 2 10811 1 324 31940 9 18 Name: S12Q2B1, dtype: int64
percentages for S12Q2B1 – HAPPEN IN THE LAST 12 MONTHS 2 0.250876 1 0.007519 0.741188 9 0.000418 Name: S12Q2B1, dtype: float64
counts for CONSUMER – DRINKING STATUS 1 26946 2 7881 3 8266 Name: CONSUMER, dtype: int64
percentages for CONSUMER – DRINKING STATUS 1 0.625299 2 0.182884 3 0.191818 Name: CONSUMER, dtype: float64
counts for S2AQ8E – HOW OFTEN DRANK 5+ DRINKS OF ANY ALCOHOL IN LAST 12 MONTHS 5 950 2 288 1 356 16147 8 619 7 854 9 1169 11 18892 10 1333 3 605 6 929 4 787 99 164 Name: S2AQ8E, dtype: int64
percentages for S2AQ8E – HOW OFTEN DRANK 5+ DRINKS OF ANY ALCOHOL IN LAST 12 MONTHS 5 0.022045 2 0.006683 1 0.008261 0.374701 8 0.014364 7 0.019818 9 0.027127 11 0.438401 10 0.030933 3 0.014039 6 0.021558 4 0.018263 99 0.003806 Name: S2AQ8E, dtype: float64
counts for S2AQ10 – HOW OFTEN DRANK ENOUGH TO FEEL INTOXICATED IN LAST 12 MONTHS 5 950 2 288 1 356 16147 8 619 7 854 9 1169 11 18892 10 1333 3 605 6 929 4 787 99 164 Name: S2AQ8E, dtype: int64
percentages for S2AQ10 – HOW OFTEN DRANK ENOUGH TO FEEL INTOXICATED IN LAST 12 MONTHS 5 0.022045 2 0.006683 1 0.008261 0.374701 8 0.014364 7 0.019818 9 0.027127 11 0.438401 10 0.030933 3 0.014039 6 0.021558 4 0.018263 99 0.003806 Name: S2AQ8E, dtype: float64
Conclusion
Each variable has different options. The numbers on the left which represent the options are Non Numeric Data and the numbers on the right represent frequency or the percentage. If no number is written on the left that means that option represents missing data.
0 notes
Text
Data Management and Visualization - Week 1
Hi, This is Tarun Rao. I am writing this Blog post on Tumblr to showcase my assignments of the Data Management and Visualization Course on Coursera.
Assignment 1
We have been given 5 data sets out of which we have to to choose a data set of our interest. After choosing a data set we have to identify 2 specific topics on which we have to research.
Choosing a data set that you would like to work with.
I have chosen U.S. National Epidemiological Survey on Alcohol and Related Conditions (NESARC) as I was interested in finding out about Pathological Gambling and its impact on the 18+ population.
Identifying a specific topic of interest
Gambling is harmful to psychological and physical heath of a person. So I was interested in finding out the co-relation between Pathological Gambling and alcohol consumption. I chose to explore Pathological Gambling as my first topic of interest.
Preparing your own code book
We have to prepare our own code book in which we have to identify and mention a few variables that measure our selected topics. I have chosen 2 variables which are S12Q1 and S12Q2B1.
Identifying a second topic of interest
Alcohol is not only injurious to the person consuming it but also to the family members or dependents as this leads to various problems like Depression, Anti Social Personality Disorder etc. So I was curious to study this topic.
Adding questions/items/variables documenting this second topic to your personal codebook.
1) What is the relationship between gambling behaviors and alcohol ?
2) Is there a positive association between pathological gambling and level of alcohol consumption ?
Updated Codebook:

Perform a literature review to see what research has been previously done on this topic.
In an extensive telephone survey of 2,274 youths between the ages of 14-21 year old identified that problem gambling and substance misuse are prevalent among young people. For instance, 17% of youth reported gambling 52 or more times in the past year, and the same percentage of youth drank five or more drinks on 12 or more days in the past year. The paper also identified other studies which revealed that gambling pathology was significantly associated with alcohol- and substance-use disorders, as well as nicotine dependence.
“These exploratory findings present a picture of a regular gambler drinking alcohol prior to a session of gambling and having increasing problems with control in resisting urges to begin a session of gambling (one in eight players (13.3%) found it 'difficult to resist playing the card machines after having a few drinks'). Continued drinking of alcohol appears to be moderately associated with progressive levels of impaired control within a session of gambling, and appears to further add to the problems of ending a session of play for the gambler”. -Baron et al (1999:13).
“A tendency to drink in response to gambling wins and more severe alcohol problems each coincide with stronger associations between gambling win and alcohol concepts in memory. Such associations can promote drinking and its attendant effects (e.g. poor decision-making) in problem gamblers, and thus, may contribute to co-morbid gambling and alcohol use disorders”. Zack et al (2005: 325) 122.
Based on your literature review, develop a hypothesis about what you believe the association might be between these topics. Be sure to integrate the specific variables you selected into the hypothesis.
There is a positive association between Pathological Gambling and alcohol consumption. Pathological Gambling leads to high levels of alcohol consumption and high levels of alcohol consumption leads to Pathological Gambling.
Reference:
https://s3.eu-west-2.amazonaws.com/files.alcoholchange.org.uk/documents/The-relationship-between-alcohol-and-gambling-behaviours.pdf
1 note
·
View note