
25 y.o. from Prague, Czech Republic. Swing trading equities. Patiently waiting for corrective moves during trends, letting the price retest a previous resistance level which then becomes a support. I call these situations Flips and I've built my method around it. Keep it simple stupid and just "buy the Flip"!
Don't wanna be here? Send us removal request.
Statistics
We looked inside some of the posts by patientflips and here's what we found interesting.
Average Info
Notes Per Post
8
Likes Per Post
5
Reblog Per Post
3
Reply Per Post
0
Time Between Posts
5 days
Number of Posts By Type
Photo
13
Text
3
Note
1
Last Seen Tumblr Blogs


Fun Fact
Mobile Tumblr US users spend an average of 4.04 minutes per session on the app.
Photo

$POT - 8.2.2017 entry analysis
Setup: Botomming base Flip
Or maybe not... In order we all being able to learn from my mistakes, I will definitely be posting my bad trades as well. Even though I believe in learning from our best trades (how we can imitate and execute them again), we must learn from our bad trades too (what NOT to do next time).
That “or maybe not” at the beginning is there because it’s probably not a proper bottoming base Flip. In the hindsight I see, price has never broke out of the consolidation. That’s because the resistance is a bit higher around 19. And those two breakouts are just failed breakouts, forming a double top.
Not only that, but I also didn’t follow my rule of price breaking the weekly upper band to show the strength of the trend. Even though I don’t need violation of the WEEKLY upper band when entering at the Bottoming base Flip, I still need it on the DAILY. Yes, it happend, but it wasn’t nothing major. Looking at the chart more and more, I don’t see any strength, just a continuous sideways action. Also, daily EMA20 flat for a couple of weeks already and the weekly is rising by just a little.
This trade may have worked or it may have not. The more price fluctuated around my entry level, the less I liked it. Therefore, I was trailing my SL quite aggressively, getting hit at -0.5R at the end. I’m satisfied with the outcome. I took a very small loss which I paid for a new lesson in my personal strategy development course :-) That’s how you should observe your losses too. Take screenshots, learn and write about them. It really helps a lot!
Lessons reiterated and learned
1. In order to be continuation of a pullback more probable, there needs to be strength during the trend first. 2. Always be cautious of these double tops before my entry. 3. When trading Bottoming base Flip, be aware of all the levels because most of the time, it’s not that clear on the first sight which level is the major one.
And now a screenshot of where the resistance of the bottoming base might be drawn, and where it probably really is.
(Right click the image and select “Open image in new tab”)

These levels can make a HUGE difference in your trading. I’m still learning but constantly drawing them on wrong places can cost you a lot of money.
4 notes
·
View notes
Photo

$DHI - 10.2.2017 entry analysis
Setup: Change of the trend Flip (one of my favorite, this one can catch huge moves right from the beginning after sentiment gets changed)
Long-term view: In the middle of 2016, price made new ATH near 35. That didn’t last long and the stock retraced back to 27.
Price action: Since trump’s election, it stopped tanking lower and rather started to consolidate in a 2 points range. The whole time, volume was much higher than during the decline, signing a potential accumulation. With positive earnings, price definitely broke above the multi-month trendline and the bottoming range. I started watching it.
Entry signal: When price came back to test the prior resistance, all levels ligned up to create my AOV to trade from. Just beautiful. Weekly EMA20had time to curl up and price came back right to it (hint: that’s the typical initial pullback after breaking a trendline into the previous direction, no matter what timeframe you’re looking at). There we go, there was my AOV - wEMA20, dEMA20, prior strong resistance, gap fill... All set, waiting for my opportunity to get in.
Entry signal: Since this correction took place fairly quickly without much hesistation, I couldn’t draw my trendline. But that’s ok, because the whole situation looked perfect and odds were on my side. When I saw the engulfing candle right at the AOV, followed by that pinbar, I knew that’s my chance to get in. I set my stop order above the last short-term swing high (previous resistance) and got filled during the next strong day.
Money managament: I like this entry because it gives me the opportunity to get out with half of my position at RRR 1:1 before the first resistance. Therefore, I will be risking minimum amount if anything at all when I’ll be playing the potential breakout of it on its way to the ATH.
2 notes
·
View notes
Photo

$AET - 3.2.2017 entry analysis
Setup: below ATH Flip combined with base Flip (described in the post about my Flip strategy)
Long-term view: In 2015 it finished its huge uptrend and since then we’ve seen a 1,5 years long correction in time, rather than in price. After ranging this long, price tested the prior uptrend trendline and then exploded higher to attack the ATH.
Price action: Price violated the weekly upper band on huge volume, signaling strength to the upside. Then pulled back to to the prior range upper edge around 125 but continued lower with the whole $XLV sector. It stopped at a not that clear S/R level, which however, acted as a resistance many times in 2015 and in early 2016. That large volume breakdown of 125 was followed by a double bottom at the daily lower band and a strong reversal price action. At that moment, price also broke the trendline. That failed breakdown and an immediate turn is a very strong signal.
Entry signal: Because this pullback was deeper than I expected, I needed to see a close above the trendline (that’s why the blue color). I didn’t want to be aggressive this time. The trendline cuts through the wicks, but for me, closes are more important. When price closed above the trendline on large vol, I just set my stop order above its high and got filled 2 days later.
Money management: Stop below the AOV. Which, in the hindsight wasn’t that necessary because if price reverses this strong, it shouldn’t retrace back into the pattern. First half off at RRR 1:1, 1/4 at RRR 1:2 which is at the ATH. With the last 1/4 I’ll play for a breakout.
0 notes
Text
Flip trading strategy
The general idea of my trading system is buying when price corrects to a previous resistance level after a significant volatility expansion within a longer term uptrend. Basically, what I’m looking for is an established uptrend with higher lows and higher highs on the weekly timeframe, advancing weekly EMA20, break of a resistance and price violating the weekly upper Keltner band. Only then I’m interested in getting long such stock and I start watching it every day. I draw the plan and most importantly the “Area Of Value”, where I expect already a few days or weeks ahead to enter.
Last year, when I was trying all kinds of different approaches, I discovered that to me personally it’s much more logical and pleasant at the same time to go long on support (pullbacks) instead of at break of a resistance (breakouts). I feel that I can manage my risk much more appropriately when getting in on reversals of a short term downtrend within a long term uptrend rather than entering on momentum burst. Usually, I already exit at least with half of my position where breakout traders prepare to enter (last significant high).
So far, I trade only long. Sometimes I go through broken falling price charts and mark possible entries and I believe that this system works both ways. However, given the natural behavior of stocks as a value instrument, I prefer to go long. Also, why go short when the overall market keeps putting in one all-time-high after another. We’re now in a strong bull market and I do want to ride it as much as I can. I plan to get more skilled with shorts in the future but now it’s not the best time to trade them I think.
Always evolving
First things first. I’ve been watching these deeper pullbacks only for last 2 months. I’m still at the beginning. However, I have finally decided what kind of market action I feel the most comfortable to trade and now I’m going to master this approach. There is still PLENTY of things I have to develop in my plan but the main one is already done – I know there is an edge in trading pullbacks and I just have to figure out how to utilize it the best I can. I have a clear goal in my mind and I’ve never felt better about my trading. No more system hopping, no more random guru following. And what’s the best way to learn a skill? Sure, a real world, raw practice.
I have a basic plan now which I started trading with my real money only 3 weeks ago after paper trading it for a month and I just keep executing all trades that fit into my plan. Sometimes I enter totally wrong, I make mistakes, I have some losses, but also some really nice wins already, I try my best now to figure out what are the appropriate market conditions for my setups, how much I’m willing to let price go against my positions, how long I can hold the winners etc. I’m patient. I’m on a journey of developing my own trading approach and I love the process. I’m building my confidence.
Not too strict rules
Trading is a skill where you must develop your own rules out of nothing in a limitless environment, test these rules and then consistently stick to them. However, at the same time, trading is so freaking random that not a single situation looks completely the same as some other one in the past. They might look similar and you may use the same rules for them but they are not. That’s probably the most challenging part of this game. When I started day-trading e-minis (funny but typical, right?) and then futures spreads a few years ago, I tried to create rules for every single situation. It was never ending because trade after trade, some new nuances ocurred that I hadn’t incorporated in my trading plan yet. I’m fortunate enough that I have finally realized that professional discretionary traders do not have strict rules for every single situation that may happen.
It’s necessary to have trading rules. But one must avoid developing them too strict, dogmatic and tight, fitted on a specific situation from the past. That would be a mistake. Professional discretionary traders know that every day in the markets is different. There are no two same days. And still, it’s possible to be consistent. That’s because there are patterns that are repeating over and over again but they do not look the same every time. The situations are similar but risk management, entries and position management will slightly differ trade from trade.
With that paragraph I just wanted to describe you my thoughts about that. Even though I have my trading rules and I set them as systematic as I can, in every decision moment I still let myself like 10-20% room to adjust the rules to the specific situation. I rely on my past experiences and I try to trust myself. I believe that discretionary trading is more of an art than exact science. To be a little specific, to me, a pullback trader, the most important takeaway is following - all kinds of supports and resistances are areas rather than exact lines and sometimes these areas get violated in order to price reacts to them only a few days later.
So how do I currently trade my Flip setups?
Flip pattern in general
Trend on weekly or monthly is my friend. I never fight it. Higher lows and higher highs. The Flip pattern on its own basically ensures I’m in a trending name. Because I want to see a break of a resistance, strong rally through the weekly upper band and then the retest which means that price had to put in a higher high. How basic this condition may seem, it’s a large part of the edge I’m trying to exploit on a regular basis. My goal is to look for stocks that are in a correction stage (pulling back) of a long term uptrend. My eye is already trained, so that when I’m flipping through hundreds of charts I only stop when price is near weekly EMA20 and then I just draw the previous resistance. If it’s near both the MA and the resistance, I put it on my watchlist to plan the trade.
I’d say that 50% of my trades look like a descending triangle with resistance (which becomes a support) at the bottom and a declining trendline at the top. Price getting slowly tighter and closer to my area of value until it finally hits the support, spend there a few days, finds a large volume of buying orders, pops through the trendline and continues higher again. However, this is maybe too ideal and not all of the real world trades look like that. Unfortunately, other 50% of the trades are not that straightforward. They randomly bounce around, create new trendlines because of failed breakouts, violate the support and test the support 2, 3 or even 4 times until price resolves higher. Generally, I have observed so far that the longer the trend, the longer it takes the price to bounce and I need to prepare for more tests and more sideways action. That’s why I prefer trading the first 3 variations of Flips you’ll read about later.
Area of value
Buying a deeper pullback makes a lot of sense to me. Most of the time, where I buy based on my Flip system, many more traders and investors buy as well. At the same time, shorts are drying up. Confluence is key. The more confluence there is in the area of value, the better. Most typical confluence is previous resistance, weekly EMA20 and up-trendline. However, when I plot on my charts some of other technical stuff such as widely used moving averages 50 and 200, Fibonacci retracements, oscillators etc., I find out, that if I was using them, I’d enter roughly at the same spot. That’s why I call my level an “Area Of Value (AOV)” because that’s what it is. SMA200 + 61.8 Fib + trendline + prior resistance + clearly developed uptrend on the weekly and you’re all set. Some traders say confluence is nonsense. But I feel it works for me. The more traders see the opportunity, the more buying pressure, the stronger the move. Even if not, it’s comfortable to know that more traders bought the stock at the same level as I did. And I don’t need to clutter my charts with all the various tools. It’s not necessary, price action and a few lines is more than enough.
(to see the screenshots bigger, right click “Open picture as a new Tab”)

This AOV also brings clarity and calmness to my trading. What I totally love about this whole Flip strategy is the fact that I can plan the whole trade beforehand. I see an uptrend, price pulling back, I draw a level where I want it to fall in order to become interesting for me, I set an alert and then I just wait. I am patient. I wait until the plan materializes itself. Until price drops to my desired AOV, consolidates there, maybe fake a breakdown and then pops through the trendline. It happens all the time. I just have to wait. And then wait some more until the action shouts on me it’s time to enter. I plan the trade and then just trade the plan. Without thinking, without hesitation.

Variations
1. Initial Flip after broken trendline of a large corrective move lasting from a few months to even 1-2 years – So far, this one and the Bottoming base Flip are my most favorite. They are very reliable and most importantly, they can catch the largest moves. This kind of Flip is basically the initial pullback after breakout rally from a longer-term downtrend. Situation: Multi-year uptrend on monthly. Weekly is in a corrective downtrend and ideally stops at a very strong S/R level. There it consolidates for a couple of weeks and then turns around, breaks the declining trendline and rallies. After such rally I set an alert lower on the previous consolidation where is my AOV I want to trade off and I wait until price retraces back. Sometimes, that takes a month or two. With this Flip variation, I don’t persist on the condition of price violating the weekly upper band which is too far away because price was trending down for a long time. However, it must violate at least the daily upper band. These Flips give me the opportunity to get in at the best level possible in the new developing uptrend.

2. Bottoming base Flip – This is the second Flip variation that let me get into a newly developing long-term trend at the best price possible. It’s definitely possible to get into a stock in the bottoming formation before the breakout but that’s not my style. Or at the breakout itself. But I need to see that breakout, higher high and then Flip off the bottoming base neckline. These trades are crystal clear most of the time and they tend to pop very soon after price hits the AOV.

3. Multi-month/year base Flip – Price has created a huge multi-month or even years long range. Then it breaks it to the upside, rallies and gets back to retest the resistance which becomes support that should hold in order for me to enter. This base-flip is a VERY strong setup on any timeframe. The longer the base, the stronger the resistance, the stronger the breakout and the higher the probability that if price comes back to retest it, it will hold. And there goes your “buy the flip”!
(to see the screenshots bigger, right click “Open picture as a new Tab”)


4. All-time-highs Flip – Pretty straightforward I’d say. It’s basically just another kind of a base-flip setup. No need for much explanation. I’ll just add that the longer price based below the ATH, the better. Such price action is not only good for breakout traders but for my Flips as well.

5. Below all-time-highs Flip - I was surprised after paper trading this strategy that this situation ocurres so often. Even so often that I classified it as a standalone Flip variation to measure its statistics. It happens when price attacks the ath from months ago, pulls back to a prior resistance and gets ready to attack it again and maybe even break through it. There is always a strong level just below the ath that price may flip off. I enter there and take most of my profits at the ath where breakout traders are getting ready to enter.

6. Remount Flip – Imagine a strong multi-year support level. Price breaks below it and trends down for some time (months or even years). Then, after bottoming, it starts to trend higher again and it remounts that very strong historical S/R level. It gets above it and comes back to test it. And you know the rest of the story. I enter and I milk that cow as long as it keeps going!

7. Trend Flip – Most of the time, my trades are some kind of a base-flip setup or Flip off a historically many times proven S/R level. And if not, it’s just a basic Flip from prior swing high in an uptrend. This one is the least reliable because the horizontal S/R is weak. This setup is more typical for lower timeframes because when you check out weekly, it’s probably going to be a Remount Flip.
Entries
There are basically 6 different ways I came up with to enter the Flip pattern. I use them all based on the specific price action of the specific stock I’m about to enter. The list is sorted from closest entries to the area of value to entries that are more far away from the area of value.
1. (Aggressive - not in use) Enter right at the support without waiting for a clear reversal. Maybe wait for a 3-5 days consolidation and then enter as lowest as possible. Such entry provides a much better risk-to-reward ratio (RRR) but I found out that I don’t feel comfortable trading it this way. Many times, price continues lower to violate the area of value to hunt all stops and only then it bounces. With more experience I would definitely want to time my entries lower and lower, but for now, I stick to one of the following methods.
2. (Aggressive) Enter above pinbar’s high. If price forms a candle with long wick at the bottom which violated the support intraday but closed rather strong, that’s a great signal to me to be more aggressive. In such case, I do not wait for the trendline break and set my buying stop order above the pinbar’s high. This entry provides the best RRR without the necessity to guess where price will stop. It doesn’t happen often but when it does it makes me happy.
(to see the screenshots bigger, right click “Open picture as a new Tab”)

3. (Aggressive) Buy with a stop order set above a short-term resistance. Price gets tighter and then it goes sideways for a couple of days maybe with a few failed breakouts. After being patient and wait how this resolves, I don’t need to wait for price to close above the trendline but rather be more aggressive and enter at the first momentum burst through both the consolidation resistance and the declining trendline. I like these aggressive entries the most because most of the time they provide a very robust RRR.

4. (Conservative) Wait for price to close above the trendline and then enter at the end of the day or with a buying stop order above the high of this candle. This is an ideal confirmation, however, most of the time price is already so stretched and far away from the support that it’s not possible to enter with a robust RRR and I must set a limit order to buy with a “discount” or wait for the initial flag to get in.

5. (Conservative) Set a limit order lower, somewhere in the middle of the yesterday’s candle, closer to the short-term mean. If price didn’t run that far away but I need to enter a bit lower to have a desired RRR I don’t necessarily wait for an initial flag to form. I just set a limit order and wait if price retraces tomorrow before following through. If not and it continues right away, there is still chance to get in.
6. (Conservative) Initial flag after price breaking out without giving a good RRR opportunity to get in. When price ran too quick too far away, the best way to enter such stock is to wait for the initial pullback/flag to the trendline or curling up dEMA20 (if I understood this correctly, Adam calls these “nested pullbacks”). Never chase. If I didn’t get in, I wait for this initial flag to form and then set my buying stop order above the flag to trigger the entry. This is much better than chasing because when chasing price is stretched and you would have to put your stoploss too far away. It’s better to wait for the initial pullback and put the stoploss below it. Most of the time these initial flags happen. But sometimes they run without stopping and flagging. And without me. But hey, that’s trading, you try to catch them all but it’s not possible if your main priority is to manage risk properly.
(to see the screenshots bigger, right click “Open picture as a new Tab”)


When you view my trades here at the blog or at Stocktwits you can notice that after my initial entry, a pretty substantial amount of them get back to the AOV or very close to it. That’s something I’m getting used to and comfortable with over time. If I chose to trade only these multiple tests of the support or initial flags, I’d miss tons of great opportunities. Some names are naturally more sluggish and bounce around for a while and some of them just hit the AOV, break the trendline and start flying without even looking back. Therefore, I decided to enter all the trendline breakouts and rather wait a few weeks until it finally pops higher after going sideways and testing the support few more times, than missing some great momentum runners.
As I said in the previous post, I make all my decisions when markets are closed. End of day prices only. It preserves my mental capital in a HUGE way. Sometimes I can’t do anything but miss a move. But that’s ok because this approach has much more advantages such as defending my financial and mental capital from fake moves which happen all the time. And I can honestly say that even when trading only this way, I have new trades on a very regular basis. Plus, when price runs too fast too far, often times it corrects in price or in time and gives me another chance to get in at the break of the flag. So no biggie at all. It’s all about the attitude. You can’t catch them all anyway.
Trendlines
Trading the Flip patterns cannot do without drawing trendlines. Most of the time, it’s possible to draw a trendline connecting the highs of bars during a corrective pullback. However, trendlines are somewhat subjective. It took time and a ton of practice until I finally came up with the way how to draw these trendlines. The most important thing that comes to my mind right now is to know that they are changing all the time based on the fresh price structure. The steeper the trendline, the more probable a retest of it after break. For more aggressive entries, I use steeper shorter term trendlines. For more conservative entries, longer term and more shallow trendlines are better and more reliable. I prefer break of the trendline as an entry signal rather than break of the EMA20 because trendlines are most of the time closer to the support, providing better RRR. I would have to use shorter term MA like for example with period of 9 but that would add noise and clutter to my charts. So far, I’m fine with using trendlines.


Stoploss
This is tricky. Always. I have some rigid rules for setting my stoplosses but it’s too soon for me to say what is the best place to set a stop order when trading all the different variations of a Flip. This is probably the most evolving part of my trading plan, I’m currently trying all kinds of different approaches and figuring out which are the most suitable. So far I came to a conclusion that setting a stoploss largely depends on the current overall market conditions. If market goes sideways it’s better to put my stop farer than when it’s trending up because I can expect more touches of the support area. Stoploss is largely based on timeframe. Generally, the longer you expect to hold, the wider you should set your stoploss. I still keep finding my ideal holding period. I don’t mind holding for 3, 4 or even 8 weeks. I’m completely ok with that since I have life outside the market and I don’t dwell on taking profits as soon as possible. I let my positions work out.
To be a little bit more clear, I’ll tell you some of my observations. I start with a strict rule to have my stop always 2x-3x ATR, no less, no more (the only exception being initial flag entry). If it needs to be more, I wait for a cheaper entry. When price bounces too quick too far away from the AOV and breaks the trendline, it’s better to keep waiting. I’d have to set my stoploss too far away from my entry. I rather wait for the initial consolidation, enter on its break and put my stop below the consolidation somewhere below the trendline inside the triangle pattern (=initial flag entry).
When I enter on the very first bounce off the AOV, I must set the stop below the low of the pullback because there is a high probability of price testing the level once more. I always leave some space below the low because what happens is that price comes back to test the level and creates a lower low. By just a little bit but setting the stop a tick below the low would mean getting stopped out. By only a few cents and that would hurt mentally.
Always treat stoploss as part of the mental game. Do you want to achieve higher RRR with narrower stop? Then prepare yourself for more losses and multiple re-entries. You don’t feel like taking too many losses and you rather enter only once and set your stop wider? Then prepare yourself for smaller winners, smaller number of losses and longer period of holding. Something for something as always in trading.
As for trailing stoploss, I trail it quite aggressively. Lots of my losses are smaller than planned 1R because when holding for weeks, price has time to create higher lows and consolidations. I wait until the price structure lets me move my stoploss higher and only then I do it. I don’t hurry. Also, I always keep my stop below dEMA20 after price bounces off the AOV.
Price targets
The same applies for PTs as for stops. It’s still too soon for me to know what is the best way to take profits from my Flip trades. Right now, I don’t trade to make piles of money. That will come in the future, hopefully. Now I’m learning and developing the best strategy that suits me and my lifestyle. Targets are mental game as well. It’s all about what you expect from your trading. Plus, of course, you must be objective about the price action.
Currently, I exit with half of my position at RRR 1:1 and set my stop at breakeven basically to make the position risk-free (I’m aware that it’s impossible in financial markets speculation, but you know what I mean). It’s also because I want to take some profit as soon as I can in order to feel good and have some consistent little wins. Again, mental capital first! Then I have two ¼ left. With one ¼ I exit on RRR 2:1 which makes the trade 1:1 if the last ¼ hit my stop at breakeven. If not and price keeps continuing, then I let the last quarter run as long as I can. Better said, until the uncomfortable fear of giving away too much of profits exceeds bearable level. I haven’t developed any rule for the runner yet. I have 2 runners open currently so I’m learning in the process. But now I feel like moving the stop behind higher lows or previous week’s low is the best way to do it. I’ll keep you posted.
Currently in progress
Probably too many open positions? Am I not overtrading? Right now, I’ve got around 30 positions, risking only 0,2% per position. The risk is now ok but what when I start risking for example 0,5% per trade idea? That would mean 15% risk at a time with 30 open positions. I feel like there is SO MANY opportunities to trade. I need to filter more. Or do I? Is it necessary to take only a few trades? Is it possible to make it as a trader having so many positions on? What about high beta environment like it is for example now and all my positions getting crushed when market pulls back? Should I open some shorts? Go long volatility to hedge the possible correction? Or just trail my stoplosses more aggressively?
Market conditions – When not to trade? It seems to me that pullbacks work when markets both rise and go sideways. When broader indexes correct their prior uptrends, then Flips probably won’t work but more trade ideas will stack up on my watchlist because many stocks will pull back with the market. I need to go through some period of short term bear market or in other word a deeper correction. I need to see what happens to my setups. I don’t know yet and it’s a bit scary. I can backtest it, of course, but realtime is realtime. So far what seems to me the best is adjusting money and trade management based on the current market conditions. If market is choppy, set wider SL, if market is breaking out, let myself enter more aggressively, if market seems overbought, don’t predict but be cautios and move my stops on a regular basis to prepare myself for the possibility of a correction.
Stoploss – Isn’t 2-3x ATR too much? Do I really have to set my stop as wide as I do? Narrower stop would mean quicker profit and larger RRR, but bigger overnight risk because of larger position and smaller win rate.
Profit targets and scaling out the „best way“ – Should I really take half of at RRR 1:1? Don’t I just unnecessarily decrease the potential of a deep pullback setup? Shouldn’t I take half of the position at prior swing high no matter what RRR? How to move my stop in order to let the last quarter of the position run as long as possible?
These are the questions I’m asking myself now. And only practice, journaling and then reviewing my trades and my statistics will help me to find the answers. I’m happy that I completely felt in love with the process instead of only waiting for the success. I am sure money will start flowing my way if I keep thinking of my trading critically and really trying my best like I’ve been so far.
Keep following my blog as I’ll start posting my entries.
0 notes
Note
Hi! How do you find stocks to trade? Do you use Finviz or other screeners? Can you share your screener conditions?
Hi, thanks for comment! Well, I do not scan for stocks. I just run through them manually in TC2000. Top-down analysis starting with sector analysis. I go through each sector, selecting those that are currently strong and then I flip through hundreds of charts, looking for pullbacks within bigger trend.
0 notes
Text
Let the mastery of one single trading methodology begins
Warning: 2.700 words. But it’s worth it, I swear. Honestly. If you find out at the end that I wasted your time and you didn’t learn at least one small lesson in this article, shoot me an email at [email protected]. I’ll record myself doing 500 pushups in one single session until I finish it or I pass out (I’ve never done such crazy thing of course). And I will send you the recording of this punishment. Fair enough? Enjoy my thoughts!
So as I mentioned in the previous post, I went through a lots of thinking about my trading at the end of the year. Fortunately, I was able to distill many of my problems causing my consistent losses. Most of the bad trades were caused by fear of missing out. That was my HUGE issue. It materialized as entering too soon, catching a falling knife, chasing, compulsive entries, overtrading and many more trading mistakes. It costed me thousands of dollars. I’ve also always had the urgency to have RRR at least 1:2 to the prior swing high. I thought you have to have this large risk to reward ratio in order to make it in trading. Because of that, I was artificially tweaking my risk management in order to fit my trade into that parameter, especially setting my stoploss too tight.
On the other hand, changing my trading from predictive to reactive, is the biggest positive change in the last couple of months. I finally realized that consistently profitable traders have biases, for sure, but they patiently wait until there biases confirm. They plan the trade and then just trade the plan. Without thinking. Without hesitation. So I decided to literally fall in love with planning my trades and then patiently wait until the plan materializes itself. Sitting on my hands, not doing anything in the meantime. So yeah, now I only try to react objectively to what happens in the market and not trying to predict anything. It’s not necessary to be a successful trader.
Generally speaking, discovering my strengths and weaknesses is the best thing that happened in my trading during the last year. Even though I do not believe what many gurus say, that everything in trading works, I 100% believe that your trading style must suit your personality and your lifestyle. To be more specific, it’s the risk and trade management what must suit you the most. Entries have to have an edge, no doubt about that. But knowing that for example pullbacks have an edge is by far not enough to be a consistent winner. What is your risk tolerance, are you going to scale in and/or scale out, how long can you sit through unrealized profit drawdowns without touching the trade, do you wait for daily close, do you time entries on lower timeframe, do you want to be sitting in front of the screen whole day? It’s all these things and much much more that matter. Basically, one must FEEL GOOD when he’s trading his methodology with an edge. In order to have wins, start feeling confident about his method, start being consistent with his approach and become a successful fulltime trader.
With all the previous in mind, I changed my method quite drastically. Being a minimalist in my whole life, I decided to simplify. A lot. Simplicity satisfies me.
Only weekly and daily timeframe, no more intraday noise. Occasionally monthly.
Trading only outside RTH when markets are not moving, deciding based on closing prices.
Trading only deeper price corrections within a longer term trend on weekly.
Price, volume and only 1 moving average (EMA 20) with 2.25xATR Keltner bands around it. Same for all timeframes.
Split screen - displaying both weekly and daily at the same time.
Black and white charts.
1) Timeframe
Sitting in front of my computer all day long, flipping not only through charts but also timeframes was draining all my energy. But just I felt I had to. I thought all professional traders do. Also, I felt I was more in control. That was fake, of course. Being a beginner, swapping between timeframes all the time makes your trading life much harder than it already is. I tried it on my own skin. It completely messes your trade management, you have no idea based on what timeframe to set your stop, target, what is a real counter move and what is just a normal behavior of the stock you trade. It makes you micro manage your positions. And that’s certainly bad. Not anymore for me. I want to see a clear uptrend structure on the weekly with higher lows and higher highs, a decent correction and only then I check the daily. But I stay there, I do not need to go any lower to enter, manage and exit the trade. Weekly for finding an opportunity, daily for trading it.
2) Trading when markets are closed
All these changes I tell you about might seem separate but they are not. It all fits together. They have to coexist so I can feel good, be confident about my trading and finally make my 5 years long dream come true. I love my time. Time is the most precious value we have and I am fortunate enough I realized it so soon in my life, being 25 years old. That’s why I quit law university in the fourth grade ) and started my own online business 2 years ago. That’s why I don’t work 24/7 even I could and enjoy my time on this planet. That’s why I prioritize my time the way I do and say NO to things that don’t matter to me. That’s why I travel so much already and why traveling has become my biggest passion. And finally, that’s also why I decided to change my trading style to fit the idea of time being the most valuable asset to me.
I realized it’s not necessary to stare at the charts all the time. For some people it works but it didn’t work for me. And that’s completely ok, I tried! Without trying you never know what suits you. But I know there must be other ways of making money than timing all entries and managing all trades on 15min timeframe. Sure, there are. I live in Prague, Czech Republic. We’re 6 hours sooner than east coast, regular trading hours are from 3:30pm to 10pm for me. When I open TC2000 in the morning, America is asleep, markets are calm and silent when I plan my trades. Nothing moves. It feels just so much more relaxed than planning trades during the open. No hurrying, no worries, no anxiety, no need to enter before the close. It’s AWESOME! This alone changed the world for me.
Now I plan the trade and then wait. I’m patient. I wait for a trendline breakout, range breakout, pinbar or just any kind of a clear reversal of the pullback I’m watching. Every morning, I check my watchlist for reversals and signs from yesterday that a pullback may be over and price could be ready to go up again. And then, still when markets are closed, I set my buying stop order above the prior day’s high. When markets open, I can do whatever I want to do, it’s the afternoon here and I don’t have to sit in front of my computer. I can enjoy my life. I already did all the work in the morning and now I only check my emails if my orders triggered or not. And so far it really does work. There are some negatives to this but the advantages heavily outweigh them. Like… by far!
But to be able to trade this way, the next change I’ll mention had to happen too.
3) Deeper pullbacks only
No more stressing about timing my entries as closest to support as possible. No more high and tight pullbacks. No more trading extended price. No more artificially tweaking my stoplosses and profit targets only to fit my plan and ignoring the true potential of the market. In order to wait for the reversal on daily chart and still be able to enter with RRR 1:1 or more with stoploss wide enough, I had to start looking for much deeper corrections than I was looking for last year. This just adds to my emotional stability and calmness. I don’t have to stress about entering for the best price possible. Few cents here and there, it’s ok, it still has a plenty of room to run before it reaches the first resistance.
These deeper pullbacks are kind of complex pullbacks on the daily but they look like a simple bull flag on the weekly. Many traders on the daily get caught up in shorting these moves because they don’t see the bigger picture. Even though my trades on daily chart may seem like I’m going against the short-term trend, my weekly puts everything in perspective. Old shorts are drying up taking their profits, price is too low for establishing new shorts but it’s getting interesting again for both value investors and for active dip buyers. These deeper pullbacks just make so much sense to me now. I see the real edge is there and my goal is to utilize it as much as I can. Leaders become laggards in order to become leaders again in the future. Traders and investors have a memory. They know stocks that were strong in the past and they’ll want to trade them when they become strong again after a few months of digesting the prior move.
4) Keltner Bands with setting of 20EMA and 2.25xATR
Why pullbacks? Because they make sense to me since the beginning of my trading. And thanks to Adam and all his hard statistical work he did I started to loving them even more. Thanks to his series of articles about pullbacks on his blog, webinars he was a guest to and his free trading course, I started to get much more into them. I started to think on much deeper level about pullbacks. Especially about in what market conditions pullbacks happen and when is the biggest likelihood of price not failing but creating a new continuation leg. This article was a game changer to my approach.
I want you to read it, and perhaps all Adam’s posts about pullbacks as well for your own good. But let me just quickly pinpoint the conclusion of it. If I want to trade pullbacks with the highest probability of continuation, I must look for those that happen after an untypical volatility expansion. I’m looking for pullbacks after strong moves. To be more specific, I look for entering pullbacks after moves that touch, or even better penetrate for some time, the upper Keltner band on the weekly timeframe. Ideally with a much larger than average volume. This behavior means that such move might not be random, there is probably some strong demand of the stock and this demand may continue building up again when the stock corrects back to a lower price. It makes so much sense, doesn’t it? Avoiding trading pullbacks that aren’t pullbacks in the first place but just random consolidations in a weak market is probably THE best thing I’ve learned about pullbacks so far. Thank you, Adam, for bringing this crucial mechanics of the market to my attention.
5) Split screen
This one might seem like nothing important but hey, just try it. I swear it will make your trading better. We all know we should always check the “bigger picture”, see things from “larger perspective”, right? But to be honest, what is the last time you forgot to check the weekly or monthly timeframe? Ehm…today? Now when I trade deeper pullbacks I can’t plan a trade without checking the higher timeframe. It’s part of my methodology so I made it simpler again and leave it on my screen the whole time. Also, when looking for new opportunites, it makes it easier. I just look at the weekly, I don’t even bother looking at the daily until I see a clear strong uptrend on the weekly.
6) Black and white charts
Again, nothing special, right? But listen, even though you wouldn’t say so, colors of your chart influence you emotionally on an unconscious level. And not only colors but all the lines, grids, numbers, indicators, everything. It all drags your attention from the most important in trading – price. And since you are a human being, you can’t resist that. I rather get used to a new color style of my charts without noticing being less emotional, than blindly “thinking” it doesn’t affect me at all. Do you really think you can “feel” how colors and other things on your chart affect you? Of course not. Sometimes it’s better to listen to the science and just do what it concludes is the best for us. And by the way, just keep this on your mind when reviewing charts of the best traders you know. Haven’t you noticed already? White, black, shades of blue or gray. No bright green and red colors, in almost all cases. Just try to buy a single share of a stock and sit through a drawdown or a consolidation with a green and red bars and then with a black and white bars. How was it? Easier? Less emotional?
I just LOVE my new approach. I had so much stress built up from my trading. I was losing money constantly and I thought it was all for nothing. It wasn’t! If I wasn’t making mistakes and learning from them, I wouldn’t come with these changes. This is definitely not the end and it won’t ever be. Actually, it’s just the beginning. But now I feel I’m on the right track, finally. I’ll keep journaling, taking screenshots, taking notes of everything that’s happening inside me and also questions I need to answer. But I couldn’t be happier with the current state of my trading. It’s been just 5 or 6 weeks I’ve been trading this way but I can say this is the approach I want to master. It still has so many variables that I must handle. But I love learning about it and developing this methodology to suit me the most.
Going long below declining 20 day moving average, being already in when the squeeze of shorts happens, riding the huge explosive move from the weekly flag and already scaling out with half of my position when the “trend traders” are starting to enter because price is finally above the MA on the daily? It feels unbelievably great. Seems like I found my own personal holy grail. Halelujah!
These were just the logics behind my new trading methodology. I will write about the rules and conditions more accurately in the next post. I will also add a lot of screenshots and will publicly journal my new entries as I did the last year. I’ll keep posting because it makes me think more about my new method and sort all my ideas and thoughts. I recommend you do the same.
If you’re not following me on Stocktwits yet, you could J With being so consistent about my approach and my charts looking the same all the time, 80 new people started following me during the last 6 weeks. Lots of positive feedback, thankfulness for my charts and shares. Even publicly known and successful traders like David “crosshairtrader” Blair, Dave “EVplusEV” Kelly, Aaron “ATMcharts” Jackson started following me. It’s crazy that they have 40 or 50 thousands followers on their own, they follow maybe only 100 or 200 people and one of them is ME! This tells me that I must be onto something and I just need to keep going and growing.
Plus, thanks to being more active now on Stocktwits/Twitter, I finally make new connections and trading friends. And it feels so good to be honest. Because unfortunately, I have almost no one to talk to about trading in my offline environment.
Please, let me know if you have ANYTHING on your mind. I love to connect with other traders. You can find me on Stocktwits, email me at [email protected] or send me PM on Facebook.


2 notes
·
View notes
Text
My journey in 2016
I haven’t posted anything for a couple of weeks. That’s because I was going through a massive change in my approach to trading. I finished the year with a -15% loss on my acc. Even though I spent hundreds and hundreds of hours in front of my computer. I have an online business FoodiesFeed so no 9-5 job. That’s why I could be staring at the market all days long. It was CRAZY! It was mentally tough, I tell you. And even tougher at the end of the year when I thought that it was all for nothing. But that’s bullox of course. A couple of days later after this anxiety, I realized something important. Throughout the year, I had wrong expectations. This year was about learning to swing trade stocks with real money, yet preserving financial capital. Not about making money and being a consistently profitable trader. That will hopefully come later.
The whole year 2016 was so worth it. I went through more charts and market situations than I ever have before in my life. At the beginning of the year I made a transition from trading futures calendar spreads to swing trading stocks. There are just a handful of really good opportunities in the futures calendar spreads during the year and one must have a huge acc in order to be able to live from the gains. Also, risk management is much more pain in the ass when you’re limited by buying only full contracts and therefore by the account size. This was my first year of trading only stocks. Fulltime, basically. I was trading with my real money since day one. Very small positions. I was learning on the go.
I already knew a lot about technical analysis from my last 3 years of trading calendar spreads. Trading those needs maybe some horizontal S/R levels, higher lows and higher highs, trendlines and… That’s it I guess. There is the main edge in the seasonality, not in the chart itself. I used TA only to time entries.
So even thouhgh I thought I knew a lot about TA, in practice, it was all much more difficult. I knew I want as cleanest charts as possible. I knew I wanted to keep everything very simple. Since the beginning I knew I don’t need any indicators, just pure price with just a few additions like volume, moving averages and maybe one momentum indicator. That’s it. Also, no system hopping! Price action is the king and it’s enough. I already knew a lot of basics of price movement such as volatility contraction periods are followed by expansions and vice versa, support and resistances (even though being completely random, right Adam H. Grimes?), most important candlestick patterns, breakouts, pullbacks… I knew I was far far ahead of other beginners. I was prepared to make it happen that year (= wrong expectations).
Previously, I traded stocks only very occasionally when some hot new names appeared (IPOs like GoPro or Fit) and I saw an opportunity in the momentum. I made money. But when I really got into the business I realized I was quite lost. I had basically no freaking idea what’s the market doing, how strong is a trend, the best spot to buy, sell, where to put my stoploss, targets etc. I had to practice all that and MUCH more in the coming months. But I was prepared to put all my energy and effort into this. And I did.
I felt progress each and every month. What helped me on my way tremendously was Chat With Traders podcast, Stocktwits community where I follow only the best of the bests. And also some traders in particular who share all their knowledge publicly for free. From the beginning it was for example Rayner Teo or Rolf and Moritz from Tradeciety. But in the most recent months I’ve been largely influenced by Adam H Grimes. I can’t express my honest gratitude for all the knowledge and information Adam shares in his articles, podcasts, videos and in his free extensive online course. If any of my friends asked me to recommend the best teacher of trading to learn from, Adam would be it. Ten thousand percent sure!
Anyway, back to my trading. I never had a need to label all the price patterns with names such as wedges, triangles, rising or falling channels etc. After just a few weeks I realized it’s all the same and it doesn’t need to be more complicated than it already is by calling it in a certain way. We’ve got corrective moves and breakouts of these corrective moves. There is probably more but that’s all I need to know for now. Consolidations are corrective moves in time, instead of price. Pullbacks are most of the time referenced to corrective moves in price. So only 2 situations can happen. Ha! It sounds fairly simple but it’s not that simple AT ALL. In textbooks, all patterns look perfectly symmetrical, no failed moves, no fake moves, everything’s pristine clear. But the reality is that markets move purely random most of the time. Add the vast realm of combinations of the two basic elements of price behaviour (contraction and expansion) to the randomness and you’ve got a major chaos going on in the charts.
So I tried to trade breakouts of consolidations. Breakouts of high and tight flags. Breakouts without volume. Breakouts with volume. Pullbacks right after breakouts. Weekly breakouts. Trendline pullbacks. Trendline breakouts. Moving averages pullbacks. I was basically trying everything I could put my hands on. Still keeping it fairly simple, trading mostly price action and a these basic ideas. I had some great times (I was up 10% in August) followed by drawdowns wiping out all my gains plus some more of course when I finished the year with -15%. But looking at the year in hindsight, now I know it was so worth it. I needed it. I was doing exactly what I intended to do. I was searching myself in the markets. That’s what all those who share the trading knowledge publically tell you when you begin. Your methodology must suit your personality and you should spend a lot of time experimenting. Trying to figure out what kind of trading is the right one for you. Kinds of entries, holding time, level of aggressiveness, appropriate risk management according to your risk tolerance etc.
More and more, I really liked the idea of trading situations when resistance becomes support and vice versa. Some call it role reversal, retest, I call it a Flip. It has become my second nature to spot these Flips since I learned it 4 or 5 years ago. Put any chart in front of me and I can find at least one spot where resistance acted as support or the other way around. Let it be prior swing high or a sideway channel’s upper band. I knew there is an edge in these situations that can be utlized, when I connect all the other pieces of the puzzle together correctly.
At the end of the summer I started focusing only on these situations. But still, it needed a lot of work. One wouldn’t believe at the beginning, how much time and effort it takes to build your own profitable strategy from scratch. It’s really challenging. Even though I finally had something to grasp on, I found out that all the details matter. Entries are only small part of the big picture, maybe the least important to be honest. What’s the current market price action, how’s the market breath, sector rotation, taking profits (huge one!), emotions, trade management and so on. It all matters and can make it or break it.
Did I already mention I was spending hours a day in front of the charts, watching every tick but being a swing trader? Not a day trader. I held some positions not only for days but weeks or even 2 months. And yet, I was obsessively trying to buy nearest to the support as possible. My biggest mistake which cost me the most money was entering too soon. Fear of missing out. Incredible, how our mind works. I knew about it, I was reminding myself not to be afraid of missing a move. Still, I was overtrading because of it. I just couldn’t stand the idea of letting a trade go without me. At least I didn’t chase, because buying near a support rather than extended price is fixed inside me very heavily already. But I was guilty of trying too hard buying as low as possible in an uptrend.
Following Brian Shannon from Alphatrends I thought I should give a 15 or 30 minutes timeframe a shot. Trading daily but timing entries on a lower timeframe is something that I really believe can help. But, and this is a big but (no pun intended), it means you have to follow the price VERY closely. Now imagine you have a watchlist consisted of 50 assets. A professional who’s used to it may flip through the list fairly quickly, spotting an opportunity. But for me, it was mentally tough. Sometimes almost like a hardcore intraday trading. At the end of the day, I was changing timeframes all the time and didn’t know which one I should give the most weight. My trade management became a pure disaster. I thought that sitting in front of the computer, looking at intraday charts all day long puts me in control of the market and my positions. I felt secure. These are fake feelings of course.
I tried this for 2 or 3 last months of the year. I didn’t get profitable with this strategy. But, I learned a lot again. After bleeding very slowly and painfully below the PDT rule, I got anxious. What now? So I spent a lot of time thinking, reading, writing in my journal. One thing that really helped me was keeping records with screenshots of all my trades. Something I learned a few years ago with the calendar spreads. What can’t be measured, can’t be improved. I went through dozens of my last trades and I pin pointed the things that stood out.
First, it was the FOMO, lack of patience and stressing about buying as low as possible. Second, my stops were too tight because “I needed” RRR 1:2 to the previous prior swing high. Third, it was the lower timeframe which made everything only worse, not better. Emotionally, primarily. Fourth, I was buying too many shallow pullbacks in already extended moves (but that’s again some form of FOMO I guess).
Hint: It’s not always the best idea to buy only above rising intermediate moving averages, some of the best reversals of pullbacks happen below declining moving averages.
And this was the end of the year. I spent the last 2 weeks of 2016 and first 2 weeks of 2017 doing what needed to be done: simplifying even more. Black and white charts, only one moving average EMA 20 with 2.25 ATR bands around it, using weekly to identify pullbacks in an uptrend and daily to time the entries. But I talk about my new approach in the next post.
0 notes


Photo

Price action signs it’s time to exit
Price hitting your hard stop order isn’t the only way to exit the trade. Always look for signs telling you that the trade isn’t evolving the way you had expected.
And why should one stay in such trade when there are tons of other opportunities in the market?
You CAN’T control the market but you CAN control your actions and how you manage the trade. It sure depends on your timeframe but in this specific situation when I entered on 30min HH then I don’t want to see such waterfall on the same tf. That’s an objective reason for me to get the hell out.
It’s about taking hundreds of trades based on your plan. Then you know how the winners usually look like and you manage your trades according to it. Have I ever had a huge winner after such breakdown just 2 days after I entered? No, never. When I enter on my Flips, I expect the price to bounce from the S/R level and continue higher! If that doesn’t happen, the idea behind the trade is not valid anymore and I can exit with a complete calmness and a respect for the market.
Don’t force it and never ever try to be right in trading. You’d hurt yourself bad both financially and emotionally.
0 notes


Photo

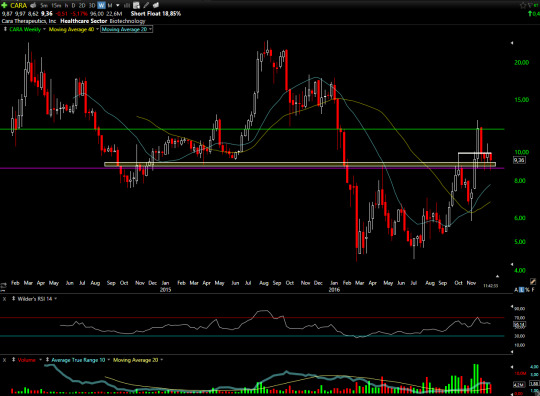
$XBI $IBB
The whole 2016 was basically just retesting 2015 lows. It’s an all-year-long bearish Flip which makes me don’t want to go long biotech stocks until it clears the resistance and monthly MA20.
Just don’t forget that biotech prices can go lower next year and yet still remain healthy. There is still plenty of room to the 50% and 61.8% of Fib retracement.
One can't get caught up in the daily action and get scared of all the down moves. Always think of the bigger picture!
0 notes