
A blog dedicated to systematic trading, statistical edges, and applying the quantitative concepts of analytical chemistry to financial markets.
Don't wanna be here? Send us removal request.
Statistics
We looked inside some of the posts by patrickbatoon and here's what we found interesting.
Average Info
Notes Per Post
0
Likes Per Post
0
Reblog Per Post
0
Reply Per Post
0
Time Between Posts
2 months
Number of Posts By Type
Text
6
Last Seen Tumblr Blogs


Fun Fact
Tumblr has a low social media market share in South America.
Text
4/9-Weekly EMA Crossover Strategy
I recently came across a reddit post from some random guy in Brazil. He mentioned the 4/9 EMA cross was pretty successfull so I wanted to try it.
Period = Weekly Initial Size = $1000 Stop Loss = -$50 Opening Condition = 4 period EMA > 9 period EMA Closing Conditions = Close < 20EMA

0 notes
Text
Weekly RSI Ascending/Descending (pt2)
Using daily candles for better precision. A continuation of https://www.tumblr.com/patrickbatoon/772173459217383424/weekly-rsi-ascendingdescending?source=share
---
The Weekly RSI trend strategy was incredibly promising, so I wanted to take this further with more granular data. For this exploration I ended up using Daily candle data of the Russell1000 with the same timeframe of 01-JAN-2020 to 01-JAN-2025
The core strategy remains the same:
Entry: 3 consecutive increases in weekly RSI(14) using RSI-smoothed(14). For daily candles this can be computed using RSI(70) and RSI-smoothed(70).
Exit: Close < EMA20: If the close of the stock crosses below the 20-day EMA, fully exit the position.
I ended up removing the 50-week EMA filter since I found it excludes key reversals.
Broad market entry conditions as filters:
$VIX - week over week decrease. The VIX measures expected 1-year volatility as a percentage. Increases in this measure is driven by Put/Call options pricing, however its primarily associated with Put buying for downside protection
$RSP - Closeempirically found that this acts as a filter for potential key reversals and breakouts
Results:
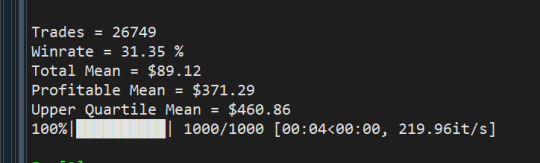
From 01-JAN-2020 to 01-JAN-2025 it appears that the winrate is much lower than the weekly backtests suggested, but it ends up catching more false signals on the day-to-day.
Trades = 6420 Winrate = 35.72 % Total Mean = $39.84 Profitable Mean = $194.94 Upper Quartile Mean = $266.74
From 01-JAN-2020 to 01-JAN-2025
Trades = 19168 Winrate = 38.62 % Total Mean = $40.43 Profitable Mean = $177.11 Upper Quartile Mean = $257.12
---
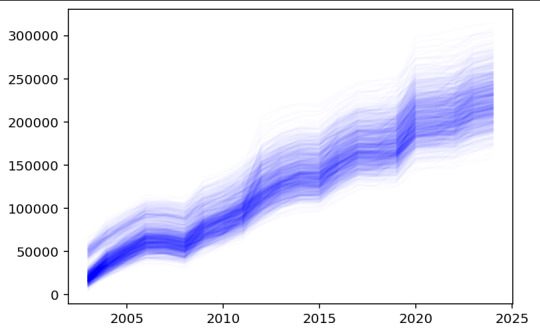
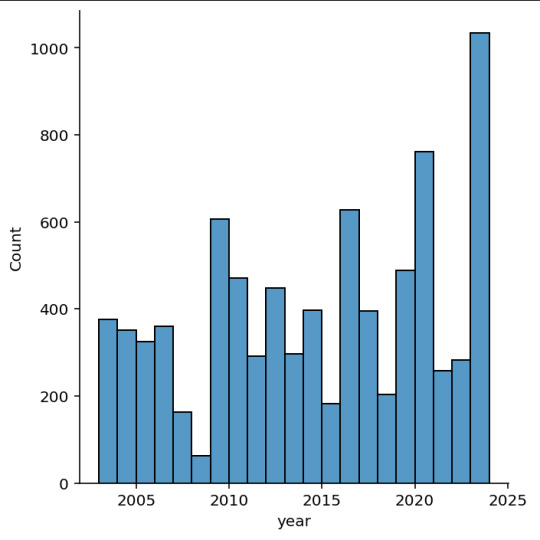
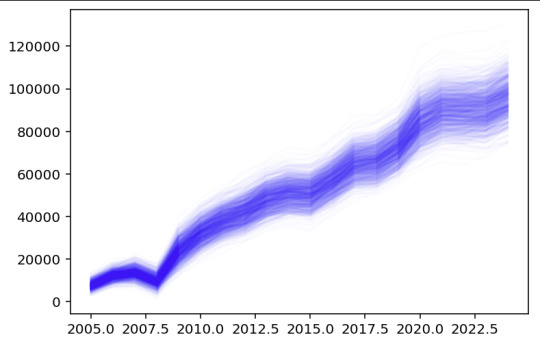
Lastly, with the vast number of trades included in the backtest, I wanted to simulate the universe of possible outcomes through a Monte Carlo simulation. This was done by sampling 120 trades per year (10 trades per month) and determining the portfolio growth.
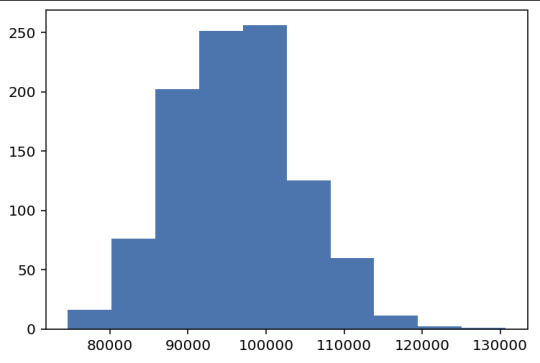
0 notes
Text
Weekly RSI Ascending/Descending
Update 20-JAN-2024: This post is superseded by more granular measurements on the daily timeframe.
Long only triggered by 3 consecutive increases in the 14-period moving average of the 14-period RSI. Exit after 2 consecutive decreases in RSI. The price also needs to be above the 50-week exponential moving average.

When backtested from 01-JAN-2020 through 08-JAN-2025 I get the following results
Size = $1000 Stoploss = -$50 Trades = 3623 Winrate = 45.85 % Total Mean = $49.34 Profitable Mean = $152.78 Upper Quartile Mean = $258.31
Notes:
RSI Value
When examining the RSI values of all the profitable trades, a pretty even emerges. I couldn't really gain much insight here except that most profitable trades were between RSI= 40-60

RSI Frequency for profitable trades
EMA Length
In the original backtest, I used an additional filter to ensure that stocks were in an uptrend (>EMA10), however this resulting in a large number of possible trades. This would be too difficult for a human to manage, so I tested a variety of SMA periods to get an appropriate filter. Turns out that EMA50 does an effective job at limiting false starts as an entry criteria.
EMA5 EMA10 EMA20 EMA50 Trades 3674 3706 3535 3361 Winrate 46.30% 47.17% 47.75% 48.68% Total Mean $50.08 $49.69 $48.03 $47.38 Profitable Mean $152.36 $147.04 $140.74 $135.31 Upper Quartile Mean $259.16 $253.11 $243.95 $238.02
Month
Because of seasonal market effects driven by options expiration and options flows, another aspect I wanted to look at was if there are particular months to put on trades.

Months frequency of most profitable trades. In other words, "what month were the most profitable trades placed?"
This is interesting because January is typically a seasonably weak month, for the S&P500, but it looks like November had almost zero winners in this backtest. Looks like June is the month where most profitable trades were placed, I'm wondering if this is due to triple witching?
Day
Lastly, I wanted to explore if a specific day produced good results. However I think i just found an idiosyncrasy in the data. For some reason, the 22nd appears to be the most frequent trade open date. However this may be due to how the yfinance API pulls close data.

Day frequency of most profitable trades. In other words, "what day were the most profitable trades placed?"
0 notes
Text
Trading Year 2024 Wrap Up
Portfolio Performance
In trading year 2024 I ran two active portfolios: big money (Roth IRA) and little money (WeBull) netting +32.71% and +45.23%, respectively. Overall, not bad performance this year - but my main thought was that I barely outperformed the S&P500 for A LOT of additional work.


Best Trades
The following trades were considered the best. These trades had insane breakouts
VKTX 93.29% - due to pre FDA news, then a massive spike earnings. I actually sold too early (at the bottom of the big spike) on this and I could've let it ride for an additional day.

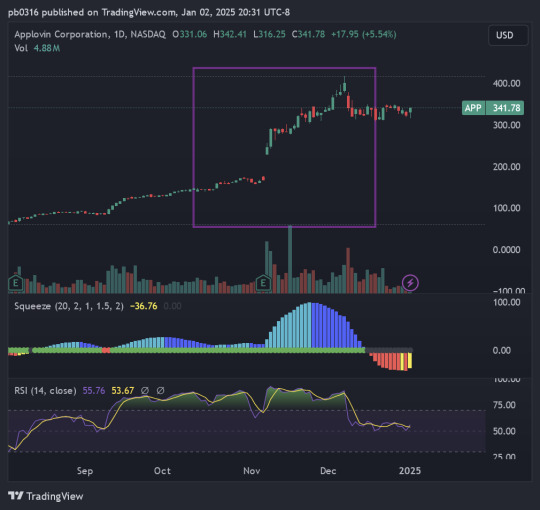
APP 66.77% - increasingly good earnings. Seems like people don't really know of this stock, but people related to advertising in the major technology spaces do. Looking back I believe there was an earlier entry in Sept instead
TOST 473.19% - increasingly good earnings as well. Maybe the revenge spending from COVID?

TSLA 58.11% - stock has been underperforming for most of 2023. I bought-in after a long period of tight consolidation

JMIA 63.54% - China meme stock

SVXY 38.62% - Atypical trade, but put this on when VIX spiked to 60. An easy VIX short

GOTU 26.13% - China meme stock

WIX 26.46%

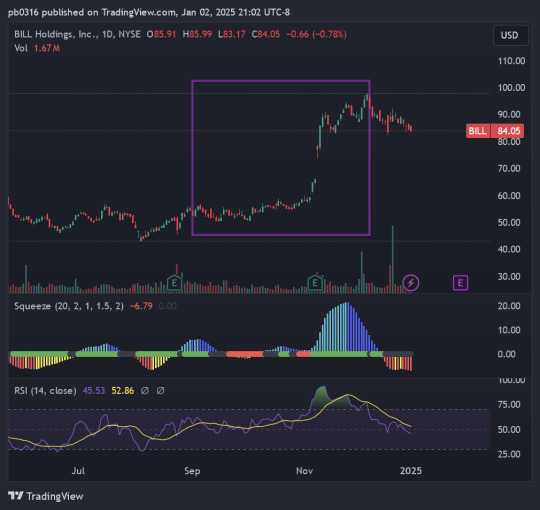
BILL 44.70%
Worst Trades
EW -29.82%
ADI 17.51%
ML -18.25%
GOEV -10.24%
CVNA -18.54%
GME -20.68%
I aim to have a -5% stop loss, but my absolute worse trades were due to forgetting a stop loss due to negligence or miscalculating the stop loss due to volatility.
Major Takeaways
For 2024 I ran two major strategies (1) Weekly TTM Squeeze and (2) Daily V/P Volatility Spike. Some major leanings would be to set extremely tight stops and to pre-calculate my stop levels here.
For many trades with positive +{PNL}% i initiated the trade too small, often 20% of the original capital I intended to deploy.
Next Steps
In the early parts of 2025, I'll be working further to refine my strategy by backtesting on the weekly timeframe more. I'd like to learn how to catch more sustained, macroeconomic based trends.
0 notes
Text
Building a statistically significant backtester
In discussions and study with popular trend following blogs, books, and videos I've always wondered why I struggled with profitability in my trades. This was really driving me crazy until I built by-hand my own even-driven backtester to help me prove to myself that this was not worth my time.
The backtester enters and exists trades based on a set of conditions on all the stocks within the S&P500. Using this approach, its roughly 2000 trades within a year!
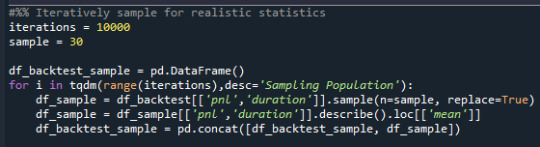
For a more realistic simulation of what a swing trader would do, I've also included a snippet of code to randomly sample 30 trades from that population, 10000 times. Not only would give me a sense of the "true" average expectancy/profitability values, this helps build statistics to build a nice confidence interval to establish statistical significance.
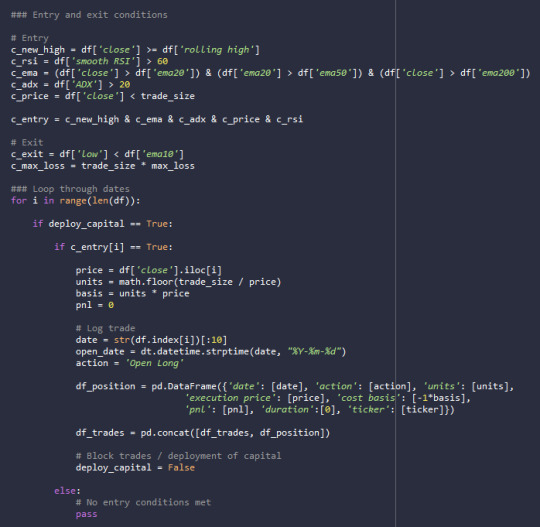
My losing strategy is defined below:
January 21, 2023 - 2024
New highs after 20 days
Price > 20 EMA, 20 EMA > 50 EMA, and Price > 200 EMA
Relative Strength Index (RSI) > 60
Average Directional Index > 20
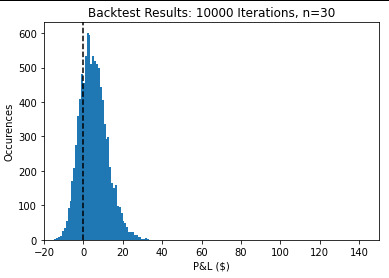
Based on the results, the average profit over the year is $5 based on $1000 capital at risk! Not only that, but the result is not statistically significant from Zero, so there is a high enough chance my yearly P&L would be negative.
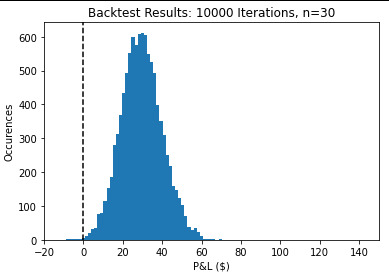
The crazy thing is that if I made a simple tweak, my mean P&L would be $30 and statistically significant to be profitable. However, $30 over the course of the year is likely less than the commissions paid!
Price < EMA200
All other conditions the same
0 notes
Text
Would you rather be lucky or good?
Ever since I finished high school I've always been interested in "The Markets" - particularly stocks and commodities. Since then, I've been learning how to exploit edges and extract as much value as I can out of it. This blog was set out to specifically journal out my process, research, and methodology in how I make bets. I've come to this realization much later than I wanted to, so hopefully, this inspires younger traders to follow a similar systematic approach and to help craft and define their own strategies
To be quite honest, I started in a time during an epic bull run, which can lead anyone to believe they're geniuses in the stock market. Most ending up "lucky" than good, causing people to give up their hopes for building and attaining wealth. People don't normally start these kinds of things unless they've been thoroughly gorilla smacked in the face, i.e. paying their tuition to the market, but still have a passion for trying to build a system that works for them.
I too have been thoroughly gorilla smacked, but here are some of the rules that worked for me.
Systematic Trend Following Rules
Entry Criteria
trading only the hot companies that have institutional investors flowing into them. If you haven't heard of it or there's no buzz about it, its not worth your time & consideration.
Stacked 20 and 50 exponential moving averages - this helps identify a trend. If Price > 20 EMA and 20 EMA > 50 EMA, you may have a possible lead
Relative strength index (RSI) greater than 50 - more confirmation on the direction of a trend
Average directional index (ADX) greater than 20 - probably the most useful of all to confirm "trendiness"
20-day New Highs - making new highs on a 20 day rolling period (otherwise known as a Donchian Channel breakout)
Risk Management
This is probably the most overlooked topic for all newbie traders. I based my risk on the amount of capital deployed.
Initial risk is 10% of the capital deployed - when I first started out, for $200 a trade, I could stomach a -$20 loss. Ultimately this is up to you, but choose something reasonable that allows you to fight another day.
I chose $200 as an original risk level since most interesting, high quality stocks are less than this price. Of course there are some really quality stocks above this, but come on no newbie is going to be slinging that kind of cash.
Trade Management and Exit
Exiting the trade is pretty simple as this just requires you to watch your positions everyday to see if they cross the 10 EMA.
To be quite honest, I haven't developed a technique to identify the specific point to ADD to the position, but this is in the works.
Close at 10 EMA - if the trend is your friend, then simply "trail" your exit point at the 10EMA mark
My hope is that this inspires you to follow a systematic approach when starting and learning how to trade. Backtesting and statistical details to come.
0 notes