
We provide many different kind of products and services related to stock pattern and technical analysis.
Don't wanna be here? Send us removal request.
Statistics
We looked inside some of the posts by patternsmart and here's what we found interesting.
Average Info
Notes Per Post
0
Likes Per Post
0
Reblog Per Post
0
Reply Per Post
0
Time Between Posts
1 month
Number of Posts By Type
Photo
17
Last Seen Tumblr Blogs


Fun Fact
Tumblr.com is the 103rd most visited website in the world.
Photo

New Post has been published on https://www.patternsmart.com/cn/auto-trend-line-indicator-and-market-analyzer-with-crossover-alert-for-ninjatrader-8/
Auto trend line indicator and Market Analyzer with crossover alert for NinjaTrader 8
Auto trend line indicator and Market Analyzer with crossover alert for NinjaTrader 8
The indicator will automatically plot the upper and lower trend lines based on the most recent swing points. It works on all timeframes that officially supported by Ninjatrader 8. Both indicator and Market Analyzer will alert on the following conditions.
Price Cross above upper trend line.
Price Cross below lower trend line.
Price Cross above lower trend line.
Price Cross below upper trend line.

Inputs:
Upper Right Strength: the number of bars on the left and right side of the peak C.
Upper Left Strength: the number of bars on the left and right side of the peak A.
Lower Right Strength: the number of bars on the left and right side of the trough D.
Lower Left Strength: the number of bars on the left and right side of the trough B.
"Alert rearm seconds" is the number of seconds an alert will rearm. For example, if you set it to 90, the alert will not be triggered within the next 90 seconds.

The Strength input is the number of bar on both sides of a swing point, for example, if we set Upper Right Strength to 3 as shown in the image below, it means that there must be at least 3 bars' high is lower than the Upper Right swing point's high on both sides. The same mechanism also apply to other Strength inputs.


The Market Analyzer makes possible to track price action related to trend lines in any timeframe. You may want to check this link (How to use ninjatrader Market Analyzer ) if you are not familiar with Market Analyzer. The inputs are similar in the Market Analyzer addon, just make sure you load enough bars, the number of bars to load should be at least 500.


You can add more than one column with different settings, the following pic is an example of two timeframes in two columns.

-
0 notes
Photo

New Post has been published on http://patternsmart.com/wp/stochrsi-pro-indicator-for-tradingview/
StochRSI PRO indicator for Tradingview
The Stochastic RSI technical indicator applies Stochastic Oscillator to values of the Relative Strength Index ( RSI ). The indicator thus produces two main plots FullK and FullD oscillating between oversold and overbought levels. This combination of indicators produces signals that tend to be more precise than those given by the RSI .
The interpretation of the indicator is similar to the original RSI's: valuable signals are often produced at crossovers of the main plot with overbought and oversold levels. However, the default values of these levels are slightly different: in the stochastic version, these are at 80 and 20, respectively. Actual indication of the crossovers can be enabled by adjusting the show breakout signals parameter value. The PRO version has the more than one average type on both RSI and Stochastic . RSI average type : simple, exponential, weighted, Wilder's, or Hull.
Stochastic average type: simple, exponential, weighted, Wilder's, or Hull.
-
0 notes
Photo

New Post has been published on http://patternsmart.com/wp/ninjatrader-8-schaff-trend-cycle-indicator-with-ema-sma-hma-wma-wilders-smooth-for-nt8/
NinjaTrader 8 Schaff Trend Cycle indicator with EMA, SMA, HMA, WMA, Wilder's smooth for NT8
The Schaff Trend Cycle (STC) is a technical indicator developed by Doug Schaff as an improvement on cycle oscillators and the MACD. The main idea behind this oscillator is to combine the benefits of trend and cycle indicators and minimize their drawbacks such as lags or false signals. The main purpose of the STC is to identify or confirm price direction and market turning points.
The STC is calculated as a double smoothed stochastic of the MACD, which outputs an oscillator that moves between 0 and 100. In trending markets, the oscillator is expected to move up if the market is in the accelerating uptrend; accelerating downtrends are supposed to push the oscillator down. In sideways markets, the STC indicates oversold conditions when it reverses after falling below 25; overbought conditions, when it turns down from above 75.
This NinjaTrader 8 has EMA, SMA, HMA, WMA, Wilder's moving average as smooth calculation.
It works on Bar chart, candlestick, Range, Tick, Volume, Renko, HA chart type and so on.


-
0 notes
Photo

New Post has been published on http://patternsmart.com/wp/prorealtime-swing-high-low-indicator-and-screener/
ProRealTime Swing High Low indicator and screener
This is a custom ProRealTime indicator, it works the same way as my TOS version's Swing High Low extension indicator and proscreener.
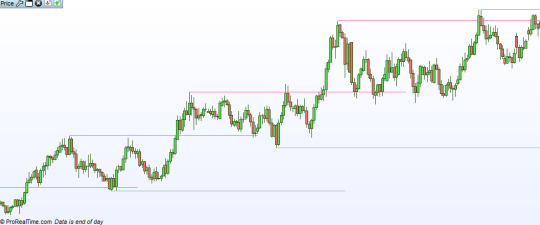
The Swing high low extension indicator will plot lines that represent the swing high low points based on the swing length input(number of bars to the left and right of the swing point).
Swing highs and lows can be used by traders to identify possible areas of support and resistance , which can then be used to determine optimal positions for stop-loss or profit target orders. If an indicator fails to create a new swing high while the price of the security does reach a new high, there is a divergence between price and indicator, which could be a signal that the trend is reversing.
Swing highs and swing lows are earlier market turning points. Hence, they are natural choices for projecting support and resistance levels. Every swing point is a potential support or resistance level. However, for effective trading, focus on major swing highs and lows.
This package includes Swing high low extension indicator and proscreener for ProRealTime. It works on any time frame(Tick, Minutes, Daily, Weekly, Monthly) and all markets(Stocks, Futures, Forex, Options,ETF, etc.)
The default SCAN will search any symbol that the Close cross below the swing low or cross above the swing high.
Please follow the steps below to import the indicator and proscreener:
Import all files that I sent to you.
After import the indicator, you will be able to add it to chart.
The input n represents the number of bars to the left and right of the swing point.
Please note: only the file SwingHighLow is for indicator.
SwingHigh-SCAN and SwingLow-SCAN are for ProScreener only, please do not load them on chart.


Here is how to create the screener:
1. find Proscreener tab, and click the icon shown in below
2. click 'New' button then copy & paste the code(in .txt file) I sent to you.
3. change it to your preferred name.

4. select a list to scan and click 'Execute' button.
5. repeat the steps 1-4 for both swing high and low scans.

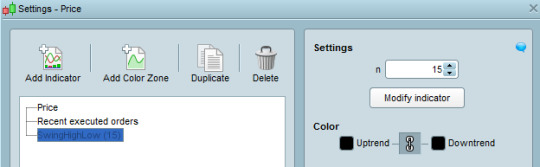
Once the New screener is created, you can change the input n by clicking on 'Modify' the screener file as shown below

The default setting of the ProScreener is to scan if the price close above or below the current swing high or low.
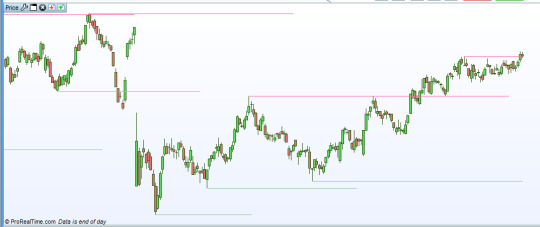
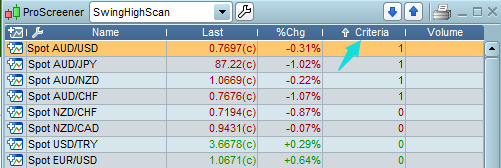
The picture below is an example of price close above the current swing high, you will get 'Criteria'=1 in ProScreener when you execute swing high scan.
The swing ProScreener can also be customized to meet your needs.
Please send me the details if you want a different screener.
-
0 notes
Photo

New Post has been published on http://patternsmart.com/wp/thinkorswim-tos-automatic-trend-lines-study-indicator-with-alert-scan-custome-quote-watchlist-screener/
ThinkorSwim TOS Automatic trend lines study indicator with alert scan custome quote watchlist screener
This package includes the Thinkorswim TOS Auto Trend line indicator, Trend line breakout SCAN and custom quote for watchlist.
The Trend line indicator plots lines for both uptrend and downtrend.
The line above the price is formed by two recent swing highs, and the line below the price is formed by two recent swing lows.
You will be able to define the strength of swing high and low in order to detect long term, mid term and short term trend lines. The input Strength is the number of bars on the left and right side of the swing point.
It will alert when the price either cross above the upper trend line, or cross below the lower trend line.
It works on any timeframe and all kind of securities (Stock, Forex, Futures, etc.)
The Trend line SCAN will search and find all symbols with last price that closes above the upper trend line or below the lower trend line.
The SCAN and custom quote can also be customized to meet your requirement.
You can always apply this indicator multiple times with different "Strength" settings to detect long term, mid term and short term trend lines on the same chart. For example, you can use one with Strength=6 and another with Strength=12. In fact, you can add it as many times as you like, just like the moving average indicator.


The custom quote will show the relative position of current price in watchlist.
If Close is above the upper trend line, it will show "Above"
If Close is below the lower trend line, it will show "Below"
If Close is between the upper and lower trend line, it will show "Between"
You can apply it to more than one column with different timeframe.


-
0 notes
Photo

New Post has been published on http://patternsmart.com/wp/ninjatrader-8-rsi-triple-divergence-indicator-and-market-analyzer-for-nt8/
NinjaTrader 8 RSI Triple Divergence indicator and Market Analyzer for NT8.
Divergence is very common and useful in technical analysis. It indicates possible reversal signals when there are discrepancies between RSI and price movement.
The definition of divergence is when price and indicator move in different direction,
for instance, when price is in uptrend and reaches a higher high where the indicator is in downtrend.
Update Notes: added hidden divergence type.
A hidden divergence is where price has a higher LOW but the indicator has a relative lower value, as shown in the pic below.

There will be a 'H' drawn under a hidden bullish divergence.
A 'R' drawn under a regular bullish divergence.

It also true if price has a lower HIGH but the indicator has a relative higher value.

There will be a 'H' drawn under a hidden bearish divergence.
A 'R' drawn under a regular bearish divergence.

What is RSI Triple Divergence?
The concept of triple divergence is intuitional, if there are three continueous divergences in a row between current High and previous Peak then it will trigger a signal.
For example, a bearish RSI triple divergence is shown in the chart below, bar A is current High and it has a RSI divergence with bar B which is previous peak. Divergence also exists between A and C (the 2nd previous peak) as well as A and D(the 3rd previous peak).

The following chart is a bullish RSI triple divergence. There is divergence between bar A and bar B (previous trough), bar A and bar C (2nd previous trough), bar A and bar D (3rd previous trough).

Why Triple Divergence? Is it better than normal divergence?
I have created many single divergence indicators on different platforms but they only check the divergence in one of the three terms, short-term, mid-term or long-term. Regular divergence indicator will not exam all three terms at the same time, but Triple Divergence is capable of completing the task.
Sometimes there are too many divergence appear in a short range for the normal divergence indicator.
Let see these two charts below, the first one is Triple Divergence.


The 2nd one is normal divergence which has more signals.
More signals is not necessary a bad thing, but a signal (Triple Divergence) is confirmed via short, mid and long terms could be more solid.
It doesn't necessarily mean the Triple Divergence is definitely better than the normal version, they detect signals from different angles.
Features:
Instant signal on current(last) bar, no repaint.
Alert when a signal appear.
Select different sound alert files.
Enable to show lines between Highs and Lows.
Please note: it doesn't work in Renko chart.
You can add new sound files to your NT8\sounds directory.


The following video shows how it plots in realtime.
Just updated the new feature "Enhanced mode".


More screenshots.


It also comes with a Market Analyzer which makes it possible to track signals within any timeframe. The input "Range" is used to check if there was a signal within the given number of bars.


-
0 notes
Photo

New Post has been published on http://patternsmart.com/wp/ninjatrader-8-triangle-chart-pattern-indicator-for-nt8/
NinjaTrader 8 Triangle Chart pattern indicator for NT8
This indicator will automatically detect all three types of triangle chart patterns, the symmetrical triangle, the descending triangle and the ascending triangle.
It will draw two trend lines of the triangle on chart when the pattern is formed.
Features:
Drawing Triangle chart pattern for both realtime and historical data.
Adjustable length of pattern legs.
Using different combination of parameters, you can easily identify the Triangle pattern in short term, mid term and long term.
It works on most of the time frames and chart types, including: minutes, daily, weekly, monthly, tick, renko, range, Heiken Ashi, etc.
Adjustable length of extension lines.
Switch for showing latest pattern only or show all history patterns found on chart.
Select different sound alert files with switch.
Editable trend line color.
The following image shows how alert works, whenever a Triangle pattern is detected you should be able to hear the alert sound. If the Alert log window is opened you can also see the alert message listed there.
It also comes with a standalone Market Analyzer script.
This Market Analyzer script is able to show when the latest Triangle Chart pattern formed within a given range.
The only input you need to pay attention is the "Range" input, it defines the number of bars used to check when the latest Triangle Chart pattern formed.
Make sure the "Range" input is less than "Bars to load" and "Max bar look bar" settings.
The following image is an example of how the Market Analyzer Column display.
Click an image to view at full size
-
0 notes
Photo

New Post has been published on http://patternsmart.com/wp/ninjatrader-8-adx-triple-divergence-indicator-and-market-analyzer-for-nt8/
NinjaTrader 8 ADX Triple Divergence indicator and Market Analyzer for NT8.
Divergence is very common and useful in technical analysis. It indicates possible reversal signals when there are discrepancies between ADX and price movement.
The definition of divergence is when price and indicator move in different direction,
for instance, when price is in uptrend and reaches a higher high where the indicator is in downtrend.
What is ADX Triple Divergence?
The concept of triple divergence is intuitional, if there are three continueous divergences in a row between current High and previous Peak then it will trigger a signal.
More signals is not necessary a bad thing, but a signal (Triple Divergence) is confirmed via short, mid and long terms could be more solid.
It doesn't necessarily mean the Triple Divergence is definitely better than the normal version, they detect signals from different angles.
Features:
Instant signal on current(last) bar, no repaint.
Alert when a signal appear.
Select different sound alert files.
Enable to show lines between Highs and Lows.
Please note: it doesn't work in Renko chart.
Market Analyzer with alert.
You can add new sound files to your NT8\sounds directory.


It also comes with a Market Analyzer which makes it possible to track signals within any timeframe. The input "Range" is used to check if there was a signal within the given number of bars.
You can add more than one column as different timeframes with different settings.


The following chart is a bullish ADX triple divergence.

A bearish ADX triple divergence is shown in the chart below

Why Triple Divergence? Is it better than normal divergence?
I have seen many divergence indicators on different platforms but they only check the divergence in one of the three terms, short-term, mid-term or long-term. Regular divergence indicator will not exam all three terms at the same time, but Triple Divergence is capable of completing the task.
Sometimes there are too many divergence appear in a short range for the normal divergence indicator.
Click an image to view at full size.


-
0 notes
Photo

New Post has been published on http://patternsmart.com/wp/ninjatrader-8-cci-triple-divergence-indicator-and-market-analyzer-for-nt8/
NinjaTrader 8 CCI Triple Divergence indicator and Market Analyzer for NT8.
Divergence is very common and useful in technical analysis. It indicates possible reversal signals when there are discrepancies between CCI and price movement.
The definition of divergence is when price and indicator move in different direction,for instance, when price is in uptrend and reaches a higher high where the indicator is in downtrend.
What is CCI Triple Divergence?
The concept of triple divergence is intuitional, if there are three continueous divergences in a row between current High and previous Peak then it will trigger a signal.
More signals is not necessary a bad thing, but a signal (Triple Divergence) is confirmed via short, mid and long terms could be more solid.
It doesn't necessarily mean the Triple Divergence is definitely better than the normal version, they detect signals from different angles.
Features:
Instant signal on current(last) bar, no repaint.
Alert when a signal appear.
Select different sound alert files.
Enable to show lines between Highs and Lows.
Please note: it doesn't work in Renko chart.
Market Analyzer with alert.
Enhanced mode will check if all three divergence are consistent
Works in all timeframes.
You can add new sound files to your NT8\sounds directory.
It also comes with a Market Analyzer which makes it possible to track signals within any timeframe. The input "Range" is used to check if there was a signal within the given number of bars.
You can add more than one column as different timeframes with different settings.

Why Triple Divergence? Is it better than normal divergence?
I have seen many divergence indicators on different platforms but they only check the divergence in one of the three terms, short-term, mid-term or long-term. Regular divergence indicator will not exam all three terms at the same time, but Triple Divergence is capable of completing the task.
Sometimes there are too many divergence appear in a short range for the normal divergence indicator.
Click an image to view at full size.


-
0 notes
Photo

New Post has been published on http://patternsmart.com/wp/ninjatrader-8-dmi-triple-divergence-indicator-and-market-analyzer-with-alert-for-nt8/
NinjaTrader 8 DMI Triple Divergence indicator and Market Analyzer with alert for NT8.
Divergence is very common and useful in technical analysis. It indicates possible reversal signals when there are discrepancies between DMI and price movement.
The definition of divergence is when price and indicator move in different direction,for instance, when price is in uptrend and reaches a higher high where the indicator is in downtrend.
What is DMI Triple Divergence?
The concept of triple divergence is intuitional, if there are three continueous divergences in a row between current High and previous Peak then it will trigger a signal.
More signals is not necessary a bad thing, but a signal (Triple Divergence) is confirmed via short, mid and long terms could be more solid.
It doesn't necessarily mean the Triple Divergence is definitely better than the normal version, they detect signals from different angles.
Features:
Instant signal on current(last) bar, no repaint.
Alert when a signal appear.
Select different sound alert files.
Enable to show lines between Highs and Lows.
Please note: it doesn't work in Renko chart.
Market Analyzer with alert.
Enhanced mode will check if all three divergence are consistent
Works in all timeframes.
You can add new sound files to your NT8\sounds directory.
It also comes with a Market Analyzer which makes it possible to track signals within any timeframe. The input "Range" is used to check if there was a signal within the given number of bars.
You can add more than one column as different timeframes with different settings.

Why Triple Divergence? Is it better than normal divergence?
I have seen many divergence indicators on different platforms but they only check the divergence in one of the three terms, short-term, mid-term or long-term. Regular divergence indicator will not exam all three terms at the same time, but Triple Divergence is capable of completing the task.
Sometimes there are too many divergence appear in a short range for the normal divergence indicator.
Click an image to view at full size.


-
0 notes
Photo

New Post has been published on http://patternsmart.com/wp/ninjatrader-8-macd-triple-divergence-indicator-and-market-analyzer-with-alert-for-nt8/
NinjaTrader 8 MACD Triple Divergence indicator and Market Analyzer with alert for NT8.
Divergence is very common and useful in technical analysis. It indicates possible reversal signals when there are discrepancies between MACD and price movement.
The definition of divergence is when price and indicator move in different direction,for instance, when price is in uptrend and reaches a higher high where the indicator is in downtrend.
What is MACD Triple Divergence?
The concept of triple divergence is intuitional, if there are three continueous divergences in a row between current High and previous Peak then it will trigger a signal.
More signals is not necessary a bad thing, but a signal (Triple Divergence) is confirmed via short, mid and long terms could be more solid.
It doesn't necessarily mean the Triple Divergence is definitely better than the normal version, they detect signals from different angles.
Features:
Instant signal on current(last) bar, no repaint.
Alert when a signal appear.
Select different sound alert files.
Enable to show lines between Highs and Lows.
Please note: it doesn't work in Renko chart.
Market Analyzer with alert.
Enhanced mode will check if all three divergence are consistent
Works in all timeframes.
You can add new sound files to your NT8\sounds directory.
It also comes with a Market Analyzer which makes it possible to track signals within any timeframe. The input "Range" is used to check if there was a signal within the given number of bars.
You can add more than one column as different timeframes with different settings.

Why Triple Divergence? Is it better than normal divergence?
I have seen many divergence indicators on different platforms but they only check the divergence in one of the three terms, short-term, mid-term or long-term. Regular divergence indicator will not exam all three terms at the same time, but Triple Divergence is capable of completing the task.
Sometimes there are too many divergence appear in a short range for the normal divergence indicator.
Click an image to view at full size.


-
0 notes
Photo

New Post has been published on http://patternsmart.com/wp/ninjatrader-8-williamsr-triple-divergence-indicator-and-market-analyzer-with-alert-for-nt8/
NinjaTrader 8 WilliamsR Triple Divergence indicator and Market Analyzer with alert for NT8.
Divergence is very common and useful in technical analysis. It indicates possible reversal signals when there are discrepancies between WilliamsR and price movement.
The definition of divergence is when price and indicator move in different direction,for instance, when price is in uptrend and reaches a higher high where the indicator is in downtrend.
What is WilliamsR Triple Divergence?
The concept of triple divergence is intuitional, if there are three continueous divergences in a row between current High and previous Peak then it will trigger a signal.
More signals is not necessary a bad thing, but a signal (Triple Divergence) is confirmed via short, mid and long terms could be more solid.
It doesn't necessarily mean the Triple Divergence is definitely better than the normal version, they detect signals from different angles.
Features:
Instant signal on current(last) bar, no repaint.
Alert when a signal appear.
Select different sound alert files.
Enable to show lines between Highs and Lows.
Please note: it doesn't work in Renko chart.
Market Analyzer with alert.
Enhanced mode will check if all three divergence are consistent
Works in all timeframes.
You can add new sound files to your NT8\sounds directory.
It also comes with a Market Analyzer which makes it possible to track signals within any timeframe. The input "Range" is used to check if there was a signal within the given number of bars.
You can add more than one column as different timeframes with different settings.

Why Triple Divergence? Is it better than normal divergence?
I have seen many divergence indicators on different platforms but they only check the divergence in one of the three terms, short-term, mid-term or long-term. Regular divergence indicator will not exam all three terms at the same time, but Triple Divergence is capable of completing the task.
Sometimes there are too many divergence appear in a short range for the normal divergence indicator.
Click an image to view at full size.


-
0 notes
Photo

New Post has been published on http://patternsmart.com/wp/ninjatrader8-broadening-formation-chart-pattern-indicator-for-nt8/
NinjaTrader8 Broadening Formation Chart pattern indicator for NT8
This indicator will automatically detect Broadening Formation chart pattern.
It will draw two trend lines of the Broadening Formation on chart when the pattern is formed.
Features:
Drawing Broadening Formation chart pattern for both realtime and historical data.
Adjustable length of pattern legs.
Using different combination of parameters, you can easily identify the Broadening Formation pattern in short term, mid term and long term.
It works on most of the time frames and chart types, including: minutes, daily, weekly, monthly, tick, renko, range, Heiken Ashi, etc.
Adjustable length of extension lines.
Switch for showing latest pattern only or show all history patterns found on chart.
Select different sound alert files with switch.
Editable trend line color.
Click an image to view at full size.
-
0 notes
Photo

New Post has been published on http://patternsmart.com/wp/ninjatrader-8-falling-wedge-chart-pattern-indicator-for-nt8/
NinjaTrader 8 Falling Wedge Chart pattern indicator for NT8
This indicator will automatically detect Falling Wedge chart pattern.
It will draw two trend lines of the Falling Wedge on chart when the pattern is formed.
Features:
Drawing Falling Wedge chart pattern for both realtime and historical data.
Adjustable length of pattern legs.
Using different combination of parameters, you can easily identify the Falling Wedge pattern in short term, mid term and long term.
It works on most of the time frames and chart types, including: minutes, daily, weekly, monthly, tick, renko, range, Heiken Ashi, etc.
Adjustable length of extension lines.
Switch for showing latest pattern only or show all history patterns found on chart.
Select different sound alert files with switch.
Editable trend line color.
Click an image to view at full size.
-
0 notes
Photo

New Post has been published on http://patternsmart.com/wp/ninjatrader8-rising-wedge-chart-pattern-indicator-for-nt8/
NinjaTrader8 Rising Wedge Chart pattern indicator for NT8
This indicator will automatically detect Rising Wedge chart pattern.
It will draw two trend lines of the Rising Wedge on chart when the pattern is formed.
Features:
Drawing Rising Wedge chart pattern for both realtime and historical data.
Adjustable length of pattern legs.
Using different combination of parameters, you can easily identify the Rising Wedge pattern in short term, mid term and long term.
It works on most of the time frames and chart types, including: minutes, daily, weekly, monthly, tick, renko, range, Heiken Ashi, etc.
Adjustable length of extension lines.
Switch for showing latest pattern only or show all history patterns found on chart.
Select different sound alert files with switch.
Editable trend line color.
Click an image to view at full size.
-
0 notes
Photo

New Post has been published on http://patternsmart.com/wp/ninjatrader8-bullish-pennant-chart-pattern-indicator-with-alert-for-nt8/
NinjaTrader8 Bullish Pennant Chart pattern indicator with alert for NT8
This indicator will automatically detect Bullish Pennant chart pattern.
It will draw two trend lines of the Bullish Pennant on chart when the pattern is formed.
Features:
Drawing Bullish Pennant chart pattern for both realtime and historical data.
Adjustable length of pattern legs.
Using different combination of parameters, you can easily identify the Bullish Pennant pattern in short term, mid term and long term.
It works on most of the time frames and chart types, including: minutes, daily, weekly, monthly, tick, renko, range, Heiken Ashi, etc.
Adjustable length of extension lines.
Switch for showing latest pattern only or show all history patterns found on chart.
Select different sound alert files with switch.
Editable trend line color.

Click an image to view at full size.
-
0 notes
Photo

New Post has been published on http://patternsmart.com/wp/ninjatrader-nt8-bearish-pennant-chart-pattern-indicator-with-alert/
NinjaTrader NT8 Bearish Pennant Chart pattern indicator with alert
This indicator will automatically detect Bearish Pennant chart pattern.
It will draw two trend lines of the Bearish Pennant on chart when the pattern is formed.
Features:
Drawing Bearish Pennant chart pattern for both realtime and historical data.
Adjustable length of pattern legs.
Using different combination of parameters, you can easily identify the Bearish Pennant pattern in short term, mid term and long term.
It works on most of the time frames and chart types, including: minutes, daily, weekly, monthly, tick, renko, range, Heiken Ashi, etc.
Adjustable length of extension lines.
Switch for showing latest pattern only or show all history patterns found on chart.
Select different sound alert files with switch.
Editable trend line color.
Click an image to view at full size.
-
0 notes