
Don't wanna be here? Send us removal request.
Statistics
We looked inside some of the posts by real-circle and here's what we found interesting.
Average Info
Notes Per Post
3
Likes Per Post
3
Reblog Per Post
0
Reply Per Post
0
Time Between Posts
6 days
Number of Posts By Type
Text
15
Photo
2
Last Seen Tumblr Blogs


Fun Fact
Tumblr.com rank in the US is 25.
Text
All my code for this project is now available here: https://git.arts.ac.uk/19016559/BikeExperienceTracker It’s divided into two sections, clueProgram deals with the micropython code used by the clue, and postProcessing is the html + js code for processing and presenting the clue’s data
0 notes
Text
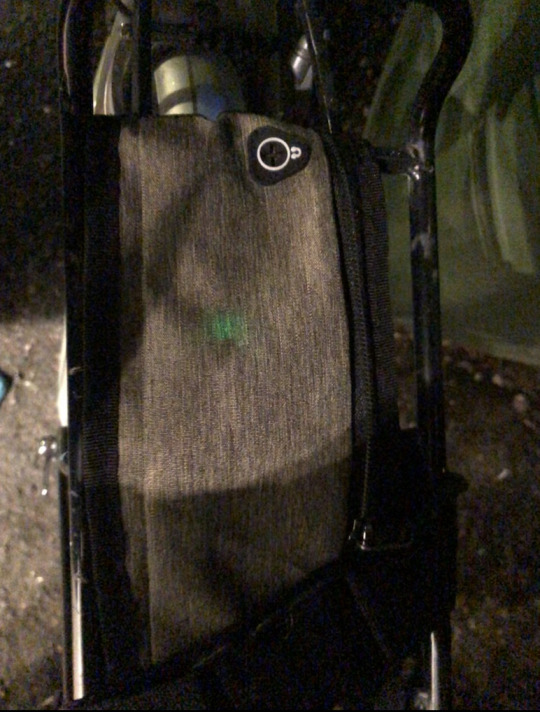
For the cycling trips I attached the tracker to my bike rack in a pouch. The pouch’s material is thin enough that I can see the gps module’s lights. It flashes at 1hz if it has a fix, so this meant I could check that the program was still running. I secured the pouch tightly with elactic so the tracker would stay in place, and with a consistent orientation, to keep my acceleration readings accurate. Also, the gps module needs to face upwards to get best readings. I had initially wanted to make a case that revealed the screen and buttons of the tracker to use during trips... but due to very rainy weather this week, I decided to go with this completely covered approach.
0 notes
Text
A frustrating problem I have faced is the clue occassionally crashing mid journey, and stopping recording data. It is not the worst in that all data recorded up until that point is saved - it writes to memory every loop of sensing. I initially only saved the data at the end of every journey - holding a button down caused it to write to a file, safely close the file and quit. Opening and closing the file every loop is slower... but as I have this unexplained crashing journey and only want to collect data every second... its much preferable. It crashes with an error about an unsupported operation being performed in the gps module. I wonder if it is a bad connection? I had thought it might be low battery, or a problem with unexpected coordinate values being sent to my program if gps signal was lost, but as far as I can tell these were both dead ends.
0 notes
Photo


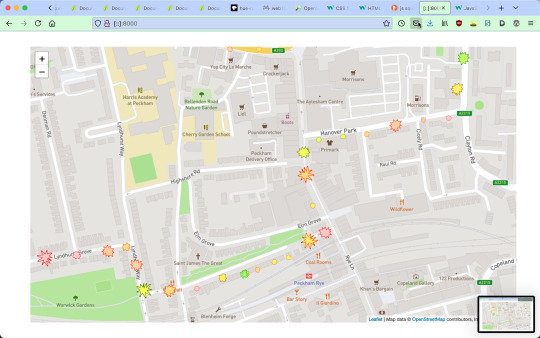
These are the four sprites I use to represent bumpiness, with the circle being least bumpy, through to the super spiky shape for the most bumpy.
They are recoloured in the map using css hue-rotate
0 notes
Text
I have reached the output that I had hoped for for this project, as well as done a lot of experimenting and trouble shooting.
Below I will list my current process for the data, as well as notes on things I learnt and what has changed from previous versions.
I learnt how to use leaflet js and spent a while deciding on appropriate post processing for my data.
First I convert my csv file into json.
I setup my html and javascript files, and link to leaflet js and the mapbox api i use to get the visual map data (i had to make an account and generate an access key for this)
Then I use a reducing function, that compares the lat and lon of a data entry to the previous one. If the distance is greater than a threshold, it is added to a new array that I use for drawing.
I added this function as the map got very messy around patches where I had stopped for whatever reason, with large clumps of overlapping points.
let dataSet = XdataSet.reduce((data, item, index) => { let prev = data[data.length - 1] if (distance(item, prev) > 0.0002) { return data.concat(item) } return data }, [{lat: 0, lon: 0}]) function distance(curItem, prevItem){ let x = curItem.lat - prevItem.lat let y = curItem.lon - prevItem.lon var bep = Math.sqrt(x ** 2 + y ** 2) return(bep)}
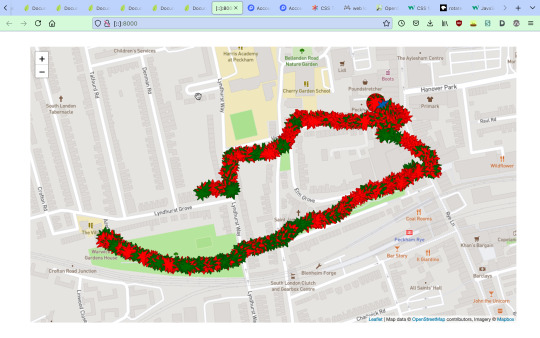
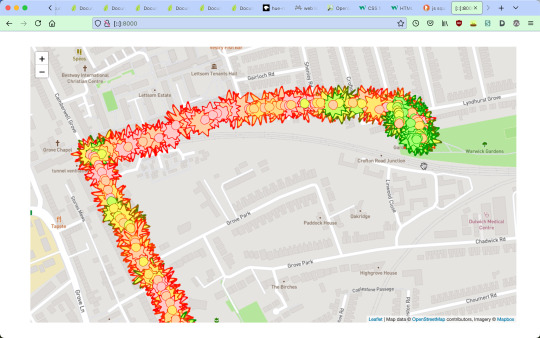
On the map, the colour of an icon represents noise level, and the sprite shape and scale represents the bumpiness(acceleration). To ensure a mix of colours, sizes and shapes on each map, the thresholds for these catagories are derived for each dataset. For example with the noise level, I sort the dataset by noise level, and then grab the values at incriments through this list, to use as thresholds for comparing every point to while drawing. I also rotate each icon a random amount, so the sprites dont look repetitive. I experimented with using a wider spectrum of colours to represent noise level, but decided to limit it to a green => red range, for its connotations of calmness/danger
0 notes


Text
GPS tracking and data storage
The data collected is saved in CSV format, so I can easily manipulate it later.
When the clue boots and makes a new file, I write the heading names to it: dataInstance.write("lat,lon,sound,accel0,accel1,accel2\n")
Then every loop of data recording I write the list of values, seperated by commas and ended with a newline to it: dataInstance.write(lat + "," + lon + "," + sound + "," + str(accel[0]) + "," + str(accel[1]) + "," + str(accel[2]) + "\n")
I decided that I will record sensor values directly to the clue, instead of doing data processing like mapping or combining values, and do all data processing in my secondary processing. This is because it will be much easier to work in a trial-and-error manner when I am not having to wait for the clue to boot... the gps module to connect... and reading feedback from the small terminal printout on the clue’s little screen.
I had been assuming I would need to pre-process the sensor data before storing it to conserve space in the clue’s relatively small 2MB total internal storage. But upon calculating the rough memory needed to run the program, I found that space will probably not be an issue.
All my data will be stored as strings. Each loop I will store the values:
Latitude: 9 bytes Longitude: 9 bytes Sound level: 5 bytes X Acceleration: 9 bytes Y Acceleration: 9 bytes Z Acceleration: 9 bytes And also:
5 x Commas: 5 bytes 1 x Newline: 1 byte This totals 56 bytes per loop. If I record values once every second, this will be 3360 bytes / minute. I think 1 loop a second will definitely be high enough frequency to capture changes in acceleration, noise and position. For a twenty minute journey this would amount to 67,200 bytes, or ~ 67KB... which is not much at all!

First successful gps tracking! I was worried about how long the gps module would take to find its gps location, but it took only about 2 minutes during my first test, and about 8 during the second. After that the location recorded was really accurate!

This is a graph plotting of the lat and long values recorded to the clue.
0 notes
Text
Progress update
My progress has so far been slower and more frustrating than I had hoped ;_;
My first hurdle was with writing to files on the clue. Using python read and write actions is something quite familiar to me, so I hadn/t worried about doing this. But the clue has two ‘modes’ -- it can either write to its own files, or be writeable via usb - not both at the same time. So I needed to work out a way to switch between these modes, which took me a loooong time.
After this I was able to write sound values to a file in a simple loop. To make sure I don’t write over files, I used another loop - every time the clue boots it reads the value of my counter.txt file (which is initially 0), creates a new file to write to (value.txt) and increments the value of counter.txt.
Test output of sound level values!

My next step was to try out the gps breakout, but as I continued working on this the clue became reformatted. I don’t know how this happened, and as I had been writing my code directly to the device this meant I lost everything I’d written so far. Sigh. From now on I will write my code locally, and copy it over when I want to update the clue. I am still in the process of getting my read/write mode switcher to work again... can’t remember how it worked... and have taken about a week’s break as I found the reformatting fairly disheartening.
1 note
·
View note
Text
Project brief
These are my current goals for the project. I may end up extending or reducing my scope as there’s a fair amount of new stuff to learn and I’m not sure how much I will be able to get done.
Bill Of Materials:
Adafruit Clue
Adafruit Mini GPS breakout
Stemma Connector
Coin battery for the GPS board
9V battery for the Clue
Housing to include securing to bike handlebars -- TBC
Project Goals:
Each time the program is launched it creates a new file
At regular intervals it writes sound level, movement/bumpiness/change in position, and gps coordinates (lat long) to this file(csv format?). The program will also map sound and movement values to nicer ranges, that i need to define.
I will have a second program, i think using javascript and leaflet.js that will parse this data file and output my route (gps coords) on a map, with line quality representing sound and movement.
1 note
·
View note
Text
Plan for mini project
larger project
i want to make something to attach to my bike, to track some aspect of a journey.
maybe:
using an accelerometer or gps tracker to track a journey
sound? tracking noise level
speed?
bumpiness?
maybe i could track a couple of these things, and combine with gps data (using my phone?) to present a graph of a map... sort of like google maps traffic plotting.
choosing micro controller:
Arduino Leonardo
Raspberry Pi Pico
Adafruit CLUE
Adafruit Metro M4
Adafruit PyGamer
Teensy 4.1
Adafruit Feather RP2040
Adafruit Circuit Playground Express
BBC Micro:bit
Matrix Portal M4
Qualitative route mapping!
Tracking noise level and bumpiness (elevation?) over a route (gps tracking), afterwards plotting this route visually (similar to google maps traffic level colour coordinated maps)
During a journey i will need to track and store sound level and movement of some kind.. and possibly gps location. or record location on phone or smthn in a way that i could combine it with the other things.
needs:
gps sensor
bumpiness sensor
noise sensor
mapping application? (probably something that i can draw on top of?? idk
0 notes
Text
opening up a solar powered dancing toy

it was quite easy to open up - running a blade along a crack around the bottom and bending it way too hard until it popped open. I read this cool article someone made about opening up a versy similar toy and talking about how it works electrically.
Essentially the solar energy is released to the circuit in pulses by the capacitor and a little integrated circuit, and as the coiled wire is electrified it becomes an electromagnet, pulling the magnet towards it and releasing it, causing the bird to rhythmically rock sideways.

I wanted to attach a buzzer to the circuit, with hope that the pulsing current would create a warping sound, but it didnt work :(
Learning a bit more about the capacitor and curcuit: The capacitance is the amount of charge stored in a capacitor per volt of potential between its plates. Capacitance can be calculated when charge Q & voltage V of the capacitor are known:
C = Q/V
V = 10v
C = 470uF
Q = 4.7mC
The toy completes a cycle of motion about once a second, so I think using I = Q/T the current is maybe around 1 amp which is pretty low. I also realised that when using the buzzer with the arduino it is supplied with an oscillation, using PWM, so this slow pulse of DC would not have worked anyway...

i tried connecting an led across the circuit as i know it takes a direct current, but also had no luck
finally i connected the circuit to a multimeter to both check it was still working, and find out what its current range was. As far as I could tell it oscillated from 0 to about 0.55 amps... so not much. I think with this small current I could connect it as an input to the arduino and use it that way... but this would basically have the value of a regular tick... that i could much more easily create digitally. Maybe I should take the solar cell out and try and use that for something interesting?
0 notes
Text
first etextiles project
i sewed a patch of conductive thread onto the index finger of a wool glove -- now i can use my phone more easily while cycling!!


The phone has a capacitive phone screen, which reacts to changes in capacitance - “how two conductive objects with a space between them respond to a voltage difference applied to them“. Touch screen gloves work by creating a conductive corridoor between your finger, through the inslutative glove, to the screen.
For this project the thread is not used to create a circuit as it would be elsewhere... the idea here is to build up a big pad to make sure enough current is conducted, its fine if the different threads touch.
0 notes
Text
I had a go with IFTTT- sending a tweet every hour stating the time. It was really easy to set up! but i would really like to try working with APIs in a more hands on way, as IFTTT’s simple interface was quite abstracted from their workings.
I am wondering about buying a wifi shield for the Leonardo - they seem very cheap, and I would really like to try out some of the examples that require them! I tried to find out how to use IFTTT using the serial port on my arduino... I think it can be done using Adafruit IO? But I am still trying to work it out.
I think this instructables twitter enabled coffee pot might be a useful place to start with this?
I am still really struggling to get basic circuits to work! 😅 spending a lot more time on work for this unit than other uni work and getting a lot less done... so much to work on!
0 notes
Text
I finally got the owl ldr processing sample coding working after a lot of trying! some problems i came into:
I struggled for a long time to get the simple LDR test circuit to work- the serial port would just print a gently oscillating number, sometimes around 910, sometimes around 800… I wondered if my circuit was faulty, or maybe the component had polarity, or a wire was loose, but in the end I think the LDR was faulty as when I replaced it with the other one that came in my pack the circuit worked fine.
cant read from the arduino’s serial port in processing while reading from it in the arduino ide (serial print) ‘port in use’.
i increased the size of the owl as with my sensor it always seems to be quite small -I couldnt work out why my sketch was only running successfully about ¼ times… it was because thee variable set to incoming data was not always set by the time the draw loop was called, so i needed to give it an initial value (empty string);
I added a sun to the sketch: it changes colour and its rays get longer in response to light. on click the rays change positon.
import processing.serial.*; Serial myPort; // The serial port String inString = ""; // Input string from serial port int lf = 10; float scale = 0; float adder;// ASCII linefeed String photoSensorRead; //for text array for output from arduino float n; //for raw value from arduino int brightness; //for adjusted value from arduino void setup(){ size(1280, 720); myPort=new Serial(this, "/dev/cu.usbmodem14201", 9600); myPort.bufferUntil(lf ); } void draw(){ background(150,200,255);//read photosensor value from serial port if (inString.length() > 0){ n = float(Integer.parseInt(inString.trim())); randomSeed(0); scale = map(n, 0.0, 1025, 0.1, 10); sun(width/2, 0, scale); owl(width/2.0, height -10, int(random(50, 120)), scale); } } void sun(int x, int y, float s){ fill(255,255,0); noStroke(); for (float i = 0; i < PI; i+= 0.125 * PI){ arc(x, y, scale* width, scale * width, i + adder, i + PI / 16 + adder); } fill(255, 255 - map(scale, 0.1,10,0,255), 0); stroke(255,0,0); strokeWeight(10); circle(x, y, 400); }; void owl(float x, float y, int g, float s) { pushMatrix(); translate(x, y); scale(s); // Set the size stroke(138-g, 138-g, 125-g); // Set the colorvalue strokeWeight(70);line(0, -35, 0, -65); // Body noStroke(); fill(255); ellipse(-17.5, -65, 35, 35); // Left eye dome ellipse(17.5, -65, 35, 35); // Right eye dome arc(0, -65, 70, 70, 0, PI); // Chin fill(51, 51, 30); ellipse(-14, -65, 8, 8); // Left eye ellipse(14, -65, 8, 8); // Right eye quad(0, -58, 4, -51, 0, -44, -4, -51); // Beak strokeWeight(1); popMatrix(); } void serialEvent(Serial p) { inString= myPort.readString(); } void keyPressed() { if (key == 'q'){ exit(); } } void mousePressed() { adder = (adder + 0.125) % 0.25; }
0 notes
Text
I found the lesson about ethics around physical computing super interesting- we watched this talk about algorithmic bias and coded racism in which Buolamwini stressed how the problematic data sets are a direct result of ignorance and lack of care of the people creating them, how considerations about bias, fairness and effect must be considered throughout a design process, cannot be an after thought.
Within my own work I would like to learn about and feel more connection to the implications of my work,like where/how my components and software were made, and what effect my work will have on the world, or hypothetically could have if scaled. I want to learn to make work that could be useful/impactful rather than just aestetically interesting, and also how to do collaborative creative work with a team.
0 notes
Text
mary had a little lamb on button piano! (with chromatic CDEFG)
This would be really fun to build a case for... maybe I could combine the button piano with a row of coloured lights for each note? A simple and interactive color coded paino?

int but1 = 2; int but2 = 3; int but3 = 4; int but4 = 5; int but5 = 6; int buzzer = 13; void setup() { pinMode(but1,INPUT); pinMode(but2,INPUT); pinMode(but3,INPUT); pinMode(but4,INPUT); pinMode(but5,INPUT); pinMode(buzzer,OUTPUT); } void loop() { int b1 = digitalRead(but1); int b2 = digitalRead(but2); int b3 = digitalRead(but3); int b4 = digitalRead(but4); int b5 = digitalRead(but5); if( b1 == 1 ){ tone(buzzer,262,100); } if( b2 == 1 ){ tone(buzzer,294,100); } if( b3 == 1 ){ tone(buzzer,330,100); } if( b4 == 1 ){ tone(buzzer,349,100); } if( b5 == 1 ){ tone(buzzer,392,100); } delay(10); }
this code allows for multimple buttons to be pressed at once... and it doesnt sound good. so i would like to look into how to make chords better, or i guess only allow one note to be played at once.
0 notes