Don't wanna be here? Send us removal request.
Statistics
We looked inside some of the posts by sciwriteblog-blog and here's what we found interesting.
Average Info
Notes Per Post
3
Likes Per Post
2
Reblog Per Post
0
Reply Per Post
1
Time Between Posts
2 months
Number of Posts By Type
Text
17
Last Seen Tumblr Blogs


Fun Fact
The most popular pages on Tumblr are about Minecraft, GIFs, and David J. Peterson.
Text
The Puzzle of Greater Male Variance
Abstract
Abstract
Greater male variability on tests of mental ability would explain why males predominate not only at the highest levels in mathematics and science, but in business, politics, and nearly all aspects of life. The literature on sex differences in mental test scores was reviewed to determine whether males in fact exhibit greater variability. Two methods were used to compare sex differences in variability, ratios of total test score variances and ratios of the number of males and females scoring at or above extreme score cutoffs, or “tail ratios”. Most samples were greater than 10K. The review also included studies of physical traits such as height, weight, and blood parameters; brain volume measures; and studies of variability in four taxa, mammals, birds, insects, and butterflies. In the vast majority of total test score ratios, males were more variable than females. Males were more likely to score in the extreme right tail, indicating higher aptitude, on tests of mathematics and spatial ability in which mean sex differences favor males. On tests of writing, vocabulary, and spelling, in which mean differences favor females, males were more extreme in the left tail, indicating lower ability. Males also exhibited greater variance in physical traits, blood parameters, and brain volume measures. Similar variance differences were also found in animals. Genetic theory proposes that greater variability depends on which sex is heterogametic, that is, has two different sex chromosomes. In mammals and insects, this is the male sex, with the XY sex chromosome pair. In birds and butterflies, this is the female sex, with the WZ sex chromosome pair. It is heterogamety and not sex that determines which sex is more variable. This is because in the heterogametic sex, recessives on the single X or Z chromosome are fully expressed generating a binomial distribution with higher trait variance, while in the homogametic sex, recessive traits are averaged generating a normal distribution with lower trait variance. Females have improved their performance on mathematics tests for the gifted, with ratios falling from 13:1 favoring males in 1980 to 3:1 favoring males from 1990 onward, but the improvement has stopped. Heterogamety predicts that females, because they are homogametic, will never equal males not only in the right extreme of mathematics ability and other ability distributions but in the distribution of any trait influenced by the X chromosome.
In 2007, Psychological Science in the Public Interest published an issue devoted to sex differences in science and mathematics written by a group of contributors from fields such as neuroscience, gifted-studies, cognitive development, cognitive gender differences, and evolutionary psychology (Halpern, Benbow, Geary, Gur, Hyde, & Gernsbacher). Each author reviewed material from their specialty relating to the problem of female under-representation in mathematics- and science-based fields in academia, research, and industry. The group concluded that observed sex differences result from both genetic influences and sociocultural differences in the treatment of males and females, most certainly an anodyne conclusion of the kind expected from a committee of disparate experts.
The 2007 article was in part a response to the controversy following statements made two years earlier by then Harvard University president Lawrence Summers to the effect that there were fewer women in academia and industry because fewer women score at the highest levels on tests of aptitude predicting success in mathematics and the hard sciences. This was tantamount to saying that, at the highest ability levels, women are inferior to men. Summers’ statement about women was a major factor in his 2006 resignation as Harvard’s president. Regardless of campus politics, which also played a large role in his departure, the question remains, why do men dominate at the highest levels of mathematics, science, business, and industry?
Last year, the issue of sex differences arose again, this time in the citadels of technology, in particular the Silicon Valley offices of Google and the claim by one software engineer, James Damore (2017), that, among other things, ���differences in distributions of traits between men and women may in part explain why we don't have 50% representation of women in tech and leadership.” This was Summers’ explanation exactly, and for offering it, Damore experienced a fate similar to Summers’: He was fired.
The topic of cognitive gender differences being much too broad for any one article, this paper considers only the issue of greater male variance on mental ability tests. This review updates the 2007 Public Interest article now that more than 10 years have passed and considers new findings, which include much larger samples of test data than were then available, and recent research published by geneticists and behavior geneticists shedding new light on this controversy.
The approach I’ve taken in this review was dictated by the issue under study, the variance of mental ability as reported in a wide range of aptitude and achievement tests of children and adolescents. While it might seem preferable to perform a meta analysis of many study results, the variance statistic does not lend itself to this approach. Pooling effect sizes from different samples can give a better estimate of true population mean difference than individual studies. But it is difficult to know what group is represented in the result when a meta-analysis is performed on heterogeneous variances. Studies of variance should be based on large nationally representative samples, not heterogeneous studies of selected groups, some based on selected samples, thrown together and christened a meta-analysis leaving the reader with the question, “What is the population the parameter of which is being described?” For a brief yet astute discussion of the perils of using meta-analysis to study sex differences in variance, see Hedges and Nowell (1995) Pages 41-42.
If meta-analysis is inappropriate, what other approach can one take? In the studies reviewed here, a wide variety of tests were given to children ranging in age from early childhood through late adolescence. I have chosen to review the 17 studies individually, presenting reported sex differences in means, variances, and tail ratios in separate tables for each study. After reviewing each study, I discuss its merits, for example, Did the study assess aptitude or achievement? Did subject age affect the results? What patterns exist across tests of domains such as verbal, mathematical, spatial, and science aptitude; change in variances over time, etc?
None of the data in the studies reviewed here were generated by the researchers for the purpose of comparing male and female variance, nor could it be, the sample sizes required are too large. In every instance, tests were given to meet an institutional requirement such as college entrance or by a government agency assessing student progress or teacher/school effectiveness. The sample sizes were large, some having tested or screened millions of students randomly sampled from large countries such as the U.S. and UK, and in one case, the PISA test of 276,165 15-year-old students from 41 developed and developing nations. The results were data sets that largely spoke for themselves with little data manipulation needed. In most cases, I have reproduced the key tables from each study to enable inspection of the supporting evidence for the issue under review.
Requirements to Show Sex Differences in Variability
Sources of Differences in the Right Tail of Distributions
Of interest here is the difference in the frequency of extreme scores in the tails of test-score distributions. More males will be found in the extreme right of a distribution if males have a higher mean and both sexes have the same variance, or if both sexes have the same mean but males have a greater variance, or if males have both a higher mean and greater variance. No studies with the exception of Nowell and Hedges (1998) using a method developed by Lewis and Willingham (1995) attempt to partition the relative frequencies of extreme scores into components due to mean differences and variance differences.
Measures of Sex Differences
Virtually all of the reviewed studies of sex differences report the mean sex difference and the total test score variance ratio or VR. They also report “tail ratios,” a proportion comparing the number of males and females scoring above a given cut off in the extremes of distributions.
Means are universally compared using Cohen’s d (1988), the mean difference standardized by the pooled within-groups standard deviation:
(MeanM – MeanF)/√(VarM + VarF)
Cohen’s (1988) criteria for assessing the importance of d are .20, small; .50, medium; and .80, large. In most of the studies reviewed below, d was calculated as male mean – female mean. In those few studies were it was calculated female mean – male mean, I reversed the sign and so noted in the footnotes to the tables where I did this.
The standard deviation is the most commonly used measure of test-score dispersion, but its square, the variance, is a better measure of variability because its ratio can be used to compare the variability of different groups. To do this for males and females, the simple ratio of male over female variance is computed:
VarM/VarF.
A ratio of 1.0 indicates equal male and female variances. Ratios larger (smaller) than 1.0 indicate greater (lesser) male variance. Feingold (1992) suggested that a difference of 10 percent in the variance, or a variance ratio of 1.10, is the minimal required for the difference to have substantive importance. In all of the studies, the variance ratios were calculated as male variance/female variance.
Tail ratios are a simple means of comparing performance at the extremes of test score distributions. The counts of males and females within the 10%, 5%, and .01% cutoffs provides the ratio of males and females performing at or above that level:
CountM/CountF.
Much like VR, a tail ratio of 1.0 indicates that the number of males and females scoring above a given cut off is equal. Ratios larger (smaller) than 1.0 indicate more (fewer) males scored at or above the cut off. An increase in tail ratios with successively higher cut offs indicates that a greater disproportion of males is scoring at higher levels and thus possesses to a greater degree whatever latent trait the test measures. In all of the studies, the count ratios were calculated as male variance/female variance.
Some studies look only at the right tail of the distribution. Samples selected for high scorers will reduce the variance by truncating the left side of the distribution. For these studies, is it not useful to estimate the population variance but rather to compare the counts of males and females scoring at or above a given cut off score, that is, tail ratios. Lewis and Willingham (1995) found that the mean sex difference in restricted samples was correlated with the variance difference.
Volunteers are known to differ from the general population. Children who volunteer for enrichment programs, or whose parents do the volunteering, are likely to be more motivated and different from a nation-wide sample of non-volunteer same-age children in intelligence, motivation, SES, race-ethnicity, etc.
Factors Affecting Variance Differences
Age. Haworth, Wright, Luciano, Martin, de Geus, van Beijsterveldt, & Plomin (2014). found that the heritability of general intelligence increases with age, from .41 to .55 to .66 at ages 9, 11, and 17 respectively, in a study that pooled 10,689 MZ and DZ twin pairs from six studies done in four countries. Others have suggested that heritability is as high as .80 in late adulthood (Johnson, Carothers, & Deary, 2009; Plomin & Deary, 2015). At the very least, tests should be of young adults although there is no large-scale testing of persons older than those taking graduate school admissions tests like the GRE.
Range Restriction. Because we are interested in the relative number of males and females scoring in the tails of the test distribution, there should be no ceiling or floor effects. An ideal test would have few or no zero or perfect scores to assure that the difficulty of the test matched the ability of the test takers.
Unselected Samples. Ideally, samples should be unselected to ensure that the full distribution of ability within a population is tested. This can be achieved with a procedure such as national probability sampling, which is the best means to obtain a truly representative sample of the nation as a whole. There are large samples of selected populations such as the SAT and GRE, tests used to screen students for college and graduate school. But these samples are neither random nor representative despite samples numbering in the millions.
Aptitude Versus Achievement Tests. Aptitude tests measure student ability and achievement tests measure student learning and school effectiveness. It is better to study tests of aptitude rather than achievement if we are studying ability although it is impossible to study any ability divorced from previous learning experience. Unfortunately, there are few large-scale studies of “culture-free” tests of intelligence, such as the Raven Progressive Matrices. Societies economically developed enough to do large-scale testing also have compulsory schooling usually through the American equivalent of high school. Large-scale testing is done with school children and adolescents to monitor their progress and to screen for college and graduate school admissions. An example of using large-scale testing over a range of ages is the No Child Left Behind program, which required regular testing of elementary and high school children to determine whether they were achieving specific learning goals and whether teachers were performing up to standard (Zelizer, 2015). Some schools whose students failed to progress adequately were closed. The diversion of classroom time and school resources away from instruction to prepare students for these achievement tests has been a source of parental complaints (Strauss, 2015). To the extent that test preparation becomes “teaching to the test,” sex differences in the means and variances will be reduced.
Genetic theory
This paper will show that the sex difference in variance is due to the difference in their chromosome allotment, namely the difference in the sex chromosomes, XX for females and XY for males. There is no difference between males and females with regard to the 22 pairs of somatic chromosomes, the autosomes. Both males and females have the same chromosomes and the same coding regions and alleles on all 22 pairs of autosomes. The random process by which they are assigned those alleles is the same for both sexes. But with the sex chromosomes, X and Y, the genetic allotment is different. Because the Y chromosome that men receive is vestigial, it leaves the X chromosome unpaired so that not only are dominant alleles fully expressed, recessive alleles are also fully expressed. In females, the pairing of two X-chromosomes means that recessive traits are expressed only if there are recessive alleles on both X chromosomes, which reduces the probability that the recessive trait is expressed to the square of the probability for males, one source of lower female variability.
Johnson et al. (2009) demonstrated how this works in a simple model of a single gene with two alleles on the male single X chromosome,
A and a,
that will have the maximum population variance of
0.5 x 0.5 = 0.25
when the allele frequencies are equal. For both the dominant and recessive alleles, their probability of expression is equal to their proportion in the genome.
Matters are different for females, who have three genotypes arising from the same two alleles because the two alleles, A and a, are on one of two different chromosomes, XX,
AA = 0.25, Aa = 0.50, and aa = 0.25.
In a perfect world, this would lead to reduced variance in females because the phenotypic expression of AA and Aa are the same when there is complete dominance and thus a lower population variance of
(0.25 + 0.50) x (1.0 - 0.75)
0.75 x 0.25 = 0.188.
But the fact that females have two X chromosomes while males have one complicates matters. This is an imbalance that nature corrects by silencing or “inactivating” one of the two female X chromosomes. Which X chromosome is silenced is randomly determined early in gestation when the embryo is between 8 and 16 cells (Craig et al., 2009). Half of these cells will have chromosome X1 with allele A and half will have chromosome X2 with allele a. This equal splitting of the two X chromosomes and their different alleles will lead to phenotypic expression that is the average of allele A and a. Because half the females have the heterozygous genotype Aa, and one-quarter each have the homozygous AA and aa genotypes, their distribution is more approximately normal and has a smaller variance than the binomial distribution of A and a in males. In short, this is the source of greater male variance and is discussed in greater detail below.
Published Studies
The following studies present in some detail what I think is the most comprehensive review extant of the literature bearing on the issue of male and female variance in mental ability testing. The studies reviewed unmistakably make the case that 1) males are more variable with regard to virtually all tests of mathematical, spatial, and science aptitude and achievement at both the high and low ends of the respective test score distributions and 2) many tests of verbal aptitude and achievement especially at the low end of the test score distributions.
Benbow and Stanley (1980, 1983)
The issue of differential variance was given it’s current prominence by Benbow and Stanley who reported in two papers (1980 and 1983) on sex differences in mathematics based on large samples of mostly 7th grade children who were given both the verbal and mathematics sections of the Scholastic Aptitude Test as part of the Study of Mathematically Precious Youth (SMPY).
The SAT-Mathematics test (SAT-M) is normally taken by college-bound high school seniors, who at age 17 or 18, are 5 to 6 years older than the SMPY 7th graders, all of whom were age 12 except for a small number of 13 year olds in the early years of the study. Few of the SMPY children had taken algebra or had any formal training in the skills needed for the SAT-M. Benbow and Stanley (1980) gave the SAT-M not to test mathematical aptitude, but because the test was so far above the skill level of 7th graders that the SAT-M would be a test of their “numerical judgment, relational thinking, and logical reasoning.” Spearman (1904) would recognize the ability Benbow and Stanley were testing as general intelligence or g.
The 1980 report was based on the scores of 9,927 students who were recruited from the greater Baltimore region between 1972 and 1979 after scoring in the top 2 to 5 percent on a mathematics screening test. Tables 1 and 2 show the results for both the verbal and mathematics scores. Removing the 8th grade scores for December 1976 because of the small N, the mean d value of -.03 for the verbal scores shows that males and females were about equal in verbal reasoning and the mean variance ratio of 1.04 also suggests parity in variability. But the mean d value of .50 and the mean variance ratio of 1.58 for mathematics scores shows that males score a half standard deviation higher and were nearly 60 percent more variable than the females. The extreme mathematics scores were even more disparate, 16.6% of the males scoring above 600 but only 2.1% of the females.
In 1983, Benbow and Stanley reported results on the SAT-M from nearly 40,000 students in the mid-Atlantic region and another large group from a nationwide talent search within and beyond the Johns Hopkin’s talent search area. All students were under age 13. The results were similar to those from the earlier study. No difference was found in the SAT-Verbal, with the male and female means 367 and 365 respectively (Standard deviations not reported). But there was a 30-point mean difference on the SAT-Mathematics, with the male and female means 416 and 386 respectively. The variance ratio was 1.38, roughly the same as in 1980 and showing again that males are more variable than females. More importantly as shown in Table 3, the number of boys scoring above 700 on the SAT-M over both national search samples, was 13 times the number of girls (260:20), despite equal numbers of boys and girls taking the screening test.
Comment. Benbow and Stanley’s findings gave enormous impetus to research on sex differences in cognitive ability generally and to sex differences in variability specifically.
The extreme 13 to 1 ratio has become ingrained in the literature on sex differences in variability even though it has been out of date since 1990, the ratio now being 2.8:1, or in round numbers 3:1. Use of the SAT allowed Benbow and Stanley to avoid ceiling effects: Few students scored above 700, and in many years, no one scored a perfect 800. Their samples were young and highly selected, making it possible to generalize only to the very brightest students rather than to the population of seventh graders as a whole. The students were volunteers, a special group that probably differs in many ways from students in general although it is unlikely that these factors substantially affected the differential pattern of scoring. Comparing means and total score variances between two groups all of whom are in the right tail of the score distribution is questionable.
Benbow and Stanley (1980, 1983) were among the earliest to note that the traditional arguments made to explain the lower numbers of extremely able females in mathematics, such as lack of opportunity to study math and social attitudes discouraging females from pursuing careers in math and science, would create mean differences between the sexes not variance differences. Benbow and Stanley also noted that through 11th grade, boys and girls have taken the same math courses, obtain about the same grades, and rate similarly their liking for mathematics and their perception of mathematics as important. Summarizing their assessment of theories explaining male superiority at the highest score levels in their 1980 report, Benbow and Stanley stated that “boy-versus-girl socialization” as the only acceptable explanation of the sex difference is “premature,” and in 1983, said that the reasons boys “dominate the highest ranges of mathematical reasoning ability were unclear.”
1 note
·
View note
Text
More Ideas on Population and Immigration
If there is one thing that would bring population back into the national debate over immigration it is challenging the media’s near refusal to connect the two. Only rarely does one see the implications for population mentioned in articles about immigration. This is also true of environmental reporting in general as was first discussed by T. Michael Maher more than four decades ago. Talk of population is forbidden in the media unless it’s someone else’s population, like China’s or India’s. Paul Ehrlich’s now classic 1968 book, The Population Bomb, sold 2 million copies and changed not only popular attitudes about population as an environmental issue, but made population a key issue in the media as well. In 1969, Richard Nixon devoted an Oval Office speech to population and appointed the Rockefeller Commission on Population Growth. We need to rekindle the national consensus on reducing population growth created by Ehrlich’s book and apply it to immigration.
One reason The Population Bomb created such a stir is that it came at a time of widespread public questioning of entrenched policies and of anti-establishment skepticism created by the Vietnam war. The social and political movements of the 60s led to the first Earth Day and the modern environmental movement. For reasons discussed in Roy and Leon’s “retreat from stabilization” article, population is no longer the signal environmental issue it was 50 years ago and is now taboo among many environmental organizations. Despite this, the key to reviving population as a domestic issue is access to the media. In an earlier message, I said that we needed something like the Worldwatch Institute. In fact, there already exists two similar institutions for immigration, the Center for Immigration Studies, and, of course, NumbersUSA. The closest existing organization for population is Progressives for Immigration Reform (PFIR). PFIR must raise its profile.
The following is an example of how that might be done:
Most Americans have no idea how much U.S. population will grow under different immigration scenarios. But the graph of population drivers pasted into Table 1 from the Census Bureau’s web site and the projections of future population growth pasted into Table 2 from the PFIR EIS report give a glimpse of an overpopulated future no one wants. There is a YouTube immigration channel in Canada. Can NUSA set up its own YouTube channel that shows the inevitable future mass immigration will impose? Such a “channel” would be the most cost effective way of getting the message out. NUSA could also use the channel to better publicize its work on sprawl and other issues. The audience is potentially much larger than on-line YouTube views of current material, which are short and may be attracting only the converted, that is, immigration activists who may be bumping up the view number with repeated viewing.
Table 1
Contributions of Fertility and Migration to Future U.S. Population

https://census.gov/library/visualizations/2018/comm/international-migration.html
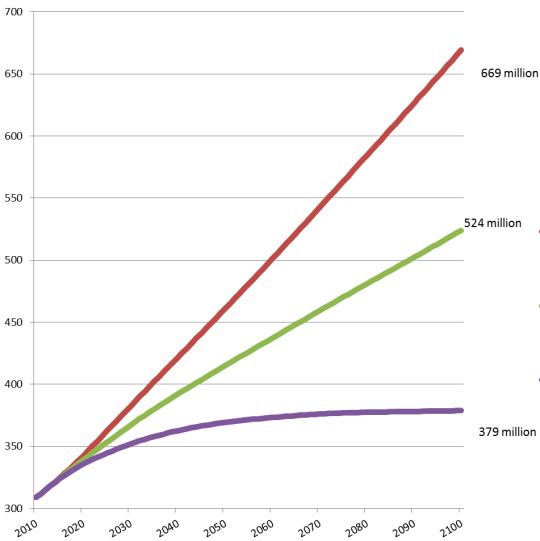
Table 2
Estimated U.S. Population Based on Three Immigration Scenarios: No Change (green), Reduction (purple), and Expansion (red)
file:///C:/data/immigration/LeonPFIRFina-immigrationEIS2016MayComplete2016.pdf
This Op-Ed by Hahrie Han appeared in the New York Times after the Las Vegas shooting last October. The author is a Political Science Professor at UC, Santa Barbara, who has also written a book, ”How Organizations Develop Activists: Civic Associations and Leadership in the 21st Century,” available at Amazon. Chapter 1 is online here.
In explaining why in the debate about gun control at the federal level, gun rights nearly always win over gun control, she notes that, “Gun-control groups focus on persuasion, while gun-rights groups focus on identity.” People join the NRA because gun ownership is a way of life. They find the passage of gun control measures personally threatening and like nothing better than defending gun rights. The NRA might be the original grass roots lobbying group. Much like NUSA, the NRA mails warnings to the rank and file of pending legislation on gun rights and provides post cards each member can mail to their elected officials. This has made the NRA a feared lobbying force on Capital Hill with a proven record of unseating congressmen who failed to toe the NRA’s party line. Han notes that 80,000 NRA members from all over the country attended its annual meeting in 2017. How many would attend a similar meeting held by NUSA? Han also notes that she joined a gun-control group and sent emails and made calls until, feeling like “a prop” in someone else’s game, she quit. Over a number of years starting in 1997, I sent hundreds of faxes, and made thousands of calls, as many as 50 in a day. But I also quit recently because there was little satisfaction in being one of the “lone wolves” Han describes in her Chapter 1, although other matters were also more pressing.
It might be worthwhile for NUSA to hold a national or regional meeting, just to see what emerges from it. A meeting would bring people together and build friendships around immigration reform, and might, as Han describes in her Chapter 1, engender a greater sense of commitment among activists. Another possibility is to create “organizers” in Han’s sense by making one NUSA member a “leader” in an area who contacts others to make sure they send faxes in a timely fashion. The leader could hold meetings to generate a sense of shared mission. We need to remind people that if mass immigration isn’t stopped, there will be no place to take a vacation from overpopulation, including their favorite Montana fishing spot. My guess is that this would be too expensive and would require organizational structure beyond NUSA’s resources. Despite this, the thought experiment might still be worthwhile.
Here is what Han says about which groups are effective and which not:
“When I studied groups that were most effective at building a grass-roots base, I found that the key factor to success was the nature of the relationships they created. The most effective groups used relationships as a vehicle for bringing people off the sidelines of public life and teaching them to speak truth to power. You can’t convince someone to rethink who they are or what responsibility they want to take for their community through a mailer.”
“Building a movement will require organizations to invest in the leadership of ordinary people by equipping them with the motivations, skills and autonomy they need to act. Most organizations never give people that opportunityIn her Chapter 1, Han mentions on-line video conferencing as a means of organizing. You might want to keep your eyes peeled for this as a way of having virtual meetings that might serve as an cheap, convenient organizing tool.
In her Chapter 1, Han mentions on-line video conferencing as a means of organizing. You might want to keep your eyes peeled for this as a way of having virtual meetings that might serve as an cheap, convenient organizing tool.
Start an immigration “truth squad.” Call out James Fallows whose cheery self-righteous comments about African immigrants in Nebraska meat processing plants left out any mention of how jobs that were once well-paying and unionized are now reminiscent of Upton Sinclair’s Jungle, which was written in an era of mass immigration much like ours. I may be cherry picking this one comment, which I mentioned in an earlier letter, but someone needs to correct writers who believe that mass immigration has no consequences. The Times columnists, David Brooks and Brett Stephens, are singularly oblivious in this regard.
Another whooper was by John Kerry, who commented before he ran for President that, “America is underpopulated.” And this by the co-author of This Moment on Earth: Today’s New Environmentalists and Their Vision for the Future. The book is about the activists Kerry met during his 2004 presidential campaign. Apparently, it never occurred to Kerry that blowing up this country’s population would undo all the efforts of his “new environmentalists.” Someone needs to clarify this for him.
A third example is from Senator Lindsey Graham, who recently said, “We can’t reduce immigration because we need economic growth.” If continual population growth is required to have a “good” economy, then population will have to grow indefinitely. This is one of the fundamental flaws in the triumvirate globalist policy espoused by Republicans like Paul Ryan and free traders like the Koch brothers: Tax cuts, free trade in goods and services, and free flow of labor. This juggernaut is what dominates thinking in the U.S. Senate and makes NUSA’s job impossible. Note that immigration was not slowed at all during the Great Recession, even with 10 percent unemployment.
One particular group that might be a source of recruits for the immigration wars is local growth controllers. After looking at web sites and exchanging emails, I’ve learned that the leadership of groups like American Farmland Trust and Sprawl City don’t want to be seen as blaming immigrants for sprawl. But some rank-and-file members might feel differently.
I wouldn’t make too much of the most recent Pew poll on attitudes toward immigration. Even though it was largely done before the “zero tolerance” policy made headlines, which might have created a “social desirability” effect (telling the interviewer what the respondent thinks the interview wants to hear), the poll shows public attitudes on immigration softening. But the real story is how ignorant the public remains about basic aspects of immigration. Some 35 percent of respondents believe most immigrants are here illegally. This means that a third of the public does not understand the distinction between legal and illegal immigration, the most basic distinction of all.
In his book, Huddled Masses Muddled Laws, Kenneth Lee describes how in 1996, pro-immigration lawmakers made use of this confusion to essentially hoodwink the public into settling for a weak bill on illegal immigration while leaving legal immigration untouched. The book is relatively short and should be required reading for all population activists. Our job is to educate the public on immigration basics (that YouTube channel?) and how the status quo is unsustainable.
I hope there is at least one good idea here. It’s ironic that one immigrant “sob story” gets more space in the New York Times than even a mention of projected population growth and all it entails.
Sincerely,
Fred W. Johnson
0 notes
Text
Reconsidered response to Rob Harding’s Post
I’ve reconsidered after sending a first dispirited email that said it was hopeless attempting to counter the political correctness of environmental group leaders. Here are some ideas:
The best strategy to counter political correctness is to develop an alternative narrative and deny the ideologists political space. There is an implicit ethnocentrism in statements like this one from one of your environmental group “leaders” who refers to U.S. citizens as “…those lucky few of us already on the inside of the right borders.” The arrogance of this statement is breathtaking. It says that the U.S. is the only country on the planet worth living in and one cannot have a good life outside its borders. This is not unlike Donald Trump’s “s---hole” statement about African countries. In fact, most people are proud of their country of origin, just like Americans are of theirs. Living in Berkeley CA, I’ve known many immigrants and none trashed their country of origin like this.
In your interviews, did you ask any of these leaders their number? That is, their estimate of the largest possible sustainable U.S. population. One leader said, “We do not oppose migration of people into the United States and do not support coercive population control measures of any kind. Immigration and the pursuit of better circumstances are basic human rights, and U.S. immigration policies should always be rooted in human dignity.” If this is what they believe, these leaders are not for population stabilization at all. I get the impression that they are for unlimited U.S. population growth so long as all the growth is from the Third World poor. That’s a nice sentiment, but totally impractical and has nothing to do with stabilizing U.S. population. If we are to import huge numbers of the world’s poor and maintain a stable population, this statement amounts to telling U.S. citizens that they should stop having children in order to make room for millions of the foreign-born poor.
If these groups are not population organizations, what is the purpose of their group, population substitution? Out with U.S. citizens, in with the world’s poor? Has even one of these ivory tower population “leaders” tried out such ideas on the American public? Have they asked the average American if they agree that they should, in effect, have their tubes tied to make more room for the foreign-born poor? Have they polled Trump voters? As the Democrats are learning at the presidential level, a new policy has to pass the “Joe Sixpack test.” If it doesn’t, it might play well with ideological college kids, but it won’t win elections.
James Fallows and his wife are on tour selling their new book, “Our Towns,” telling Commonwealth Club members and NPR listeners that Somali immigrants and refugees working in Nebraska’s slaughterhouses are a wonderful example of immigration working for all concerned. Did Fallows take a look inside those slaughterhouses to see what’s really going on? Those jobs used to be in the industrial north, in cities like Chicago, and paid a good union wage with overtime and benefits. Unfortunately for these Somalis, their American Dream is the globalized American sweatshop: dangerous working conditions, no overtime or medical benefits, long shifts, and rock-bottom wages to supply China, the ownership’s home country, with cheap, imported American pork. The existence of a new American slavery based on cheap immigrant labor needs to be publicized.
We need a research center like Lester Brown’s Worldwatch Institute. We could document the ongoing destruction of wildlands, wetlands, open space, and farmland (both prime and otherwise), and water in the west, just like Brown did in the “Vital Signs” books that had for each topic, a graph and text on facing pages clearly showing and discussing trends.
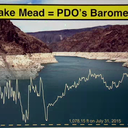
Water in the western U.S. is always a critical problem, made worse by climate change. Development and dwindling snow packs are at a critical juncture. Lake Mead behind Hoover dam is nearing deadpool, when the lake level falls below the intakes; Lake Powell behind Glenn Canyon dam has been near deadpool for years. Limiting further development in the American Southwest is already being talked about by writers like Kathleen Parker, Char Miller, and many others including immigration cheerleader Jerry Brown, who was governor of California during the recent multi-year drought. Nowhere in the U.S. are water resources being pushed to the limit as in the Southwest. A huge proportion of the Southwest’s population growth is from immigration, legal and otherwise. Groups like NUSA need to be at the table when steps are taken to allocate the Southwest’s most precious and scarce resource, water.
This animation of San Jose’s growth by Joel Clark, shows how San Jose expanded during the 50s and 60s under the go-go city manager, A.P. “Dutch” Hamann, the main force behind the conversion of the Santa Clara Valley, once known as the Valley of Heart’s Delight because of its fruit orchards, into Silicon Valley’s bedroom community, a tangle of freeways, houses, and shopping malls. Videos of this sort could be created for every city in the country. Something similar to the San Jose story may be in store for the Puget Sound lowlands stretching from Seattle, WA to Vancouver, BC, now being touted as a “Cascadia innovation corridor.” To cash in, developers use targeted campaign contributions to pack county supervisory boards with Republican toadies; ditto for house members and senators. Farmers don’t have a chance; they’re easily bought out or taxed off their land; high tech has greater value added. If that corridor can be built, what is to prevent a similar fate for the entire Willamette Valley in Oregon, and the what remains of the Central Valley in California? This would be a disaster for the entire country, but it’s well on its way to happening.
Maps like Clark’s can be made that show the INCREASE of: urbanization, sprawl, roadways, pipelines, and power lines overlayed to show how much of the U.S. has been “developed;” nearly all of it. By the same token, maps can be made that show the DECREASE of: farmland (prime and otherwise), open space, wildlife habitat, free flowing rivers (if any are left), and wilderness. A three-dimensional mesh plot with density contours, which can be programmed in R, would show how development has already swallowed most of the country.
Leon Kolankiewicz, Anne Manetas, Roy and possibly others have written long detailed reports on what population growth and sprawl have done to Florida, California, and the entire U.S. Some of these are outdated but are still relevant as records of what has been done irreversibly, and begs the question, “When will this stop?” These studies may be on the web right now, but should be given much greater publicity along with computer graphics to make their point more visually. In the late 1990s, NUSA gave me copies of several sprawl studies, but in my case it was preaching to the choir. These studies should be updated and broadcast more widely.
To explain the origin of the terms “chain immigration” and “diversity lottery,” educate voters about the Jordan’s commission’s 1996 report. Papers like the New York Times editorialized against these proposals, but never made clear where these terms came from or who first proposed them. It would have been harder for the mainstream press to toss aside these measures if the public knew that the rationale for ending chain migration and the lottery came from Barbara Jordan more than 20 years ago. The NUSA chain migration TV ad is great, but there needs to be more public education to provide context.
Studies have shown that as societies increase in size, participation in civic life declines and people feel excluded from political life. Only nations like Ireland and the Scandinavian countries are still small enough so that there is greater participation and a sense of civic engagement. The larger the population, the less people feel that voting matters: “Why bother to vote, I’m only one person?” How would these “leaders” answer this question?
We should offer an alternative vision for America that builds around E. O. Wilson’s idea of devoting half the planet to wildlife habitat. Note that both Lester Brown and Wilson, were lobbied by the Sierra Club board of directors during the 1998 vote on immigration. Both turned down the board and voted against its proposal and in favor of reducing immigration.
All of this requires money. To do just the mapping studies would require probably three people, a coder, a writer and a data manager. I have few ideas on funding, except that the Colcom Foundation is one possible source. A second possibility is crowd sourcing. Where is the George Soros for population?
Political correctness will win only if we allow it to. Most Americans are pragmatic, reject ideologies, and agree that population is a problem here and around the world. Knowing that, we can define this issue in our terms and not those of the left-wing ideologues.
Fred W. Johnson
0 notes
Text
The two posts above, “Reconsidered” and “More ideas,” were written in response to this email sent to me by Rob Harding at NumbersUSA. Sustainabiilty Watch July 8, 2018
For 9 months, I've had scores of conversations with environmental leaders and thinkers about immigration's impact on the U.S. population and environment.
Here is what I heard.
"I hope the Trump administration is successful at reducing future immigration flows because such incessant population growth is inhibiting our ability to conserve other species' habitats. But I won't share this view publicly in today's polarized political climate."-- a university editor of an environmental newsletter
I'm all in on population control in the US, have a bookshelf full of [population-environment] books here at home, and I've never lost sight of the firm connection between population growth and habitat loss and global warming. But it has been increasingly challenging to come out for immigration reductions as the number of right-wing racist crazies has increased." -- a leader in a national conservation group
WHY AREN'T ENVIRONMENTAL LEADERS SPEAKING FOR U.S. STABILIZATION?
As we approach the 50th anniversary of Earth Day (in 2020), I've wanted to know why I'm not seeing much leadership from environmental groups, leaders and writers in supporting limits to immigration that would allow the U.S. population to stabilize in this century.
After all, the founder of Earth Day - Sen. Gaylord Nelson - (D-Wis.) was clear about the responsibility of environmentalists to address these issues.
"The bigger the population gets, the more serious the problems become... We have to address the population issue. The United Nations, with the U.S. supporting it, took the position in Cairo in 1994 that every country was responsible for stabilizing its own population. It can be done. But in this country, it's phony to say 'I'm for the environment but not for limiting immigration.'" -- Gaylord Nelson, 2001 interview with the Milwaukee Journal Sentinel
I've spent these last nine months in conversations with fellow environmentalists across several disciplines who understand our current state of global ecological overshoot and its axiomatic connection to the size and growth of human populations.
While most of the people I spoke with recognize immigration's role in driving continued U.S. population growth and acknowledge that such growth undermines U.S. ecological sustainability, many of the same people refuse to publicly support limiting immigration as a necessary component of any plan to achieve U.S. population stabilization.
The quotes below are representative of most of the answers I got over these months of searching.
The people with whom I spoke knew I was with NumbersUSA. But I do not use their names or identify their organizations because I wish to shine a light on the overall thinking behind the overwhelming silence of so many, rather than criticize specific individuals (and their organizations) who were kind enough to talk candidly with me.
"We are practically on the same page except for migration. I believe that, in the short term, in order to avoid a major humanitarian calamity, the global North must be more receptive to migration from the global South, albeit with proper filters for troublemakers." -- an editor of an environmental journal
"On the immigration issue, if climate scientistsare anywhere close to correct, the world may live to see huge movements of people this century. Compassion is the only appropriate response to such potential massive suffering, not laws to shut people out or pretend it is someone else's problem. I believe it is of paramount importance that we, environmentalists, steer fully clear of past mistakes of population controls and, relatedly, get a big chunk of the social justice contingent on our side. We should try to avoid recycling any past acrimonies and misunderstandings."-- a Southeast university author
". . . unsustainable human population numbers, overconsumption, and damaging resource extraction and production techniques are critical factors in the planetary extinction crisis, climate change and ocean acidification. However, because population, consumption and extraction/production are global issues that transcend national borders, we do not view national immigration policy as the appropriate target for addressing these issues.
"We do not oppose migration of people into the United States and do not support coercive population control measures of any kind. Immigration and the pursuit of better circumstances are basic human rights, and U.S. immigration policies should always be rooted in human dignity. While there is room for debate over the best methods to manage immigration, we do not view it as the way to address population growth, over-consumption, urban sprawl, unsustainable growth, and the effects they have on wildlife and the wild places they need to survive and thrive." -- a leader in a national ecology group
"[T]he idea that we should limit immigrationinto the US in order to combat this problem that we are contributing so extensively to worries me quite a bit. It feels like shutting the doors to protect our privilege, after we've done so much to make the world unlivable for some of the people trying to get in.
"[O]ne of the reasons we need to reduce fertility so aggressively in the developed (overdeveloped) world is so that we have room to do what justice demands, which is to let in refugees and those looking to improve their lot by taking advantage of our sunk carbon costs (infrastructure). This makes me unpopular with important allies, I know, as many overpopulation advocates are worried about immigration into high-consuming countries; but I think we get to work to correct one injustice through another injustice (one which, it so happens, protects those lucky few of us already on the inside of the right borders)." -- a Northeast university author
Jul. 5
th
, 2018
SUSTAINABILITY WATCH
For 9 months, I've had scores of conversations with environmental leaders and thinkers about immigration's impact on the U.S. population and environment.
Here is what I heard.
"I hope the Trump administration is successful at reducing future immigration flows because such incessant population growth is inhibiting our ability to conserve other species' habitats. But I won't share this view publicly in today's polarized political climate."-- a university editor of an environmental newsletter
WHY AREN'T ENVIRONMENTAL LEADERS SPEAKING FOR U.S. STABILIZATION? MORE QUOTES
I'm all in on population control in the US, have a bookshelf full of [population-environment] books here at home, and I've never lost sight of the firm connection between population growth and habitat loss and global warming. But it has been increasingly challenging to come out for immigration reductions as the number of right-wing racist crazies has increased." -- a leader in a national conservation group
As we approach the 50th anniversary of Earth Day (in 2020), I've wanted to know why I'm not seeing much leadership from environmental groups, leaders and writers in supporting limits to immigration that would allow the U.S. population to stabilize in this century.
After all, the founder of Earth Day - Sen. Gaylord Nelson - (D-Wis.) was clear about the responsibility of environmentalists to address these issues.
"The bigger the population gets, the more serious the problems become... We have to address the population issue. The United Nations, with the U.S. supporting it, took the position in Cairo in 1994 that every country was responsible for stabilizing its own population. It can be done. But in this country, it's phony to say 'I'm for the environment but not for limiting immigration.'" -- Gaylord Nelson, 2001 interview with the Milwaukee Journal Sentinel
I've spent these last nine months in conversations with fellow environmentalists across several disciplines who understand our current state of global ecological overshoot and its axiomatic connection to the size and growth of human populations.
While most of the people I spoke with recognize immigration's role in driving continued U.S. population growth and acknowledge that such growth undermines U.S. ecological sustainability, many of the same people refuse to publicly support limiting immigration as a necessary component of any plan to achieve U.S. population stabilization.
The quotes below are representative of most of the answers I got over these months of searching.
The people with whom I spoke knew I was with NumbersUSA. But I do not use their names or identify their organizations because I wish to shine a light on the overall thinking behind the overwhelming silence of so many, rather than criticize specific individuals (and their organizations) who were kind enough to talk candidly with me.
"We are practically on the same page except for migration. I believe that, in the short term, in order to avoid a major humanitarian calamity, the global North must be more receptive to migration from the global South, albeit with proper filters for troublemakers." -- an editor of an environmental journal
"On the immigration issue, if climate scientistsare anywhere close to correct, the world may live to see huge movements of people this century. Compassion is the only appropriate response to such potential massive suffering, not laws to shut people out or pretend it is someone else's problem. I believe it is of paramount importance that we, environmentalists, steer fully clear of past mistakes of population controls and, relatedly, get a big chunk of the social justice contingent on our side. We should try to avoid recycling any past acrimonies and misunderstandings."-- a Southeast university author
". . . unsustainable human population numbers, overconsumption, and damaging resource extraction and production techniques are critical factors in the planetary extinction crisis, climate change and ocean acidification. However, because population, consumption and extraction/production are global issues that transcend national borders, we do not view national immigration policy as the appropriate target for addressing these issues. "We do not oppose migration of people into the United States and do not support coercive population control measures of any kind. Immigration and the pursuit of better circumstances are basic human rights, and U.S. immigration policies should always be rooted in human dignity. While there is room for debate over the best methods to manage immigration, we do not view it as the way to address population growth, over-consumption, urban sprawl, unsustainable growth, and the effects they have on wildlife and the wild places they need to survive and thrive." -- a leader in a national ecology group
"[T]he idea that we should limit immigrationinto the US in order to combat this problem that we are contributing so extensively to worries me quite a bit. It feels like shutting the doors to protect our privilege, after we've done so much to make the world unlivable for some of the people trying to get in. "[O]ne of the reasons we need to reduce fertility so aggressively in the developed (overdeveloped) world is so that we have room to do what justice demands, which is to let in refugees and those looking to improve their lot by taking advantage of our sunk carbon costs (infrastructure). This makes me unpopular with important allies, I know, as many overpopulation advocates are worried about immigration into high-consuming countries; but I think we get to work to correct one injustice through another injustice (one which, it so happens, protects those lucky few of us already on the inside of the right borders)." -- a Northeast university author
More Quotes
"Is it in [anyone's] interest to have a total societal collapse? No. If we want to prevent that we need to make some hard choices. Reduced immigration is important, but so is having fewer children." -- a leader in an environmental think tank
"The overwhelming view in international organizations -- and that means most environmental groups as well as the UN (including UNEP), World Bank, etc. -- is that population is an old and tired topic and can't be engaged in without hints of blaming the victim to outright racism. It's sad but real...For good or ill, when the immigration issue is added, the population issue becomes further tainted." -- a leader in a population organization
"I can't get into the subject of immigration, which is important but about which I am personally conflicted since I have family members who are immigrants." -- an activist in a national population group
"[We don't] engage on the issue of immigration because birds don't recognize borders and immigration in our country won't do anything for the bigger problem of world population...The immigrants who come here quickly learn to limit their families in order to have the chance to have the better life that fewer children can offer. Studies have shown that within a generation they learn that they don't have to have huge families and become Americans. I actually heard that we, as a nation, have attained population stability." -- a leader in a state chapter
I conclude after these first 73 conversations that, nearly 50 years after the first Earth Day, the goal of U.S. population stabilization in pursuit of domestic ecological sustainability remains disturbingly elusive.
Of particular importance here is that many environmentalists don't appear to value domestic ecological sustainability enough to publicly promote immigration policies that might make it possible, somehow viewing the population issue as a singular global issue rather than a widespread local one.
I welcome an email from those of you with insights to share as a person with environmental credentials as an educator, writer, organizational leader, scientist or a person with other connected professional experience.
ROB HARDING
0 notes
Text
Response to Rob Harding’s NUSA Post
It is discouraging to read of the tight grip that political correctness/social justice ideology/ identity politics has on the thinking of these environmental leaders. The replies from the academics were particularly depressing. Keep in mind that they are competing at major universities with the campus thought police who actually believe that they should have veto power, based on their standards of approved thought, over who may or may not be invited to speak on campus. Roy and Leon Kolankiewicz discussed the increasing prevalence of social justice ideology among environmental leaders in their 2000 Journal of Policy History article on the retreat of environmental groups from the population issue.
Apparently, it has never occurred to these leaders to read any good newspaper and learn that immigration is to a considerable extent driving the surge of populist, nationalist, far right movements both here in the U.S. and in Europe. Polls have shown that immigration, political correctness, and fear of “cultural displacement,” particularly among the white working class, put Donald Trump in the White House. Migration from sub-Saharan Africa, the Arab world, and from as far away as Afghanistan has shifted E.U. countries to the far right. Angela Merkel may yet fall victim to her decision in 2015 to allow in 800,000 mostly Syrian refugees. The E.U. may itself collapse. The success of right-wing politicians is the last thing these leaders want but is the one thing that is most likely to emerge should the policies of unlimited migration of the world’s poor into the global north be adopted. I’m not certain that their ideological blinders permit them to see this, but it’s demonstrably true and many polls bear it out.
These leaders apparently believe that Americans should lower their fertility to allow more Third World migrants into the U.S. Try selling that idea to Joe Sixpack and see how far you get. The fact that the multicultural environmentalists entertain such ideas shows how out of contact with political realities they are. In a peculiar way these two groups, the social justice left and the anti-immigrant right, feed off and energize each other. Each ensures the growth and survival of the other. For good or ill, a lot of politics works like this.
I don’t believe there is anything that can be done about the cooption of the population/environment movement by the social justice/identity politics left. There is no changing it. This leaves people whose main concern is population, and not immigration per se, in a sort of political no-man’s land. But for anyone whose chief concern is endless U.S. population growth, there is no where else to turn but immigration organizations like NUSA and CAPS. I for one am turned off by Trump, and the loonies who have embraced and enabled him, Hilary Clinton’s “deplorables.” The separation policy at the border is a total public relations and policy disaster. The failure of the immigration reform movement to loudly and forcefully condemn it as such hurts us with reasonable people.
I planned at one point to write about U.S. population/immigration and may yet do so. I think the approach would be like Edward C. Hartman’s Population Fix: Point out where we are headed; what the future will look like; ask, “Do we want this?”; and let readers make their own decisions about joining NUSA, CAPS etc.
Hope you find this useful.
Fred W. Johnson
0 notes
Text
CHRISTMAS LETTER 2017
This letter is way over the top. There are three sections, my travails, politics, and predictions. My recommendation: Skip the travails and go to the next two. Trump’s recent complaints about the FBI are laying the groundwork for dumping Mueller and Rosenstein. Trump’s tactics are unprecedented in American history, undermining public trust in basic institutions like the press and now the FBI as a pretext for “executive action.” He’ll be dumped in 2020 and possibly the Republican congress sooner. See my comments under Predictions.
There was lots of excitement in 2017. Just like in 2015, I paid an unscheduled visit to Alta Bates Hospital. Same problem as before: bugs got in my PICC, the infusion line through which I pump the TPN that keeps me alive. (A PICC, or peripherally inserted central catheter, is for infusing TPN (total parenteral nutrition,), liquid “food” pumped out of a plastic bag through an infusion line into my vascular system to substitute for food ingested through the normal route because my gut is sickly. I do this every night.) It wasn’t bacteria this time but fungi, an infection called “fungemia.” These little buggers are floating around always and everywhere just like bacteria. How did the fungi get into my blood stream? Through the opening in the clave used to hook the pump to the infusion line. It’s the only way. Once the bugs get in, they go straight into the bloodstream right along with the TPN. Worse, they “colonize” the PICC line, growing in a warm dark place where the immune system can’t get to them.
Major symptoms this year were less severe than the sepsis in 2015: low grade fever, rapid pulse, mild malaise. Nicki, a nurse at Herrick hospital, coached me during one of my weekly PICC dressing changes on the fever (101.4) and heart rate (above 90 bpm) levels indicative of blood infection. The fever had been going on for some time and now my heart rate was also elevated, so after I went home and thought about it, I returned to the hospital, just a block away, to have my blood drawn for culture. Two days later, I got a call from the doctor: “You have a fungal blood infection; they’re waiting for you at Alta Bates Hospital; get there as soon as you can.”
The treatment was simple: One daily infusion of 250 mg Diflucan, an anti-fungal, over 90 minutes for the three days I was in the hospital and for up to 10 days afterward as an outpatient. Also pull the PICC line where the bugs hide out. I could have done all this outpatient but doctors want you in one spot, so I spent three days inpatient. Compared to the bacterial sepsis two years ago, fungemia is a cakewalk. I was never really that sick. Had Nicki not commented, I might have gone on weeks longer not realizing I had a potentially serious infection.
I also paid two visits to Alta Bates ER on the July 4th holiday weekend. Severe back pain this time. I have a developmental anomaly; one of my intervertebral discs just never became a real disc. This is the presumed reason I can’t sit for long. X-rays and MRI’s show a strange-looking structure where a disc is supposed to be. Is that thing really in me? When the mattress atop the box spring sags even the slightest bit after years of use, my back senses the mis-alignment and generates pain far in excess of what seems justifiable or tolerable. This is the third time in 12 years of such, so I have experience with it, but this time was so bad I couldn’t get to the mattress dealer before I became more or less incapacitated.
I slept on the floor to avoid a mattress that looked perfectly fine. Monday, July 3ed, I couldn’t get up off the floor and walk to the kitchen. After a struggle and realizing the pain was getting worse not better, I called 911. The fire department arrived so fast I didn’t have time to crawl on all fours to the door while still talking with 911. The firemen banged on the door, taking me and the gurney down three flights of stairs; strapping fellows those firemen. When one asked how I got to the door, I said, “I put on my track shoes and sprinted, how do you think?” With little appreciation for my humor, we trundled through the Berkeley streets while they quizzed me on my demographics and shot me up with something that made my head spin AFTER we arrived at the ER when I no longer needed it.
Ninety minutes later I’d been given a shot of Dilaudid the brand name for hydromorphone, an opioid pain killer, and scripts for same and Valium, a benzodiazepine tranquilizer/muscle relaxant. I wasn’t too sure about becoming a dope addict until I got a new bed, but at least I could walk. To get to the CVS pharmacy and then home, I used the Uber app I had downloaded two days before for just this situation. It worked great; a driver picked me up in no time; followed by a comfortable ride to the pharmacy ….where they were out of hydromorphone in a country overflowing with opiods! Was half of Berkeley high on it for the holiday? Back to the ER where I asked the clerk to ask the doctor could he prescribe a different pain killer? The doctor couldn’t, and said the muscle relaxant would do. Okay, back to the CVS, get the Valium, and finally home.
Next day the 4th, the same problem all over again. I couldn’t walk. Same drill: Call 911, say hello to the firemen, “I hoped I wouldn’t see you guys again so soon, but they didn’t give me a pain killer yesterday, so here I am,” and find a doctor more forthcoming with pain scripts. Getting home, I struck up a friendship with an Algerian Uber driver, who agreed to drive me on errands until I felt safe enough to drive or walk myself. Next day, Wednesday, we drove to the mattress discounter and bought the firmest one in the place. It was delivered Thursday. Saturday morning, after two nights on the new mattress, much relief finally. The nightmare was over, most of the meds untaken. Long-term solution: Buy a new mattress after 7-8 years use, at least a year before it’s time for a new on.
Medical billing is notoriously slow. Just last week I got a bill for the ambulance ride to the hospital on the second day, July 4th. To go less than a mile, they wanted $2,419.42. Outraged, I called the 800 number and asked why I was billed for the second day, but not the first? Molly, the billing agent, looked this up and told me that there had likely been a coding problem and that my supplemental insurance had probably covered the second ambulance ride just like the first. Relief! When we were done with the transaction, Molly asked if there was anything more she could do for me. I said, “You just saved me $2,400, what more could there possibly be? ” We parted on good terms.
Last year I mentioned two articles I was writing on the weighty topic of whether climate causes civil war. Note that interpersonal violence, better known as violent crime, goes up with temperature; people lose their temper when it gets hotter. This is not in dispute. There is even a study showing that retaliation for hit batters in baseball goes up in hot weather. The dispute is about whether political violence, that is, coups d’état, revolutions, armed insurrections, etc., are more likely to take place as temperatures rise. I had written a story for a science writing class about 3,000 words long focusing on the Syrian civil war including the climatology involved, the relevant history and politics of the Arab Spring, and governance of Syria, which, needless to say, is bad indeed. There was also a second article, more than twice as long, about the general problem of climate and war. This has relevance for a warming world, of course, but is based on historical data from years in which the temperature was above normal due to natural variation. In warmer years was there more civic violence? Interestingly, there was an ongoing dispute among peace and conflict researchers about just this question.
Meanwhile, I ran across a call for science manuscripts at the Atlantic Monthly, that bastion of American liberalism. The somewhat flippant tone of the request made me wary about just how serious they were about the science, but this was the Atlantic Monthly, so I decided to try them out. Having spent so much time on the long story, I wanted to know what chance it stood of finally seeing the light of day. After too much time polishing them, I emailed to the editorial staff links for both articles on my Tumblr blog. Bad idea. They politely told me they would “Take a pass on these.” At least they seemed to have read them, but the feedback I had hoped for on how to make them publishable, especially the long one, was not forthcoming.
Pulling myself together after the rejection, I thought, “Well, these people are looking for infotainment, not science,” and sending both articles was really dumb, no matter how much I wanted the feedback. There is really no way to know which article was problematic although it was probably both. What’s ironic is that the long article is really better even though it’s too technical because it demonstrates that three UC, Berkeley professors who claim their data show that climate causes civil war, are flat out wrong. There is agreement among other researchers that what the data does show is that when crops fail because of heat or drought and there are marginalized groups within a society, only then is civil conflict more likely, as these excluded groups revolt. This was very much the situation in Syria, where a six-year drought ignited a powder keg of political repression, triggering the worst civil war in this century. Climatologists are in general agreement that climate change played a role in the drought, placing stress on people by drying up their crops leading to food shortages and leaving no choice but to revolt in the face of a government that refused any aid at all. Now, after more than seven years of war, the Assad regime, with Russian assistance, has crushed that revolt. The Russians are supposed to be the revolutionaries. Not under Putin.
Writing about this now, I think I know what I did wrong. Maybe I’ll go back, write a new draft and try again, setting aside for a while my latest project.
Politics:
Last year, I said Hilary lost the election by ignoring voters who used to be solidly Democratic. The Reagan Democrats, the Forgotten Man (and Woman), shook the political landscape. But this was really nothing new. For some time, political scientists have studied why working class and rural whites vote for Republicans against their own economic interest. Trump lost the popular vote by nearly 3 million, and won in the Electoral College on the basis of fewer than 80,000 votes cast in swing states that were once safely in the Democratic column, Wisconsin, Michigan, and Pennsylvania. A small percentage of Obama voters switched to Trump in those states, putting him in the White House. Even in the midst of the best economy in years, voters who switched from Obama to Trump are still looking for but not finding a better job, a higher standard of living, and relief from the large impersonal forces of automation and globalization that define our time. But if disappointed by Trump, those voters will turn against him in 2020 if the Democrats find the right candidate. But the Democrats are so divided they just might fail even with two or three more years to work at it.
As late as Spring 2016, a clueless Paul Ryan, Speaker of the House, was touting the Holy Triad of Wall Street Republicans: free trade, open borders, and tax cuts. Trump ran against all three and won an Electoral College upset. Now he is about to sign a tax plan made for corporations and the rich that betrays his populist base. The real purpose of the tax plan is to create deficits that can be used as a pretext to defund Medicare and Social Security, programs Trump promised his supporters he wouldn’t touch. Why does he sell out his base? Because the fat cat donors who call the tune in the Republican Party want the tax cuts they bought with their campaign contributions. Some things never change.
Predictions
The speculation that Rex Tillerson will quit the State Department or be fired next month was quelled somewhat by Tuesday’s State Department briefing at which Tillerson talked like a man with plans who was looking forward to next year. If Tillerson leaves or is ousted, then Mike Pompeo, now CIA director, becomes Secretary of State; Tom Cotton, now a Senator from Arkansas, takes the helm at CIA; and Hilary can run for the open seat in her former home state. Pull for Tillerson because he is moderate and pursues diplomatic solutions. Both Pompeo and Cotton are inexperienced, have military backgrounds, and are hard liners. Their ascent would tilt the scales toward war.
Trump will fire Mueller and start a national furor, perhaps soon. You might think that Trump would find relief when he fires Mueller, but there may be only short-term comfort in the firing given Trump’s history of sexual misconduct and the new political climate on harassment and groping. Just ask Roy Moore.
If the presidential election were held today, Trump would be trounced in the popular vote and would probably lose the Electoral College. But the Democrats would have to win at least 55 percent in the popular vote to have sufficient margin to win the electoral vote in states where they were weak in 2016 including Wisconsin, Michigan, and Pennsylvania. Can the Democrats overcome their internal divisions, much like those in the Republican Party, and find a charismatic candidate who will excite the country the way Trump excited the Forgotten Folks? Don’t bet on it.
There are too many unknowns to call the Senate, now precariously in Republican hands 51 49. The number of Senators up for re-election favors the Republicans, just 9 seats to the Democrats’ 24. But “passion,” which is hugely important in the emotional business of political campaigns, favor the Democrats: energy, anger, and enthusiasm. Also, midterm elections always hurt the sitting president’s party, the Republicans in 2018. Ditto for the House races below. Bottom line, the Republicans keep the Senate.
That energy might win back the House for the Democrats, but jerrymandered districting favors the Republicans. It will take high turnout and lots of atmospherics to overcome that advantage and win the 25 additional seats required to win control of the House. Bottom line: The Democrats win back the House.
We will know about all these predictions except the presidential when next we meet.
Oh, yes. This will be another year of drought in California after a two-year hiatus from the three years of extreme drought before the hiatus. Some things never change.
Happy Holidays,
Fred
0 notes
Text
CHRISTMAS 2016 LETTER
I just read over last year’s Christmas missive, the letter at least one of you didn’t receive in the mail until March. When I first got word that some of you hadn’t gotten your letter, I walked to the Berkeley Post Office, one of the few U.S. Postal Service offices with a permanent street-person encampment reminiscent of the Occupy Wall Street camp ins of 2011. The so encamped were protesting the planned closure of the Central Berkeley Post Office even though most of the protesters have no permanent address so don’t the don’t get mail and can’t afford a post office box either.
Once I got past the encampment and into the lobby, I talked to a certified U.S. Postal Service clerk, who said he and his fellow staff have one billion mail pieces to deliver before Christmas and can’t be expected to get all of them right. I considered switching my voter registration to Republican, but held off.
Think of it, there are 324 million souls in the U.S. That’s only three pieces of mail for every man, woman, and child in the country. Surely, the Postal Service can do better than that; with 617,254 employees in 2015 according to Wikipedia, that’s 1,620 pieces of mail per employee. Seems like a lot, but machines do some of the work, is the post office forbidden from using labor-saving devices?
So this letter is something of a crap shoot. Might get there might not.
In 2015, after wasting most of a year writing a proposal for which the data in hand would not support the envisioned analyses, I decided to try my hand at writing. I had already written about drought in the West, and 40,000 words of a memoir mostly about my epic medical problems. Publishers limit a first memoir to 80,000-90,000 words, and I was going to exceed that. But I didn’t really like what I had written and didn’t like writing it. Maybe some day, but not now, and done much differently. I was looking over the courses UC Berkeley Extension offered in Spring last year and ran across Science Writing, mostly by accident. I signed up. Like most UC extension courses, it was a lot of work, but worth it. Jennifer Huber, a physics Ph.D, taught the course. She had worked at UCSF in imaging; probably living in the soft money world of grant-to-grant funding where I worked for 18 years. She has been writing for 10 or more years now and has it all up on a web site. She was a tough grader and superb editor. I had to shed my technical writing style for something more compelling to the educated lay reader.
She liked my final project, “Climate Change, Climate Cycles and the Syrian Civil War,” and suggesting “pitching” it to a publisher. That was in the first week of June. I thought I needed to establish that climate is in fact related to civil war before writing about a single example of climate actually causing civil strife. That was a big mistake. Six months later, I’m still polishing the article, having stumbled into an academic controversy that got into the press. Does climate cause civil war? Not climate change, though the topic has obvious relevance for that inevitability, but just normal variation, which can at times be extreme; think of the 1930s Dust Bowl. A group of UC, Berkeley economists says, “yes;” a group of European political scientists says, “no.” I’m still undecided despite plowing through many journal articles.
I’ve spent more time on this than on any writing task since my dissertation, often going far astray into topics like Bayesian statistics. Lesson: Keep it simple. It’s already complicated enough and the average intelligent reader isn’t interested in esoterica. Most science articles for the non-specialist are about one journal article; I’ve read scores plus additional textbook material for this article, enough to write a book, though I never intended to do that. I have one set of notes that’s 76 single-spaced pages long, mostly copy and paste material from various articles, but also my “ideas.” I never looked at it again after building the thing up. There are other sets of notes not so epically long. Didn’t look at those either. Regardless of the notes, at some point, I’ll try to market what I have. Selling is not my strong suit. Tune in again next year.
A little more substantively, let’s see if I can discuss this earth-shattering election without stepping on toes.
Almost every pollster, forecaster, and pundit got it wrong. Probably no one was more surprised by this than Donald Trump. Maureen Dowd in the Times had it right: Trump never really wanted to be president. At one point Trump seemed more interested in a media enterprise involving himself, Steve Bannon of Breitbart News, and Roger Ailes, late of Fox News until scandalized from his lofty perch there. Hilary was a professional politician: first lady, senator, 2008 presidential candidate, Secretary of State, no media ambitions.
I often thought last summer, this lady can’t give us one good reason why she wants to be president other than to just have the job. In the California primary, I voted for Sanders to register a protest. If Joe Biden didn’t have a bad case of foot-in-mouth disease, and wasn’t 76 years old, I think he would have won because he had blue collar appeal. How good at handling the presidency, I don’t know.
Maureen Dowd, a Times columnist, had the following to say about Hilary and her flaws as a candidate:
“Hillary’s campaign message boiled down to “’It’s my turn, dammit.’”
“Hillary should have spent less time collecting money on Wall Street and more time collecting votes in Wisconsin.”
“As she cuddled up to Wall Street, Hillary forgot about the forgotten man — and woman.”
FDR coined the phrase the “forgotten man” in the 30s, championed their cause, and made them loyal Democrats. Nixon stole them from the Democrats, largely over race and campus protest, and called them the “Silent Majority.” Under Reagan, the media called them “Reagan Democrats.” In elections going back to Reagan, the forgotten man voted against their own working class interests by supporting Republicans who then enacted policies favoring the upper classes every time despite their base of solid blue-collar support; think “trickle down,” that is, tax cuts for those who need the money least, the rich.
The Democrats either forgot about the forgotten man or ignored him. Bill Clinton told his wife to campaign for working class white voters, but she wasn’t interested in “The Deplorables.” Hilary blames her loss on Putin’s meddling and FBI Director Comey’s pseudo-revelations about her private server two weeks before election day. This is small ball and misses the larger point of the Brexit vote and Trump’s win: Many people have been hurt by globalization, they are just out of sight to the rich and powerful beneficiaries of the global economy. These are mostly big city dwellers on either coast, New York City, San Francisco, Seattle, etc., and includes the Wall Street bankers Dowd notes above and whom Hilary charged a quarter million per speech to hear about the glowing future the global economy has in store for them. The forgotten man was forgotten until November 8th.
But it should be kept in mind amidst all the talk of white backlash, populism, the Alt-Right, etc., that only once since WW II have voters stayed with one party for three terms. That was the first Bush (G. H. W. Bush) who served Reagan’s third term; Bill Clinton turned him out after a single term. People want a change after eight years of one party rule, and if you’ve lost your high-wage manufacturing job under the Democrats, you’re going to vote Republican even if the corporation that off-shored your job to China or Mexico is run by Republicans.
Given that automation took most of those jobs, or as Thomas Friedman put it, “You didn’t lose your job to a Mexican, but to a micro-chip,” Trump can’t deliver on his promise to bring back manufacturing jobs, the Carrier deal notwithstanding. But he might deliver on infrastructure, and this would be a good thing if done right. The country’s roads, bridges, ports and grid are in bad shape.
The nation needs to spend at least $3.6 trillion according to the American Society of Civil Engineers. Rebuilding America would bring back jobs to some, but not all. Tax cuts of any kind will be more fiscal stimulus; no wonder the stock market has reversed its view on Trump and set off the recent upward spike. With the stimulus will come inflation, higher interest rates, and eventually some sort of crash or cool down. But it might get Trump re-elected if he doesn’t blow up the world in a Twitter-feed temper tantrum.
Stay tuned. It promises to be a wild ride.
Happy New Year,
Fred
One thing you must know: There will be a total eclipse of the sun on August 21. Here is a website with many maps for all to consider:
http://www.eclipse2017.org/2017/maps.htm
For those of you in Washington and Oregon, the arc of totality will cross I-5 just south of Salem, Oregon. For those in Idaho, Idaho Falls is near the center of the band of totality, which then clips the southern bulge of Grand Teton National Park. If I lived nearer, I wouldn’t miss it, but my present state doesn’t permit getting much closer than downtown Berkeley.
0 notes
Text
Climate change gets blamed for a lot of bad things: droughts, floods, hurricanes, disease, species extinction. Should we add civil war to the list? This question has been the focus of intense debate among a small group of behavioral scientists in the field of peace and conflict studies. The work of three economists, Solomon Hsiang, Marshall Burke, and Edward Miguel at University of California, Berkeley, suggested that climate alone, high temperatures or drought, can plunge countries into civil war. These findings were heresy among peace and conflict researchers, none of whom had ever found evidence of climate affecting political behavior. Among the doubters, Halvard Buhaug, a political scientist at the Peace Research Institute in Oslo was most adamant in rejecting the Berkeley group’s findings. The spirited exchange of letters and studies between Buhaug and the Berkeley group gave rise to a wave of new research on the climate-civil war connection, none replicating the Berkeley group’s findings. Ironically, after initially publishing several studies that also found civil conflict unaffected by climate, Buhaug was one of the first researchers to find that, under certain circumstances, climate can produce civil conflict and that climate is in fact related to political affairs.
Buhaug and colleagues found that climate can trigger civil war when growing season drought affects subgroups that are either agriculturally dependent or politically excluded in poor nations. John O’Loughlin, a geographer at University of Colorado, Boulder and colleagues also found that climate is most likely to play a role in civil war only in countries where farming is the main livelihood and there are few political rights. These findings mean that the same drought that has little effect on a politically open, economically more developed country may set off a chain of events leading to civil war in a nearby country that is poor, has few political rights, and a sector of agriculturally dependent farmers.
This differs from the Berkeley group’s claim that climate alone, heat or drought, regardless of the political facts on the ground, can produce civic violence and war. In the vernacular of statistics, the Berkeley group found a main effect for climate, where climate alone raises the probability of civil war. But Buhaug and O’Loughlin found an interaction effect, where climate raises the probability of civil war only conditionally when agricultural dependence and political exclusion exist among subgroups in poor countries.
Based on a series of studies of ancient climate and civil war, Zhang proposed a model for how climate change may cause violent conflict including civil war. Simplifying: climate change reduces crop production resulting in food scarcity; the populace demands food and other assistance from its government, which cannot or will not provide help; the populace revolts; civil war ensues. This is exactly what happened in Syria from 2006, when the drought began, through early 2011, when the civil war commenced. A good historical example of climate failing to trigger civil war is the American dustbowl of the 1930s when drought and severe heat failed to cause civil war in large part because there were government institutions to support drought-afflicted farmers.
Civil war in one country can have a destabilizing effect on neighboring countries when people migrate in search of food potentially sparking a cross-border war. Some 7.6 million Syrians have been internally displaced and 4.8 million Syrians have fled the country. War between nations has not broken out, but the large number of refugees places a potentially destabilizing burden on Syria’s neighboring countries: Turkey, Lebanon, Jordan, and even far away Western Europe, where the European Union member states are divided over refugee policy and right wing parties have flourished because of the ongoing migrant crisis.
Syrian drought
Syria has an annual weather cycle much like California: a classic Mediterranean climate of mild winters with occasional rain and warm dry summers. Over the last century, from 1900 to 2005, Syria experienced five droughts that lasted a single wet season, and a sixth drought that lasted two wet seasons. But starting in 2006, Syria endured a six-year drought that persisted through 2011 and was the most severe since 1902 when record keeping began.
One can see in Figure 1 that after 1970, the years with below normal precipitation (red bars) begin to outnumber the years with above normal precipitation (green bars) and the trend line in black mostly remains below the long-term average. The Mediterranean region has experienced 10 of its 12 driest years on record since 1993.
Figure 1
Time Series of Mediterranean Cold-Season Precipitation From 1900 through 2010

Observed time series of Mediterranean cold season (November–April) precipitation for the period 1902–2010. The solid black line is smoothed precipitation. Years are shown on the X-axis; precipitation above or below the long-term average is shown on the Y-axis.
http://www.noaanews.noaa.gov/stories2011/images/hoerlingetalfig1a.jpg
In a 2010 paper, Martin Hoerling and colleagues at the Earth Systems Laboratory in Boulder, Colorado noted that half the land area in the Mediterranean Basin was used for agriculture, which consumes 60 to 80 percent of available water. This means that continued precipitation at the historical average is critical for food security. But if the trend toward drier winters continues, how will food be grown? More basically, why has the rain stopped?
Atmospheric cycles
There are three cycles that influence weather in the North Atlantic Basin, but we are interested only in the North Atlantic Oscillation (NAO), which strongly affects winter temperature and precipitation patterns over all of Europe and the Mediterranean. Just knowing this, one can sense that the NAO has enormous influence over the success or failure of agriculture in this region, which is home to well over a half billion people.
Unlike the El Nino-Southern Oscillation, which involves the influence of ocean currents on the atmosphere, the NAO is a completely atmospheric phenomenon. It involves an area of low pressure, the Icelandic Low, and an area of high pressure, the Azores High. The NAO has two phases, named the positive (NAO+) and negative (NAO-) phases.
The positive phase occurs when both the Icelandic Low and Azores High are stronger than normal. This means there is lower than normal pressure near Iceland and higher than normal pressure over the Azores. Because the high-pressure cell over the Azores rotates clockwise and the low-pressure cell over Iceland rotates counter-clockwise, the two pressure systems mesh like gears and storms are ushered directly across the North Atlantic. This results in mild, wetter winters in Europe and mild, drier winters in the Mediterranean Basin.
The negative phase occurs when both the Icelandic Low and Azores High are weaker than normal, which blocks storms crossing the North Atlantic. This results in cold, drier European winters, because Arctic air invades from the north, and mild wetter Mediterranean winters, because storms are diverted south. Figure 2 shows how the varying configurations of the two pressure cells, the Icelandic Low and Azores High, affect the storm track, precipitation, and temperature for the positive and negative phases of the NAO.
Figure 2
Positive and Negative NAO

http://apollo.lsc.vsc.edu/classes/met130/notes/chapter10/nao.html
After 1970, when winters became drier in the Mediterranean Basin, Northern Europe became wetter as shown in Figure 3. One explanation for the six-year Syrian drought might be that the NAO became “stuck” in its positive phase, something that might happen by chance, like getting heads in six consecutive flips of a coin. Assuming that the positive phase occurs a random 50 percent of the time, six consecutive positive NAO winters has only a 1.6 percent chance of occurring (.5 raised to the sixth power). Is it more likely that the Syrian drought, and the civil war that followed it, resulted from climate change due to human activity, such as burning fossil fuels? Climate modeling can help answer this question.
Figure 3
Change in Mediterranean Rainfall Pattern from 1970 to 2010

Observed change in cold season (November-April) precipitation for the period 1971–2010. Dark red means more than 60 millimeters reduced average precipitation from the long-term average, years 1902-2010, for each year in the forty-year period, 1971–2010.
http://www.noaanews.noaa.gov/stories2011/images/hoerlingetalfig1b.jpg
Climate models, climate change, and civil war
Colin Kelley and colleagues at the University of California, Santa Barbara ran a series of models to estimate the effect of climate change on the Syrian drought. A model that included greenhouse forcing fit better than a model that included only natural variation. In climate modeling terms, this means the signal implicating global warming is loud and clear against the background noise of normal climate variability.
Using only data from Syria, Kelley showed that in each of the driest years after 1901 and in all of the 46 years since 1970, there was an anomalous high pressure cell frequently positioned astride the Eastern Mediterranean. The circulation associated with this high-pressure cell blocked moisture-bearing winds from the west and set up a northerly flow of dry air from the interior of western Asia. Kelley’s group concluded that human-induced climate change was a major factor in creating the drought and therefore also a factor in Syria’s civil war.
Hoerling and colleagues used global Sea Surface Temperature (SST) data to find a model that would best account for the warming and drying of the entire Mediterranean Basin seen in Figure 3 above. Testing several different SST patterns, they arrived at a model that included uniform warming by 0.5 C of earth’s tropical oceans plus warming by 1.0 C of the Indian Ocean, also tropical. This model replicated the pattern of warming seen in Figure 3. Based on these results, Hoerling concluded that greater SST warming in the tropical and Indian Oceans was responsible for about half the Mediterranean drying, the other half being due to natural variation, probably involving the positive NAO.
They may differ in their modeling approaches and in the details of their results, but Kelley and Hoerling both reached the same conclusion: The Syrian drought would not have occurred or would not have been as severe without climate change due to fossil-fuel burning.
Other factors leading to civil war
The Syrian civil war is no exception to the rule that all wars have multiple causes. In Syria’s case, these causal factors included refugees from Iraq, long-simmering resentments against a dictatorial state, and agricultural policies under the ruling Assad family. Foremost among these were mismanagement of Syria’s water and farmland resources, beginning with the current dictator’s father Hafez al-Assad, who ruled Syria from 1971 to 2000.
Despite scarce water resources and frequent droughts, the elder Assad initiated policies to increase food security and his popularity among rural subjects. These policies included distributing land, building irrigation projects, and providing diesel fuel subsidies that enabled groundwater pumping to become widespread. Syria achieved agricultural self-sufficiency in 1995, but at the price of water insecurity.
Bashar, Hafez al-Assad’s son, took power in 2000 and adopted unsustainable policies that led inevitably, given the Assads’ excesses, to the decline of Syria’s agricultural sector. Overpumping of groundwater reached epic proportions— the number of wells increasing from 135,000 in 1999 to more than 213,000 in 2007, severely depleting aquifers.
Syria uses 160 percent of its available water, while Turkey uses 20 percent and Iraq, which is mostly desert, uses 80 percent. To use this much water, Syria must devote all of its precipitation plus a large volume of groundwater to supply its needs. Much water is wasted with furrow-flooding irrigation.
Growing water-intensive crops such as cotton and depleting aquifers made the country vulnerable to drought. Huge losses in livestock, up to 85 percent in northeast Syria, impoverished farm families in the country’s agricultural heartland. The livestock losses were matched by massive crop failure in 2010, with over 75 percent of Syrian agriculture experiencing total crop failure.
With these losses, farm families were driven off their land. All told, some 1.5 million people migrated to the peripheries of cities to find food and employment. But they were not the only ones in search of these essentials.
After the U.S. invasion of Iraq in 2003, as many as 1.5 million Iraqi refugees fled to Syria, settling in the outlying areas of Syria’s cities. With food production dropping and refugee populations soaring in the cities, Syria’s urban population exploded from 8.9 million in 2002 to 13.8 million in 2010, an increase of more than 50 percent. Such rapid population growth, whatever its cause, can be destabilizing.
With these drought-related problems in the background and the cities swelling with rural and Iraqi refugees, government security forces cracked down on pro-democracy demonstrators in the city of Deraa in March of 2011. Unrest escalated until all-out civil war erupted as government forces fought rebel brigades and anti-government demonstrations swept the country demanding Bashar Assad’s resignation.
Improving sustainability in a desiccating world
What can Syrians do if, as Kelley warns, long droughts become more common in a warming world? One simple and obvious measure would be to stop the wasteful practice of flood irrigation and replace it with more efficient drip and sprinkler irrigation — although these methods are more costly. Another measure would be to stop growing water-intensive crops such as cotton and stop growing crops for export if it means any Syrian will go hungry. Syria still exports some lamb, olives, and other crops, but it now imports much of its wheat.
As with wheat, Syria will have to make up for other drought-induced food shortages with imports. In an email interview, Peter Gleick, President Emeritus of the Pacific Institute in Oakland, California and a noted authority on water, stated that “Syria will have to enter the international market in food to make up for shortfalls in domestic production due to insufficient water. But this requires a working economy, something Syria obviously does not have due to nearly a decade of crippling war.” To re-establish such an economy will require a huge postwar rebuilding effort of many-years duration and will also require making goods or offering services to sell that other countries will want to buy in exchange for food.
Gleick noted that to deal with its dwindling water resources as rainfall decreases and aquifers are depleted, “Syria will have no choice but to bring its [water] use into line with its resources. This means adoption of conservation strategies and more careful use of the water Syria does have. It is possible that Syria’s agricultural production will be more limited in the future.”
Regional issues
Although Syria is currently fighting a civil war, the war could become regional, especially as refugees continue to flee the country. Since the fall of 2016, a bewildering array of parties has become involved, Russia, Turkey, the Kurds, Iran, and the U.S. each in various alliances with each other and with Arab groups either for or against the Assad regime, and each with differing motivations for fighting. One complication is Turkey’s control of the Tigris and Euphrates Rivers; Turkey reduces the flow of the Euphrates River by 80 percent and of the Tigris River by 40 percent through dams and diversions for the Southern Anatolian Project.
Syria depends heavily on these rivers, as does Iraq. Gleick noted, “The failure to negotiate and sign a comprehensive agreement on the Tigris and Euphrates rivers is a great impediment to peace in the region.” I would add that quite likely Turkey’s failure to negotiate is because Turkey has control of the upper reaches of both rivers and is unwilling to compromise its strategic advantage.
Asked about the likelihood of war between Syria and Turkey over these two rivers, Gleick noted the “internal violence already taking place related to water,” chief among them Syria’s civil war. A destabilizing conflict like civil war makes cross-border war more likely. The large number of outside parties in the civil war makes continuation of the conflict more likely. Civil wars often end because one or both sides becomes exhausted. This is less likely when foreign countries become involved because the foreign country populations don’t experience suffering and destruction and thus have less reason to stop fighting than the people in the country where the civil-war is actually taking place.
Domestic policy
Another necessary step to solve Syria’s drought-related problems would be greater efforts to bring down the fertility rate to sustainable levels, especially in rural areas. “It is certainly true that rapidly rising populations make many of these resource problems much harder to solve,” Gleick noted. “Many countries have reduced population growth rates successfully, and I expect much of the Middle East will as well.” One hopeful sign is that 58.3 percent of Syrian women were using contraceptives as of 2006, about the global average.
The most important step is to end the destructive policies of the central government. In order to attain agricultural self-sufficiency, both Hafez and Bashar al-Assad adopted disastrous land- and water-use policies. Instead of using basic resources to increase political power or reward friends who then employ wasteful practices, the government must adopt policies for the benefit of the governed. As Gleick put it, “The biggest problems are political, not resources.”
According to “Worldwide Governance Indicators,” Syria ranked in the bottom five percent on a survey of measures of accountability, freedom of expression, and public participation in government. This was in 2010, before the civil war began.
Francesca de Chatel, a specialist on Middle Eastern water issues who lived in Syria until 2010, wrote, “It was not the drought per se that helped start the civil war, it was the government’s failure to respond to the ‘humanitarian crisis’ caused by the drought that was one of the factors that triggered the uprising,” which then led to civil war. She stated further that “discontent” had been simmering in rural areas long before the drought and ensuing civil war. Higher temperatures, less rainfall and the subsequent drought, each due at least in part to climate change, combined with an autocratic regime that excluded its entire population from any political expression gave rise to Syria’s civil war, just as O’Loughlin and Buhaug found in their research. When they occur together, political exclusion and drought due to climate-change may predict where civil war will take place in the future.
Conclusion
Both the Kelley and Hoerling studies agree that the Syrian drought is partly due to human-induced climate change. Climate appears related to civil conflict, at least in Syria. Climate does not cause conflict, but it creates intolerable conditions for large numbers of people that are difficult for governments to remediate, setting the stage for conflict between the demands of the people and the failure of governments to meet them. Social unrest and civil war ensue. Syria became a case history for this process.
Given that other countries in the Greater Middle East (Libya, Iraq, Yemen) are in turmoil and the Mediterranean region will likely get both warmer and drier throughout this century, the entire region faces severe challenges. It seems likely that more Arab governments, nearly all authoritarian, will fail to meet these challenges — increasing the likelihood of more wars, both civil and cross-border. This might also be the future for parts of Africa, Central America, and South Asia.
Can we find a ray of hope in this gloomy picture? Climate change is an “existential threat,” but one so distant it’s too abstract for people to take positive action. But it’s also a threat that has a straightforward solution: phase out fossil fuels and replace them with non-polluting energy sources, solar, wind, geothermal, and others. This will be difficult for two reasons: 1) currently existing technology and trillions of dollars of built infrastructure stands in the way of new technologies; and 2) there will be intense resistance from the fossil fuel industries and their allies in government.
But renewables do have advantages, including greater price stability even as prices gradually drop with improving technologies. For many renewables—wind, solar, geothermal, tidal—the fuel is free. The price of oil has risen steadily since 2014, making renewables even more attractive. Just as cell phones allow developing countries to leap frog the high infrastructure costs of land lines, developing countries are skipping fossil fuels and going directly to renewables. Of the $367 billion invested globally in renewables in 2015, more came from poor countries than rich ones; but overall investment in renewables dropped 18 percent in 2016 from the previous year.
There are other positive signs: This year, China plans to start the world’s largest carbon trading market. British Columbia has had a revenue-neutral carbon tax since 2008 and experienced greater economic growth than the rest of Canada since that year.
Despite these and many other examples of progress, the concentration of atmospheric carbon dioxide is now (March 6, 2017) at 406 parts per million (ppm) and is rising at an increasing rate (it was 403 ppm in March last year). James Hansen, a prominent climate scientist at Columbia University, notes that climate change is proceeding faster than all the models predict, including his own which are often the most pessimistic but now frequently underpredict sea-level rise. We are in a race with the laws of physics. Who wins is up to us.
0 notes
Text
CURRICULUM VITA
Fred W. Johnson, Ph.D.
Education
Ph.D., Educational Psychology; UC, Berkeley; 1990.
M.A., Psychology; CSU, Sacramento; 1981.
B.A., Psychology; University of Washington; 1975.
Doctoral Dissertation
Title: Within-Family Analysis of Cognitive and Physical Variables in Siblings and Twins.
Master's Thesis
Title: Effectiveness of a Mental Health Diversion Program with Misdemeanor Offenders.
Consultant - 2009 - present.
Associate Research Scientist - Prevention Research Center; 1996 - 2008.
Postdoctoral Research Fellow - School of Public Health; UC, Berkeley; 1994 - 1996.
Research Analyst - Prevention Research Center; 1993 - 1994.
Postdoctoral Research Fellow - School of Education; UC, Berkeley; 1991.
Research Fellow - School of Education; UC, Berkeley; 1986 - 1990.
Publications
Gruenewald, P. J., Ponicki, W. R., Remer, L. G., Johnson, F. W., Waller, L. A., Gorman, D. M., Tzu, L. (2012). Spatial Models of the Growth and Spread of Methamphetamine Abuse in California. In B Sanders, Y. F. Thomas, B. G. Deeds, (eds.) Crime, HIV and Health: Intersections of Criminal Justice and Public Health Concerns,” pp 167-186. Springer, 2013.
Gruenewald, P. J., Johnson, F. W., Ponicki, W. R., LaScala, E. A., & Remer, L. (2010). Assessing the correlates of growth and change in methamphetamine abuse and dependence in California. Substance Use and Misuse, 45(2): 1948-1970.
Gruenewald, P. J. & Johnson, F. W. (2010). Drinking, driving and crashing: A traffic flow model of alcohol-related motor vehicle accidents. Journal of Studies on Alcohol and Drugs, 71, 237-248.
Gruenewald, P. J., Johnson, F. W., Ponicki, W. J., & LaScala, E. A. (2010). A dose-response perspective on college drinking and related problems: Addiction, 105(2), 257-269.
Johnson, F.W., Gruenewald, P. J., & Remer, L. (2009). Suicide and alcohol: Do outlets play a role? Alcoholism: Clinical and Experimental Research, 33(12), 2124-2133.
Treno, A. J., Gruenewald, P. J., Remer, L.G., Johnson, F., & LaScala, E.A. (2008). Examining multi-level relationships between bars, hostility and aggression: Social selection and social influence. Addiction, 103(1), 66-77.
Treno, A. J., Johnson, F.W., Remer, L., & Gruenewald, P.J. (2007). The impact of outlet densities on alcohol-related crashes: A spatial panel approach. Accident Analysis & Prevention, 39, 894-901.
Gruenewald, P.J. & Johnson, F.W. (2006). The stability and reliability of self-reported drinking measures. Journal of Studies on Alcohol and Drugs, 67(5), 738-745.
Freisthler, B., Gruenewald, P. J., Johnson, F. W., Treno, A. J. & LaScala, E. A. (2005). An exploratory study examining the spatial dynamics of illicit drug availability and rates of drug use. Journal of Drug Education, 325(1), 15-27.
LaScala, E. A., Gruenewald, P. J. & Johnson, F. W. (2004). An ecological study of the locations of schools and child pedestrian injury collisions. Accident Analysis and Prevention, 36(4), 569-576.
Gruenewald, P. J., Johnson, F., Light, J., Lipton, R., & Saltz, R. (2003). Understanding college drinking: Assessing dose-response from survey self reports. Journal of Studies on Alcohol and Drugs, 64(4), 500-514.
Gruenewald, P. J., Light J., & Johnson, F. (2003). Drinking to extremes: Theoretical and empirical analyses of maximum drinking levels among college students. Journal of Studies on Alcohol and Drugs, 64(6), 17-824.
Gruenewald, P. J., Johnson, F. W., & Treno, A. (2002). Outlets, drinking and driving: A multilevel analysis of availability. Journal of Studies on Alcohol and Drugs, 63(4), 460-468.
Gruenewald, P. J., Russell, M., Light, J., Lipton, R., Searles, J., Johnson, F., Trevison, M., Freudenheim, J., Muti, P., Carosella, A. M., & Nochajski, T. H. (2002). One drink to a lifetime of drinking: Temporal structure of drinking patterns. Alcholism: Clinical and Experimental Research, 26(6), 916-925.
LaScala, E. A., Johnson, F. W., & Gruenewald, P. J. (2001). Neighborhood characteristics of alcohol-related pedestrian injury collisions: A geostatistical analysis. Prevention Science, 2(2), 1123-1134.
Treno, A. J., Gruenewald, P. J., Johnson, F. W., & Ponicki, W. R. (2001). Alcohol availability and injury: The role of local outlet densities. Alcoholism: Clinical and Experimental Research, 25(10), 1431-1440.
Gruenewald, P. J., Johnson, F. W., Millar, A., & Mitchell, P. (2000). Drinking and driving: Explaining beverage-specific risks. Journal of Studies on Alcohol and Drugs, 61(4), 515-523.
Johnson, F.W., Gruenewald, P. J., & Treno, A. J. (1998). Age-related differences in risks of drinking and driving in gender and ethnic groups. Alcoholism: Clinical and Experimental Research, 22(9), 2013-2022.
Johnson, F.W., Gruenewald, P.J., Treno, A.J. & Taff, G.A. (1998). Drinking over the life course within gender and ethnic groups: A hyperparametric analysis. Journal of Studies on Alcohol and Drugs, 59(5):568-580.
Treno, A. J., Gruenewald, P. J., & Johnson, F. W. (1998). Sample selection bias in the emergency room: A critical problem in the examination of the role alcohol plays in injury. Addiction, 93(1), 113-119.
Johnson, F. W. (1991). Biological factors and psychometric intelligence: A review. Genetic, Social and General Psychology Monographs, 117(3), 313-357.
Presentations
Johnson, F. W. (2002, June). Outlets, drinking and driving: A multilevel analysis of availability. Paper presented at the annual conference of the Research Society on Alcoholism, San Francisco, CA.
Johnson, F. W. (1999, June). Drinking, driving and crashing: A flow model of alcohol-related traffic collisions. Paper presented at the annual conference of the Research Society on Alcoholism, Santa Barbara, CA.
Johnson, F. W. (1995, October). Age, gender, and ethnicity: Hyperparameter models of drinking. Paper presented at the American Public Health Association convention, San Diego, CA.
Johnson, F. W. (1987, April). Bootstrapping the intraclass correlation. Paper presented at the American Educational Research Association convention, Washington, D.C
Reports
Wilson, R. C. & Johnson, F. W. (1983). Evaluation of the UC/CSU Diagnostic Mathematics Testing Project Precalculus Tests. Berkeley: University of California, Teaching Innovation and Evaluation.
0 notes
Text
Climate and Violence: Are They Connected?
In his book, The Better Angels of Our Nature, Steven Pinker makes a strong case for the broad proposition that there has been a decrease in all manifestations of human violence. Pinker uses 800 pages of text and scores of graphs to document the decline of violence at all levels, individual, group, and national. Over millennia, historical processes have changed our thinking and behavior, enabling us to bring under control our worst impulses. This has led to the current era in which warfare is at a historic low, following the “Long Peace” after World War II and a “New Peace” since the end of the Cold War. At the individual level, rights and tolerance have been extended to all races, genders, and sexual orientations in what Pinker calls a “Rights Revolution.” Ours is the least violent period in human history and there is every reason to believe that this peaceful period will continue.
Pinker identifies four threats to this beneficent state of affairs, a civilizational clash with Islam, nuclear terrorism, a nuclear Iran, and climate change. He argues that neither threat is likely to disrupt the New Peace. But at the conclusion of his positive review of Pinker’s book, the philosopher Peter Singer noted that Solomon Hsiang, an economist, had recently done work showing that in tropical countries during warmer, drier El Nino years, there is a doubling of civic violence, including civil war. Does this mean that Pinker’s argument will be proved wrong as the world inevitably warms in the future and that we may enter a new phase of human history in which violence reverses its long downward course and rises again?
In 2011, when Pinker’s book was published, there was already a spirited academic debate about the connection of climate to violence. In this article, I give a brief description of the effect climate has on interpersonal violence, primarily crime, relying heavily for sources on a paper by Solomon Hsiang, Marshall Burke, and Edward Miguel, all economists at the University of California, Berkeley (henceforth “the Berkeley group” Disclosure: I am a Berkeley graduate). I also give an account of the dispute over whether climate is related to large-scale intergroup violence in its worst form, civil war. The controversy involved on one side, the Berkeley group and on the other, a number of European researchers in the field of peace and conflict studies, a normally quiet academic field that examines the forces that produce war and violence locally and globally. Variously termed, among other things, “the climate-civil war controversy” or “climate wars,” the dispute gave to peace and conflict studies far more press notoriety than it is normally accustomed.
Interpersonal Violence
Everyone knows that people are more irritable in hot weather than cold. The urban riots of the 1960s all occurred in the summer with the exception of the rioting that followed Martin Luther King’s April 4th assassination, a unique triggering event. Most of the recent police shootings of unarmed black men and the assassinations of five police officers in Dallas took place in the summer. Reviewing the literature, one finds that research strongly supports a relationship between interpersonal violence and climate, particularly temperature.
In the most exhaustive study of criminal activity in the U.S., nine crime categories were examined, the violent offenses homicide, rape, aggravated assault, simple assault, and robbery; and the nonviolent offenses, burglary, larceny, and vehicle theft. The frequency of all crimes except manslaughter, a subcategory of homicide, rose as temperatures increased above the seasonal average. Other research shows that assault rates increase with above normal temperatures both in the hot cities of the south, such as Dallas, and in the cooler cities of the north, such as Minneapolis. Both in the U.S. and Australia, domestic violence also rose with above average temperatures. The picture is no better in developing nations. In India, “kitchen accidents,” killings for insufficient dowry, increase in abnormally dry weather. In Tanzania, so called “witch” killings, the killing of elderly women in a family, increase when weather conditions, either drought or flood, place the survival of the other, “less expendable,” family members in jeopardy.
In a study that might shed light on police behavior toward unarmed black men, three Dutch investigators found that police trainees perceived the behavior of video-taped offenders as more threatening and reacted to the offenders more aggressively in higher rather than lower temperatures, 81 °F versus 72 °F, only a 9-degree temperature differential.
Not all climate variables increase violence. Rainfall has been shown to dampen violent crime by about 10 percent with each weekly inch of rain above the seasonal norm. Snowfall also reduces crime.
In baseball, there is a tradition of retribution in kind for a pitcher hitting a batter by having one’s own pitcher hit one of the opposing team’s batters. Such retaliation is more likely to occur in hot weather then cool. A benign if annoying form of aggression, horn honking at intersections, increases in a predictable linear manner as temperatures rise in Phoenix, Arizona.
These findings, across most categories of violent crime and in various countries, show that the relationship between temperature and violence is found not just in the U.S., which does a disproportion of research globally, but in other countries both rich and poor, strongly suggesting that, at the interpersonal level, the climate-violence connection involves a general human trait.
In 2013, the Berkeley group published a paper in Science that included a meta-analysis to obtain a single, overall estimate of how much interpersonal violence rises with a one standard deviation (SD) increase in temperature above the seasonal average in the eleven studies just cited, all of which were published recently. Meta-analysis is a procedure for obtaining a weighted average of the temperature effect across all the studies that meet the researchers’ criteria for inclusion in the analysis. The mean effect for temperature was 2.3 percent. This means if there is a one SD increase in temperature above seasonal normal, violence increases by 2.3 percent. Not a great percentage increase, but substantial when one takes into account the large number of reported violent crimes in the U.S., which between the years 1979 and 2009, were two million annually. With this base rate, a 2.3 percent increase would be about 46,000 more violent crimes each year.
Climate and Civil War
Climate and crime data to study interpersonal violence are readily available from government sources such as the weather bureau and police records. Obtaining data for the study of civil war can be problematic, however, because defining civil war is more fraught than might appear at first blush. The most frequently used data on warfare comes from the Uppsala Conflict Data Program, or UCDP; and the Peace Research Institute in Oslo, Norway, or PRIO, which jointly produce the UCDP/PRIO Armed Conflict Dataset and other conflict-related databases. The Armed Conflict Dataset includes all conflicts from 1946 to the present that result in at least 25 annual battle-related deaths and in which at least one actor is the government of a nation state. Civil wars are major (1,000 or more annual battle deaths) or minor (less than 1,000 annual battle deaths). But ascertaining whether any particular conflict actually has the required number of deaths to meet an objective criterion is difficult, especially when categorizing low-level conflicts in developing nations where the information that later becomes data is often unreliable.
Civil War Round I
In 2004 with little fanfare, Edward Miguel, later a member of the Berkeley group, and colleagues published a study on the relationship between civil war and economic conditions in sub-Saharan African countries as measured by GDP growth or shrinkage. The paper appeared in the widely respected Journal of Political Economy and turned out to be ground-breaking. Miguel and colleagues did the research because war is the most deadly form of conflict and civil war the most deadly form of warfare. Globally since 1945, war within countries has cost three times the number of lives as warfare between countries, which has now largely died out. In the 1980s and 1990s, civil wars were more frequent in sub-Saharan Africa than in any other region. Miguel included minor civil wars, those with 25 or more annual battle deaths. In all cases, at least one actor was a government.
There is a problem with using direct measures of GDP to show that economic conditions might be related to civil war. This is the problem of “simultaneity bias,” or what is more easily thought of as two-way causality, that is, when two variables have mutually causal relationships with each other. Falling incomes may cause civil war, but civil war will likely also cause incomes to fall. If you find the two related, how do you know which is causing which? One solution to this problem is to use “instrumental variables,” that is, substitute for GDP growth a measure strongly related to economic growth, but a measure that cannot be affected by economic activity so that the causal arrow clearly goes in one direction only. In sub-Saharan Africa, a good instrument is rainfall because African economies are largely agricultural and 99 percent of sub-Saharan African agriculture depends on rainfall rather than irrigation. More importantly, rainfall, or lack of it, might cause civil war by depressing economic growth; but, clearly, civil war does not cause rainfall.
Miguel and colleagues’ climate measures included average annual change in rainfall for all 41 sub-Saharan African countries during the years 1981 – 1999 when civil war was frequent. Miguel’s group found that severe rainfall shortages acted like an “economic shock,” that is, an outside event not explained by economic forces that has a strong economic effect. An example of economic shock familiar to Americans is the Yom Kippur war that led to the first 1970s oil price spike, which plunged the nation into a recession with both high inflation and weak economic growth, or “stagflation.” Miguel found that drought can have a more serious effect on agriculturally dependent economies than oil prices have on petroleum dependent ones. He showed that a 5 percent drop in rainfall in one year increased the likelihood of civil war in the following year by 12 percent. Civil war was strongly related to a failing economy. Nothing new here. But Miguel had also shown that too little rainfall, by causing crops to wither and GDP to shrink, increased the likelihood of civil war.
Even though Miguel’s group had used rainfall as a substitute variable for GDP growth for econometric reasons, they had inadvertently shown that a climate phenomenon, rainfall, is related to civil war. It was this result that was the surprise and amounted to something like heresy in the world of peace and conflict studies: Change in the natural environment, such as variation in temperature or rainfall, had never been shown in any previous quantitative research to affect civil conflict. In academic circles, there is a residual distrust of anyone postulating a relationship between climate and human behavior because of the “climate determinism” espoused in the early Twentieth Century by academics such as Ellsworth Huntington who in 1915 wrote in his book Climate and Civilization:
“We know that the denizens of the torrid zone are slow and backward, and almost universally agree that this is connected with the damp steady heat.”
Few if anyone makes statements like this today, but there remains a wariness among some scholars that this kind of thinking might arise again. Huntington was using climate to explain differences between entire peoples and societies. Present-day climate-conflict researchers have a much narrower focus, for example investigating the effect of climate on specific events, such as any form of civil conflict, that is, riots, rebellions, or civil war, and use measures repeated over successive years, or panel data, to compare the same country at different points in time. What needs to be guarded against today is the axiomatically made assertion that climate change has already caused civil war and will lead to more such wars. These claims are made in books, in the press, by think tank policy analysts, and even by political leaders such as Barak Obama. In the past there was little empirical support for the climate-civil war connection. Is there now better evidence for these claims?
Miguel’s tables show that his results were “robust,” that is, they held up when the outcome measure was changed from minor to major civil wars, and when countries were dropped out of the data set one at a time to check for highly influential cases, or outliers. Miguel used variables called “fixed effects” in many of his models to control for differences among countries, and time trends to control for time-related change such as income or commodity prices. As will be explained below, fixed effects and country time trends are controversial and can dramatically alter the outcome of a study depending on how they are used.
After Miguel’s paper inadvertently broke with the traditional view that climate could not affect large-scale human conflict, he joined with another member of the Berkeley group, Marshall Burke, and with three other colleagues published a paper in 2009 to further investigate the climate-civil war relationship. The paper appeared in the prestigious Proceedings of the National Academy of Sciences (PNAS). Burke and Miguel looked at the effect of growing-season temperature rather than rainfall as Miguel and colleagues had done because as the planet warms, future change in temperature can be better modeled than change in precipitation. They initially gathered climate data at a more local level than Miguel, but aggregated these data up to the national level. The sample was of major civil wars in sub-Saharan African countries between 1981 and 2002. They studied ongoing civil wars, not civil war onset, and used country and time fixed effects to the exclusion of other measures in their preferred models.
Running the results of their study in many models of future climate change, Burke and Miguel found that increased growing-season temperature had a strong impact on the projected risk of future civil war, raising its likelihood by 5.9 percent. Because civil war occurred in 11 percent of the country-years sampled, an increase of 5.9 percent would be a 54 percent increase in the number of country years with active civil war. Assuming that civil wars remain as deadly as they were in the 1981-2002 study period and that temperature increases linearly in the future, this works out to an additional 393,000 cumulative battle deaths from 2010 through 2030. But in any civil conflict, deaths of noncombatants always exceed the number of soldiers killed, meaning that the cumulative additional death toll would be far higher than just the battle deaths, already a large number.
These results were too much for Halvard Buhaug, a political scientist and research professor at PRIO, the Peace Research Institute in Oslo. In 2010, Buhaug replied with a PNAS paper of his own that faulted the Burke and Miguel paper on a number of counts. Buhaug argued that defining civil war with 1,000 battle deaths excluded many lower level conflicts such as those most commonly occurring in the Sahel countries, Chad, Niger, Mali, and Senegal. The higher fatality criterion would leave out years when the number of battle deaths dropped below the 1,000 mark, leading to a “skipping” of years in the same civil conflict. As Buhaug told the BBC, "If a conflict lasts for 10 years, but in only 3 of them the death toll exceeds 1,000, [Burke and Miguel] may code it as three different wars." Most importantly, Burke and Miguel may have selectively chosen the time frame because, counter to their hypothesis, as seen in Figure 1, the annual frequency of sub-Saharan African civil wars fell after 2002 while temperatures continued to rise.
Figure 1
Trends in Sub-Saharan African Civil Wars and Mean Annual Continental Temperature

http://www.nber.org/papers/w16440
Buhaug repeated Burke and Miguel’s analyses just as they had done them, with the same data on wars having 1,000 or more deaths, and with both country and time fixed effects. Not surprisingly and perhaps reassuringly, he obtained the same results. But Buhaug then ran more alternative models to assess the “robustness” of Burke and Miguel’s findings to changes in a number of model specifications. His preferred models differed from Burke and Miguel’s by having 25 rather than 1,000 battle deaths, using civil war outbreak rather than ongoing conflict , and by substituting social and political measures for country and time fixed effects. Buhaug failed to replicate Burke and Miguel’s results for the climate measures in any of his alternative models. Buhaug did, however, find that his own social and political measures predicted civil war outbreak, with civil wars more likely to start where ethnic groups were excluded from political participation; where lagged per capita income was lower; in countries with a previous history of conflict; and after the end of the Cold War in 1990.
With the publication of Buhaug’s paper and an academic dispute in full swing, the press took note, with articles appearing in Time magazine, on the BBC, in Nature (here and here) and elsewhere. These articles tended to side with Buhaug, noting the problem of defining civil war and the difficulty of doing rigorous analysis in a research area where a clear climate signal is hard to detect amid “noisy” data, that is, with lots of error, especially in the outcome measures.
Buhaug told the BBC that his disagreement with Burke and Miguel was “not a misunderstanding as such, more a case of the research still being in its infancy - we still don't know enough yet." With only two papers finding that climate increases the risk of civil war, Buhaug’s comment is sensible, but perhaps Burke and Miguel had brought new methodology into the field, giving it a needed jolt. Burke told Nature, “there are legitimate disagreements about which data to use, [but] basically we think [Halvard] has made some serious econometric mistakes that undermine his results. He does not do a credible job of controlling for other things beyond climate that might be going on." Note the term, “controlling.” Buhaug had not used fixed effects in his preferred models.
Just what are these “fixed effects” that keep popping up and seem to be so contentious? Fixed effects are indicator variables assigned to each country in a data set to be analyzed. Simplifying somewhat, an indicator variable is just that; it has a value of “1” for the country it signifies and a value of “0” for all other countries. This doesn’t sound like much, but fixed effects variables can be of great importance; they play a big role in the climate-violence controversy, making it possible to show that climate factors taken alone may increase the risk of civil war. If research were to show that a climate factor by itself, such as drought, can trigger civil war, we could predict that where there is drought, it is more likely there will be civil war. This is a main effect of climate on civil war, that is, climate in the form of increased temperature or decreased rainfall by themselves causing civil war. But this may be too simple. Perhaps heat or drought only trigger civil war depending on some other factor. This is an interaction effect. An example of a climate interaction effect would be drought triggering civil war depending on whether a country is more or less democratic. More democratic countries may avoid civil war because they have channels for airing grievances and institutions for dealing with environmental emergencies such as drought. Less democratic countries may have no such channels or institutions.
Fixed effects are also used to control for long-term trends that increase over time and are related to civil war, such as rising income or greater international assistance, peacekeepers for example. Time-trend fixed effects increment with each year of the study (2000=1, 2001=2, etc., if the time frame is 2000-2010). Time-trend fixed effects have problems similar to country fixed effects, but there are methods of controlling for time that don’t obscure other effects in the data.
Burke and Miguel argue in a working paper that fixed effects are required because “the analyst might not have good data on – or even be aware of – all of the different confounding variables that affect conflict and are correlated with climate.” They are trying to avoid what econometricians refer to as “excluded variable bias.” That is, the results might be affected by measures that are not included in the model. But when you use fixed effects to control for all unknown differences, you also remove those differences that you are aware of, for example, the social and political measures Buhaug found related to civil war.
What really gets excluded when the Berkeley group uses fixed effects, is the more nuanced finding that climate interacts with the many other differences that exist between countries and within countries. Researchers of different background take opposing views on this. Burke and Miguel are economists using standard econometric methods. But these methods, in an attempt to avoid all potential biases, remove from their climate analyses all the measures that political scientists such as Buhaug deem important. If we know that other measures, such as political rights, are necessary for a full understanding of events like civil war, would we forego using them in our analyses and restrict ourselves to the use of fixed effects to control for possible omitted factors that might influence the outcome of our analyses? The answer to this important question may get down to who taught your graduate school statistics courses. James Hodges, a University of Minnesota biostastician, said model selection, “is a messy business, which seems to be determined in practice less by facts than by the department in which one was trained.” This appears to be the case here, with the departments being economics (the Berkeley group) and political science (Halvard Buhaug).
John O’Loughlin, a University of Colorado, Boulder Geography professor, and colleagues maintain that fixed effects are not compatible with the high resolution data now favored by most climate-conflict researchers and the more detailed story such data enables researchers to tell. The country-year data used in fixed effects analyses are at a coarse level of spatial and temporal resolution that leaves out differences within countries, which are seen as increasingly important because it is highly unlikely that economic, political, and climatic events are uniform across countries as large as Sudan or Mali. These events may also change quickly over time. Most importantly, civil wars tend to be concentrated in specific regions within countries as exemplified by the conflict in eastern Congo.
Fixed effects need not necessarily be used to the exclusion of all other variables. The purpose of fixed effects is to control for unknown influences that are left out of our models, yet previous research has shown that there are many political, social, and geographic measures that are related to and predict civil war. What we really want to know is what climate measures might add to our present knowledge about the causes and prediction of civil war. If we include our measures of interest, there is no reason why we cannot also use fixed effects to control for possible omitted variables that might confound the analysis. To a large extent, the argument over fixed effects is about how to use them, not whether to use them, a subtle but important difference.
Now that we know something about fixed effects, let’s return to the climate-conflict debate. Burke and Miguel address Buhaug’s claim that they selectively chose the data in the technical notes to their 2009 paper, explaining that they chose the 1981-2002 study period because before 1981, the newly independent African countries were much less stable; and after 2002, data were unavailable from the Climate Research Unit of East Anglia University in the UK, their source of climate information. In their working paper reply to Buhaug’s 2010 critique, Burke and Miguel say, “At the same time, we find with Buhaug that African conflict appears less sensitive to climate over the past decade, a change likely related to the unprecedented economic growth and democratization that most of the continent has recently experienced.” More telling, they repeated their analysis for just the years 2003-2008 with both country and time fixed effects and, as one might expect from an examination of Figure 1, obtained nonsignificant results, that is, there were no statistically significant climate effects. Had Burke and Miguel included data through 2008 rather than through just 2002 in their original study, it is unlikely they would have obtained significant, and therefore publishable, results.
Bear in mind that no one thinks that climate is the sole cause of civil war. All researchers, the Berkeley group included, agree that there are many other factors—social, political, economic, and historical—involved in civil war. Even if one uses country and time fixed effects, it doesn’t mean there are no other social and political factors at play, only that they have been excluded, or controlled out, of the analysis. It should be born in mind, too, that there is consensus in the peace and conflict literature that stable developed societies are far more resilient to climate shocks than developing ones.
Buhaug was not done yet. Later in 2010, he published a counter-reply to Burke and Miguel in PNAS that made a number of cogent points, one being that temperature had increased across Africa for the past 30 years, but during those years, the number of civil wars regardless of size declined, especially in the most recent 15 years. This is basically Pinker’s argument and is apparent in Figure 1. Buhaug further noted that the annual civil war-related fatality count had declined nearly 75 percent from 6,100 in the decade of the 1980s to 1,600 in the first decade of the 2000s.
Buhaug then made a point about fixed effects: “First, they [Burke and Miguel] claim that models that fail to include both country-fixed effects and time trends suffer from severe omitted variable bias. Their suggested approach, however, is at odds with virtually all quantitative work on civil war, and if this critique were valid, it would render the civil war literature largely worthless.” By this Buhaug means that if political scientists adhered to the canons of econometric analysis, meaning the exclusive use of fixed effects in most or all analyses, none of the measures political scientists include in their models of civil conflict could be used. In effect, quantitative political science research on civil war, as currently practiced, would be obsolete.
In one sense, it doesn’t matter if Burke and Miguel’s 2009 study is right or wrong. If they agree with Buhaug that by extending their data panel to include years after 2002, when the number of civil wars dropped as temperatures continued to rise, their climate effect becomes an artifact of their short data panel. Something like this must be the definition of a tempest in a teapot. Why all the fuss in the press over a non-finding? Up to this point, shouldn’t Burke and Miguel be cited for disturbing the peace?
Civil War Round II
The 2013 meta-analysis of interpersonal violence by the Berkeley group discussed earlier included a second meta-analysis of intergroup violence, or civil “conflict,” which was in fact the heart of the paper. Recall that a meta-analysis obtains a weighted average of all methodologically sound studies drawn from the literature. Counting both the studies of interpersonal and intergroup violence, the Berkeley group’s two meta-analyses included the work of 190 researchers world wide, on 60 studies, using 45 data sets, by far the most exhaustive survey of the literature to date. Most studies were recent with a median publication date of 2011. Earlier, we noted the 2.3 percent median increase in interpersonal violence for each one SD temperature increase above seasonal normal. The analogous finding for intergroup violence was a 13.2 percent increase in the risk of civil “conflict” for each one SD increase in temperature above the seasonal norm, a substantial effect. The need for the quotes around “conflict” will become clear below.
Once again, Buhaug felt challenged to dispute a claim that climate has political and social effects. He recruited 25 co-authors, mostly European, to back up his reply to the Berkeley group’s meta-analysis of civil conflict, letting the meta-analysis of interpersonal violence stand. The large number of co-authors was to show that whatever the outcome of the methodological arguments, the mainstream view among peace and conflict researchers is that climate and civil war are unrelated.
Buhaug’s criticism of the Berkeley group’s meta-analysis rested mainly on their inclusion of a heterogeneous set of studies, that is, papers that studied a range of climate conditions (floods, drought, excessive temperature), a range of conflict events (civil war, riots, “institutional change”), and a range of spatial scales (from cities to nation states) rather than doing separate analyses for each type of climate, conflict, and event scale. Also, there was overlap in the data used in the different studies, particularly in Africa where several studies were done using similar samples of countries, conflict data, and time periods. Buhaug claimed that this violated the assumption of independence all statistical procedures are based on. Finally, Buhaug asserted that the Berkeley group had sampled an unrepresentative set of studies by selecting only those that supported their hypothesis. Using the computer code and data that the Berkeley group made publically available, Buhaug ran models that tested these points and was unable to replicate the Berkeley group’s results, allowing him to reject their conclusions and assert that, “We believe an important reason for the notable discrepancy in views between Hsiang and Burke and the larger scholarly community can be traced back to problems related to the accompanying meta-analysis.”
In a reply paper, the Berkeley group disproved each of Buhaug’s points. They tested Buhaug’s independence assumption by permitting a high degree of relationship among each of the study data samples, and still found significant results. The group addressed Buhaug’s claim that their sample of studies was unrepresentative by doing a “’stress test’” showing that it would take at least 80 unfavorable studies to wash out the significance of their obtained effect size (13.2 percent increased civil war risk). This means that their published results were almost certainly valid. The Berkeley group’s review of how Buhaug conducted his re-analyses showed that in the models Buhaug ran, he made a number of mistakes. They stated, “We conclude that the issues raised by Buhaug do not alter the conclusions of the meta-analysis … and the disagreement in findings are [sic] not explained by a difference of opinion regarding statistical methods.” This was a resounding rejection of Buhaug’s critique and was the last published exchange between Buhaug and the Berkeley group.
But there were problems with the Berkeley group’s meta-analysis. As Buhaug noted, the Berkeley group had expanded their definition of civil conflict from the specific focus on civil war in the two papers that set the stage for their meta-analysis, Miguel’s 2004 paper and the Burke-Miguel 2009 paper. For the meta-analysis, “civil conflict” included riots, land “invasions” in Brazil, removal of leaders from office, and coups d’état in Africa. Clearly, this is a much broader definition of conflict than the single event class, civil war. More importantly, civil wars are generally longer lasting, more destructive, and have higher fatality counts than these other forms of civil conflict. The group’s analysis method may permit analyzing their new “heterogeneous” outcome measure, but the debate was about civil war. Buhaug says that the discrepancy between the Berkeley group and the community of 26 scholars he speaks for can “be traced to the meta-analysis.” But the discrepancy is more likely due to the Berkeley group’s use of country-year fixed effects while excluding all other measures except climate. It is puzzling that Buhaug said nothing about this because one of his 26 co-authors, John O’Loughlin, has made the use of fixed effects central to his critique of the Berkeley group’s work. To get the effect sizes for their meta-analysis, one from each study, the group ran the raw data from each study through their own analysis model that of course used fixed effects to the exclusion of all other measures. Few of the original study authors had used this approach, which is why they failed to obtain the climate effects that the Berkeley group found. Are the two sets of results, the Berkeley group’s and the original authors’, alternative facts?
As noted earlier, O’Loughlin and colleagues rejected the use of fixed effects because they are not suited to the high resolution data now used by climate-conflict researchers. Why do a clumsy country-year analysis when you can use better data that allows a more “nuanced” analysis? To see what this can mean, let’s compare how O’Loughlin did his analysis of fine-grained data with how the Berkeley group re-analyzed the same data for their meta-analysis. O’Loughlin used ACLED data, or Armed Conflict Location and Event Data, a PRIO database that maps the physical location of each conflict and uses a broader definition of conflict than other PRIO databases, more like that used in the Berkeley group’s meta-analysis. The data were for 1 degree latitude by longitude grided squares in nine East African countries over the years, 1990-2009. Along with social, political, geographic, and climate measures, they included country and year fixed effects in all their models to control for omitted variables as discussed above. O’Loughlin found that extremely wet years actually reduced violence among herders because the greater availability of water allowed opposing groups to disperse. Extremely hot years caused greater violence among farmers by reducing crop yields. This is an example of an interaction of climate with livelihood, extremely wet years reducing violence among herders; extremely hot years increasing violence among farmers. Each climate variable had a different effect on violence depending on livelihood, herding or farming. Cool and dry, but not extremely dry, years had no effect on conflict for any group.
What did the Berkeley group find with the same data? They found a thirty percent increase in violence with a 1 SD change in temperature above the seasonal average, the sixth largest climate effect among the ten temperature studies in their meta-analysis. Of course, no group-specific effects were found. They were buried in the country fixed effects. Worse, the likelihood of civil war applies to the entire country rather than to a specific region or subgroup as in the O’Loughlin analysis.
Buhaug and colleagues also addressed the climate-conflict issue with new research using high resolution data from conflicts in both Africa and Asia. Like O’Loughlin, Buhaug found that drought by itself was a modest factor in either initiating or sustaining civil conflict. But drought is important to sustaining conflict among the poorest groups that are also dependent on agriculture and excluded politically. There are climate effects, but they are found only in the context of specific social and political conditions. In supplementary analyses, Buhaug found that his models were “robust,” that is, unchanged by the addition of fixed effects to their models .
Conclusion
What do we conclude about the relationship between climate and violence? There is little argument about temperature and interpersonal violence. Everyday experience, newspaper headlines, and empirical studies all strongly indicate that climate, especially higher temperatures, can trigger violent behavior among individuals. What about civil war? If using the broader definition of civil war that includes all civic violence, that is, riots, coups d’état, land grabs, etc., is it possible the Berkeley group’s meta-analysis shows that climate indeed causes civil conflict? After all, isn’t it the larger issue of climate’s effect on civic violence in general and not just on civil war that really counts? What makes this problematic is the Berkeley group’s exclusive use of fixed effects to determine the effect sizes for the meta-analysis of intergroup violence. The differing results in the analysis of O’Loughlin’s data when analyzed using social, political, and geographic measures compared with the Berkeley group’s analysis based solely on fixed effects suggests that we can’t know through the meta-analysis what the effect of climate is on the broader issue of civic violence in general.
Using a narrow definition of intergroup violence, meaning solely the event class of civil war, what do we make of the dispute between Buhaug and the Berkeley group? We gave the first round to Buhaug, based on more recent trends in African climate and civil war. The Burke-Miguel analysis of the later African data, from 2003 through 2008, was in agreement with Buhaug’s contention that they had, inadvertently, selectively chosen the time frame of the data. As noted, Burke and Miguel found no climate effects in the 2003-2008 time series despite exclusive use of country-year fixed effects, an analysis method that we’ve seen is biased toward finding climate effects
To more convincingly settle the issue of civil war narrowly defined, we can compare the intergroup meta-analysis with readily available plots similar to Figure 1, which shows temperature and annual civil war frequency in sub-Saharan Africa diverging after 2000. The first of these plots appears in Figure 2, which shows all civil wars globally between 1946 and 2013 based on PRIO data. (Pinker has a similar plot in a Slate article.) The plot clearly indicates that civil wars peaked about 1990, the year the cold war ended, and declined thereafter. Figure 3 shows that mean annual global surface temperature has risen steadily since about 1910, except for a rough plateau between 1940 and 1980.
Figure 2
Global Share of UN member Countries With Intrastate
Armed Conflict (Civil War), 1946-2013

Sources: Gleditsch et al. (2002) and http://www.un.org/en/members/.
Figure 3
Global Mean Annual Temperature 1880-2014

If the number of civil wars has been declining globally since 1990, how can the Berkeley group claim that the frequency of civil war and temperature rise together? For the period from 1946 through 1980, civil wars increased while mean global temperature was mostly flat. For one decade, the 1980s, both civil wars and temperature increased, but that has not been the case for the last 25 years: The plots show clear divergence after 1990, temperature rising and civil war falling. O’Loughlin and Buhaug have shown that rather than the large effect that the Berkeley group attributes to it, climate has modest influence that works through political and social phenomena such as agricultural dependency and political exclusion. We can say that climate has political and social effects but we have to be careful about how we say it. This finding largely supports Pinker’s view that climate change does not pose an immediate threat to the New Peace, and the world will remain relatively free of violence.
What we want from climate-conflict research is a prediction: Will the frequency of civil war increase as the world inevitably warms in the future? To a great extent, this depends on whether climate influences civil war as a main or as an interaction effect. If climate has a main effect on civil war, we would predict civil war frequency to increase as climate warms. But if climate influences civil war through existing conditions and institutions that differ among nations, there is a greater chance that growth in the frequency of civil war can be held in check by social and political means. This assumes that we are smart enough to learn what works to avoid civic violence and that nations at risk are willing to adopt strategies shown to be effective elsewhere. Ultimately, of course, there are limits to the effectiveness of adaptive measures and the world must take steps to reduce atmospheric carbon dioxide and other greenhouse gases.
If we want a current example of a country that slipped into civil war in part because of climate, Syria is surely it. Syria experienced a severe six-year drought from 2006 through 2011. Two climatologists using different modeling approaches, Colin Kelly and Martin Hoerling and their colleagues, found it likely that complex factors brought on in part by climate change made the drought so long and devastating. In the view of Francesca de Chatel, a specialist on Middle Eastern water issues who lived in Syria for the first five years of the drought, the Syrian civil war began after the Assad regime cracked down on Arab Spring protests against “growing poverty, corruption, rising unemployment, the complete absence of political freedom, and the affects [sic] of a severe drought.” It was not the drought itself, but the failure of the Assad regime to provide humanitarian relief for the deprivation caused by the drought in the context of widespread discontent that caused the civil war. In societies where social, economic, and political conditions have already put the entire population or a subgroup at risk, the spark that ignites revolt can be heat or drought.
0 notes
Text
Climate Cycles, Climate Change, and the Syrian Civil War
Climate change gets blamed for a lot of bad things: droughts, floods, hurricanes, disease, species extinction. Should we add civil war to the list? This question has been the focus of spirited debate among a small group of behavioral scientists in the field of peace and conflict studies. The work of three economists, Solomon Hsiang, Marshall Burke, and Edward Miguel at University of California, Berkeley, suggests that climate change alone, high temperatures or drought, can plunge countries into civil war.
Most peace and conflict researchers initially rejected out of hand the Berkeley group’s findings. But there is a growing number of researchers who occupy a middle ground on the issue with recent research showing that whether or not climate-change triggers civil war depends on the social and political facts on the ground. Halvard Buhaug, a political scientist at Peace Research Institute Oslo, and colleagues found that climate can trigger civil war when growing season drought affects subgroups in poor nations that are either agriculturally dependent or politically excluded. John O’Loughlin, a geographer at University of Colorado, Boulder, and colleagues also found that climate is most likely to play a role in civil war only in countries where farming is the main livelihood and there are few political rights. These findings mean that the same drought that has little effect on a politically open, economically more developed country may set off a chain of events leading to civil war in a nearby country this is poor, has few political rights, and a sector of agriculturally dependent farmers.
David Zhang, a geographer at the University of Hong Kong, and colleagues showed that the North Atlantic Oscillation (NAO) climate cycle was related to wars in Europe, both civil and between nations, during the years 1400 to 1995. Richard Tol, an economist at the Economic and Social Research Institute, Dublin, and Sebastian Wagner, a geographer at the Institute for Coastal Research in Geesthacht, Germany, found that since the early 1800s industrialization has made the nation states of Europe gradually more resilient to the vagaries of the NAO’s cycles, so that there has been little or no violence related to the NAO among developed European nations after 2000. But the non-industrialized nations of the southern and eastern Mediterranean Basin may still be affected by the NAO and climate change if they fit the profile of poverty, agricultural dependence, and political exclusion associated with violent civil conflict, a profile that includes many developing nations globally. Syria, whose civil war is by far the largest and deadliest this century with 400,000 people killed, might be an example of climate, poverty, and political exclusion combining to ignite civil war.
Based on his study of ancient climate and civil war, Zhang proposed a model for how climate change may cause violent conflict including civil war. Simplifying: climate change reduces crop production resulting in food scarcity; the populace demands food and other assistance from the government; government cannot or will not provide help; the populace revolts; civil war ensues. This is exactly what happened in Syria from 2006, when the drought began, through early 2011, when the civil war commenced.
Civil war in one country can have a destabilizing effect on neighboring countries when people migrate in search of food potentially sparking a cross-border war. Some 7.6 million Syrians have been internally displaced and 4.8 million Syrians have fled the country. War between nations has not broken out, but the large number of refugees places a potentially destabilizing burden on Syria’s neighboring countries: Turkey, Lebanon, Jordan, and even far away Western Europe, where the European Union member states are divided over refugee policy and right wing parties have flourished because of the ongoing migrant crisis.
Before presenting an account of the role climate may have played in starting the Syrian civil war, a review of nomenclature might be helpful. The phrase ”climate change” refers to “global warming,” which is what climatologists call “external radiative forcing” or the imbalance between energy absorbed by earth from the sun and energy that is radiated back into space. The term “forcing” in this context means to exert influence or to have an effect.
When the imbalance favors energy absorption over out-bound radiation, the atmosphere warms, like a greenhouse, thus the phrase “greenhouse gas forcing.” Other terms are often used to refer to the effects on climate of fossil-fuel burning or the CO2 effluent it emits: the greenhouse effect; human-induced climate change, etc.
Syrian drought
Syria has an annual weather cycle much like California: a classic Mediterranean climate of mild winters with occasional rain and warm dry summers. Over the last century, from 1900 to 2005, Syria experienced five droughts that lasted a single wet season, and a sixth drought that lasted two wet seasons. But starting in 2006, Syria had a six-year drought that persisted through 2011 and was the most severe since 1902 when record keeping began.
One can see in Figure 1 that after 1970, the years with below normal precipitation (red bars) begin to outnumber the years with above normal precipitation (green bars) and the trend line in black mostly remains below the long-term average. The Mediterranean region has experienced 10 of its 12 driest years on record since 1993.
Figure 1

Observed time series of Mediterranean cold season (November–April) precipitation for the period 1902–2010. The solid black line is smoothed precipitation. Years are shown on the X-axis; precipitation above or below the long-term average is shown on the Y-axis.
http://www.noaanews.noaa.gov/stories2011/images/hoerlingetalfig1a.jpg
In a 2010 paper, Martin Hoerling and colleagues at the Earth Systems Laboratory in Boulder, Colorado noted that half the land area in the Mediterranean Basin was used for agriculture, which consumes 60 to 80 percent of available water. This means that continued precipitation at the historical average is critical for food security. But if the trend toward drier winters continues, how will food be grown? More basically, why has the rain stopped?
Atmospheric cycles
There are three cycles that influence weather in the North Atlantic Basin, but we are interested only in the North Atlantic Oscillation (NAO), which strongly affects winter temperature and precipitation patterns over all of Europe and the Mediterranean. Just knowing this, one can sense that the NAO has enormous influence over the success or failure of agriculture in this region, which is home to well over a half billion people.
Unlike the El Nino-Southern Oscillation, which involves the influence of ocean currents on the atmosphere, the NAO is a completely atmospheric phenomenon. It involves an area of low pressure, the Icelandic Low, and an area of high pressure, the Azores High. The NAO has two phases, named the positive (NAO+) and negative (NAO-) phases.
The positive phase occurs when both the Icelandic Low and Azores High are stronger than normal. This means there is lower than normal pressure near Iceland and higher than normal pressure over the Azores. Because the high-pressure cell over the Azores rotates clockwise and the low-pressure cell over Iceland rotates counter-clockwise, the two pressure systems mesh like gears and storms are ushered directly across the North Atlantic. This results in mild, wetter winters in Europe and mild, drier winters in the Mediterranean Basin.
The negative phase occurs when both the Icelandic Low and Azores High are weaker than normal, which blocks storms crossing the North Atlantic. This results in cold, drier European winters, because Arctic air invades from the north, and mild wetter Mediterranean winters, because storms are diverted south. Figure 2 shows how the varying configurations of the two pressure cells, the Icelandic Low and Azores High, affect the storm track, precipitation, and temperature for the positive and negative phases of the NAO.
Figure 2
Positive and Negative NAO

http://apollo.lsc.vsc.edu/classes/met130/notes/chapter10/nao.html
After 1970, when winters became drier in the Mediterranean Basin, Northern Europe became wetter as shown in Figure 3. One explanation for the six-year Syrian drought might be that the NAO became “stuck” in its positive phase, something that might happen by chance, like getting heads in six consecutive flips of a coin. Assuming that the positive phase occurs a random 50 percent of the time, six consecutive positive NAO winters has only a 1.6 percent chance of occurring (.5 raised to the sixth power). Is it more likely that the Syrian drought, and the civil war that followed it, resulted from climate change due to human activity, such as burning fossil fuels? Climate modeling can help answer this question.
Figure 3
Change in Mediterranean Rainfall Pattern from 1970 to 2010

Observed change in cold season (November-April) precipitation for the period 1971–2010. Dark red means more than 60 millimeters reduced average precipitation from the long-term average, years 1902-2010, for each year in the forty-year period, 1971–2010.
http://www.noaanews.noaa.gov/stories2011/images/hoerlingetalfig1b.jpg
Climate models, climate change, and civil war
Colin Kelley and colleagues at the University of California, Santa Barbara ran a series of models to estimate the effect of climate change on the Syrian drought. A model that included greenhouse forcing fit better than a model that included only natural variation. In climate modeling terms, this means the signal implicating global warming is loud and clear against the background noise of normal climate variability.
Using only data from Syria, Kelley showed that in each of the driest years after 1901 and in all of the 46 years since 1970, there was an anomalous high pressure cell frequently positioned astride the Eastern Mediterranean. The circulation associated with this high-pressure cell blocked moisture-bearing winds from the west and set up a northerly flow of dry air from the interior of western Asia. Kelley’s group concluded that human-induced climate change was a major factor in creating the drought and therefore also a factor in Syria’s civil war.
Hoerling and colleagues used global Sea Surface Temperature (SST) data to find a model that would best account for the warming and drying of the entire Mediterranean Basin seen in Figure 3 above. Testing several different SST patterns, they arrived at a model that included uniform warming by 0.5 C of earth’s tropical oceans plus warming by 1.0 C of the Indian Ocean, also tropical. This model replicated the pattern of warming seen in Figure 3. Based on these results, Hoerling concluded that greater SST warming in the tropical and Indian Oceans was responsible for about half the Mediterranean drying, the other half being due to natural variation, probably involving the positive NAO.
They may differ in their modeling approaches and in the details of their results, but Kelley and Hoerling both reached the same conclusion: The Syrian drought would not have occurred or would not have been as severe without climate change due to fossil-fuel burning.
Other factors leading to civil war
The Syrian civil war is no exception to the rule that all wars have multiple causes. In Syria’s case, these causal factors included refugees from Iraq, long-simmering resentments against a dictatorial state, and agricultural policies under the ruling Assad family. Foremost among these were mismanagement of Syria’s water and farmland resources, beginning with the current dictator’s father Hafez al-Assad, who ruled Syria from 1971 to 2000.
Despite scarce water resources and frequent droughts, the elder Assad initiated policies to increase food security and his popularity among rural subjects. These policies included distributing land, building irrigation projects, and providing diesel fuel subsidies that enabled groundwater pumping to become widespread. Syria achieved agricultural self-sufficiency in 1995, but at the price of water insecurity.
Bashar, Hafez al-Assad’s son, took power in 2000 and adopted unsustainable policies that led inevitably, given the Assads’ excesses, to the decline of Syria’s agricultural sector. Overpumping of groundwater reached epic proportions— the number of wells increasing from 135,000 in 1999 to more than 213,000 in 2007, severely depleting aquifers.
Syria uses 160 percent of its available water, while Turkey uses 20 percent and Iraq, which is mostly desert, uses 80 percent. To use this much water, Syria must devote all of its precipitation plus a large volume of groundwater to supply its needs. Much water is wasted with furrow-flooding irrigation.
Growing water-intensive crops such as cotton and depleting aquifers made the country vulnerable to drought. Huge losses in livestock, up to 85 percent in northeast Syria, impoverished farm families in the country’s agricultural heartland. The livestock losses were matched by massive crop failure in 2010, with over 75 percent of Syrian agriculture experiencing total crop failure.
With these losses, farm families were driven off their land. All told, some 1.5 million people migrated to the peripheries of cities to find food and employment. But they were not the only ones in search of these essentials.
After the U.S. invasion of Iraq in 2003, as many as 1.5 million Iraqi refugees fled to Syria, settling in the outlying areas of Syria’s cities. With food production dropping and refugee populations soaring in the cities, Syria’s urban population exploded from 8.9 million in 2002 to 13.8 million in 2010, an increase of more than 50 percent. Such rapid population growth, whatever its cause, can be destabilizing.
With these drought-related problems in the background and the cities swelling with rural and Iraqi refugees, government security forces cracked down on pro-democracy demonstrators in the city of Deraa in March of 2011. Unrest escalated until all-out civil war erupted as government forces fought rebel brigades and anti-government demonstrations swept the country demanding Bashar Assad’s resignation.
Improving sustainability in a desiccating world
What can Syrians do if, as Kelley warns, long droughts become more common in a warming world? One simple and obvious measure would be to stop the wasteful practice of flood irrigation and replace it with more efficient drip and sprinkler irrigation — although these methods are more costly. Another measure would be to stop growing water-intensive crops such as cotton and stop growing crops for export if it means any Syrian will go hungry. Syria still exports some lamb, olives, and other crops, but it now imports much of its wheat.
As with wheat, Syria will have to make up for other drought-induced food shortages with imports. In an email interview, Peter Gleick, President Emeritus of the Pacific Institute in Oakland, California and a noted authority on water, stated that “Syria will have to enter the international market in food to make up for shortfalls in domestic production due to insufficient water. But this requires a working economy, something Syria obviously does not have due to nearly a decade of crippling war.” To re-establish such an economy will require a huge postwar rebuilding effort of many-years duration and will also require making goods or offering services to sell that other countries will want to buy in exchange for food.
Gleick noted that to deal with its dwindling water resources as rainfall decreases and aquifers are depleted, “Syria will have no choice but to bring its [water] use into line with its resources. This means adoption of conservation strategies and more careful use of the water Syria does have. It is possible that Syria’s agricultural production will be more limited in the future.”
Regional issues
Although Syria is currently fighting a civil war, the war could become regional, especially as refugees continue to flee the country. Since the fall of 2016, a bewildering array of parties has become involved, Russia, Turkey, the Kurds, Iran, and the U.S. each in various alliances with each other and with Arab groups either for or against the Assad regime, and each with differing motivations for fighting. One complication is Turkey’s control of the Tigris and Euphrates Rivers; Turkey reduces the flow of the Euphrates River by 80 percent and of the Tigris River by 40 percent through dams and diversions for the Southern Anatolian Project
Syria depends heavily on these rivers, as does Iraq. Gleick noted, “The failure to negotiate and sign a comprehensive agreement on the Tigris and Euphrates rivers is a great impediment to peace in the region.” I would add that quite likely Turkey’s failure to negotiate is because Turkey has control of the upper reaches of both rivers and is unwilling to compromise its strategic advantage.
Asked about the likelihood of war between Syria and Turkey over these two rivers, Gleick noted the “internal violence already taking place related to water,” chief among them Syria’s civil war. A destabilizing conflict like civil war makes cross-border war more likely. The large number of outside parties in the civil war makes continuation of the conflict more likely. Civil wars often end because one or both sides becomes exhausted. This is less likely when foreign countries become involved because the foreign country populations don’t experience suffering and destruction and thus have less reason to stop fighting than the people in the country where the civil-war is actually taking place.
Domestic policy
Another necessary step to solve Syria’s drought-related problems would be greater efforts to bring down the fertility rate to sustainable levels, especially in rural areas. “It is certainly true that rapidly rising populations make many of these resource problems much harder to solve,” Gleick noted. “Many countries have reduced population growth rates successfully, and I expect much of the Middle East will as well.” One hopeful sign is that 58.3 percent of Syrian women were using contraceptives as of 2006, about the global average.
The most important step is to end the destructive policies of the central government. In order to attain agricultural self-sufficiency, both Hafez and Bashar al-Assad adopted disastrous land- and water-use policies. Instead of using basic resources to increase political power or reward friends who then employ wasteful practices, the government must adopt policies for the benefit of the governed. As Gleick put it, “The biggest problems are political, not resources.”
According to “Worldwide Governance Indicators,” Syria ranked in the bottom five percent on a survey of measures of accountability, freedom of expression, and public participation in government. This was in 2010, before the civil war began.
Francesca de Chatel, a specialist on Middle Eastern water issues who lived in Syria until 2010, wrote, “It was not the drought per se that helped start the civil war, it was the government’s failure to respond to the ‘humanitarian crisis’ caused by the drought that was one of the factors that triggered the uprising,” which then led to civil war. She stated further that “discontent” had been simmering in rural areas long before the drought and ensuing civil war. Higher temperatures, less rainfall and the subsequent drought, each due at least in part to climate change, combined with an autocratic regime that excluded its entire population from any political expression gave rise to Syria’s civil war, just as O’Loughlin and Buhaug found in their research. When they occur together, political exclusion and drought due to climate-change may predict where civil war will take place in the future.
Conclusion
Both the Kelley and Hoerling studies agree that the Syrian drought is partly due to human-induced climate change. Climate appears related to civil conflict, at least in Syria. Climate does not cause conflict, but it creates intolerable conditions for large numbers of people that are difficult for governments to remediate, setting the stage for conflict between the demands of the people and the failure of governments to meet them. Social unrest and civil war ensue. Syria became a case history for this process.
Given that other countries in the Greater Middle East (Libya, Iraq, Yemen) are in turmoil and the Mediterranean region will likely get both warmer and drier throughout this century, the entire region faces severe challenges. It seems likely that more Arab governments, nearly all authoritarian, will fail to meet these challenges — increasing the likelihood of more wars, both civil and cross-border. This might also be the future for parts of Africa, Central America, and South Asia
Can we find a ray of hope in this gloomy picture? Climate change is an “existential threat,” but one so distant it’s too abstract for people to take positive action. But it’s also a threat that has a straightforward solution: phase out fossil fuels and replace them with non-polluting energy sources, solar, wind, geothermal, and others. This will be difficult for two reasons: 1) currently existing technology and trillions of dollars of built infrastructure stands in the way of new technologies; and 2) there will be intense resistance from the fossil fuel industries and their allies in government.
But renewables do have advantages, including greater price stability even as prices gradually drop with improving technologies. For many renewables—wind, solar, geothermal, tidal—the fuel is free. The price of oil has risen steadily since 2014, making renewables even more attractive. Just as cell phones allow developing countries to leap frog the high infrastructure costs of land lines, developing countries are skipping fossil fuels and going directly to renewables. Of the $367 billion invested globally in renewables in 2015, more came from poor countries than rich ones; but overall investment in renewables dropped 18 percent in 2016.
There are other positive signs: This year, China plans to start the world’s largest carbon trading market. British Columbia has had a revenue-neutral carbon tax since 2008 and experienced greater economic growth than the rest of Canada since that year.
Despite these and many other examples of progress, the concentration of atmospheric carbon dioxide is now (March 6, 2017) at 406 parts per million (ppm) and is rising at an increasing rate (it was 403 ppm in March last year). James Hansen, a prominent climate scientist at Columbia University, notes that climate change is proceeding faster than all the models predict, including his own which are often the most pessimistic but now frequently underpredict sea-level rise. We are in a race with the laws of physics. Who wins is up to us.
1 note
·
View note
Text
The Molecular Toxicology of Acetochlcor and Click Chemistry: an Interview With Jessica
This interview was based on an in-class interview with Jessica, who is a doctoral student in molecular toxicology and is studying the effects of an herbicide, Acetochlor, on mice; and also uses “click chemistry” to study the structure and constituents of biomolecules.
As an herbicide, Acetochlor is used primarily on corn, but also soy and peanuts, and less often on other crops. The world divides into Acetachlor “targets,” which are unwanted plants--weeds--that compete with marketable crops farmers are growing. Any non-target organism, plant or animal, is referred to as an “off-target” organism.
Little is known about the long-term effects of Acetochlor on off-target organisms, such as human beings. We do know that Acetachlor preferentially binds to cysteine, one of the twenty amino acids that are the building blocks of proteins. A common experiment is to inject mice with Acetochlor and after four hours, add a molecular probe, which binds with reactive cysteine so that the effects of the Acetochlor may be studied.
Not all cysteines are reactive, but many are. The effect of large doses of Acetochlor is to render metabolic pathways nonfunctional if enough Acetochlor binds to reactive cysteine. Pathways may also become nonfunctional if the dose of Acetochlor is lower but there are more reactive cysteines.
Acetochlor has affinity for enzymes that are involved in fatty acid oxidation, the process by which animals metabolize fatty acids for energy when glucose is unavailable. Thus, the adverse effects of Acetochlor become apparent when animals rely on fatty acids for essential metabolic energy.
Click chemistry is a method for analyzing the composition of biomolecules and depends on the use of probes. Probe molecules have two active regions at opposing ends: 1) the warhead, which is the binding site of the probe; and 2) the alkyne, which is a nitrogen triple bond, N≡N.
If we bind rhodamine with a probe to a biomolecule of interest, we can learn about its composition by pulling it through a gel to which we apply an electric current. The current separates the components of the molecule on the basis of its weight as done in gel electrophoresis.
Because of biotin’s strong affinity with streptavidin, we can use it to bind biomolecules of interest, and use mass spectrometry to analyze their chemical structure.
0 notes
Text
Climate Change and Grain Yields
A statement by Lester Brown on Cambridge Forum motivated this blog post. Brown was speaking about the Russian heat wave in the summer of 2010, when temperatures went to record highs in Moscow, millions of acres of boreal forest burned, and the smoke in Moscow made the air toxic, convincing even Russian President Dmitry Medvedev to say: “I believe in global warming,” as his economy based on extractive commodities continued to pump out 10 million barrels of oil a day.
Brown noted that the U.S. produces 40 percent of the world’s corn and 38 percent of the world’s soybeans. He then said: “Russian grain production was cut 40 percent that summer. Imagine if American grain production were cut by as much. What would have happened to the world’s food supply and world grain markets?”
A study, by Schlenker and Roberts published in 2009, gives us some idea of how such a heat wave might affect U.S. farming yields. The study was in many respects a methodological tour de force. The authors collected data and used procedures to estimate temperature change over the course of each day in all the 2.5 by 2.5 square mile sections that are farmed east of the 100th meridian where irrigation is rarely practiced. The data was from the 56-year period 1950-2005. Analysis of this data enabled them to say that, “substituting a full [24-hour] day at 29° C temperature with a full day at 40° C temperature results in a predicted yield decline of 7 percent holding all else the same.” The green histograms in Figure 1 show the average exposure to each one-degree Celsius interval during the growing season.
Figure 1
Crop Yields as a Function of Temperature

The blue line in A (the flexible model for corn), shows that if one substitutes a full day (24 h) at 29 C temperature with a full day at 40° C temperature, there will be a predicted yield decline of -7%, holding all else the same. The red line shows a piecewise fit that follows the agricultural concept of degree days; the black line shows an eighth-order polynomial fit with a 95 percent confidence interval. The green histogram shows the average exposure to each one-degree Celsius interval during the growing season.
The relationship between temperature and yield is nonlinear for the three most commonly grown crops in the U.S., corn, soybeans, and cotton. The peak temperature for growing corn is 29 C (84.2 F); for soybeans, 30 C (86 F); and cotton 32 C (89.6 F). Most importantly, after these peak temperatures are reached, grain yields fall dramatically. This means that if U.S. farm belt temperatures were at the highs recorded during the Russian heat wave of 2010, world grain supplies would be severely affected, with consequent grain shortages; and likely food riots and social instability to follow.
What is the impact of climate change likely to be?:
Holding current growing regions fixed, area-weighted average yields were predicted to decrease by 30–46% before the end of the century under the slowest Hadley III Warming Scenario (B1), and decline by 63–82% under the most rapid warming scenario (A1FI). Rainfall would reduce the impact of temperature.
However:
A letter from Wageningen University and Research Centre, in the Netherlands, signed by B. G. Meerburga et al., published October 27, 2009, and titled Do nonlinear temperature effects indicate severe damages to US crop yields under climate change? takes issue with Schlenker and Robert’s findings. Meerburga’s letter stated that in the Mato Grosso area of Brazil, the maximum average daytime temperature exceeds 35 °C for 118 days per year, of which 75 days are in the average soybean growing season (October – May).
Despite this, average soybean production in 2008 was 3.1 tons per hectare per year while it was 2.8 tons during the same time period in the U.S. Similarly, the yield for cotton in 2006/2007 it was 1.4 tons per hectare per year compared with 0.9 tons in the U.S. in the same year. The writers believe that with technological improvement and proper management, higher temperatures need not reduce yields as predicted by Schlenker and Roberts.
So who is right? Schlenker and Roberts (S and R) spent enormous amounts of time compiling the data for their study, analyzing it and writing up the results. Their findings became part of general public knowledge. I recall hearing about their basic result, that crop yields decline steeply above certain temperature thresholds, several years ago (Their article was published in September 2009). But Meerburga and colleagues just made a casual observation from common knowledge among agricultural researchers or read a journal article.
I doubt Meerburga’s group is wrong. Is it possible both researchers are correct because S and R did their research in the U.S., and their work applies to U.S. farm practices and yields; but the letter is about Brazil where perhaps living in a warmer climate, Brazilian researchers have developed different and more heat resistant seed strains? Meerburga’s group suggests that “perhaps already existing technology and future advances (new varieties, optimized farm management, biotechnology, etc.) can overrule the negative effect of increasing temperatures on yield….”
Why didn’t Schlenker and Roberts know about this? Aren’t farm yields of differing countries widely known around the world at least among agricultural researchers?
Should the U.S. ignore S and R’s results and adopt the practices of the Brazilians? Are Brazil’s agricultural scientists better than ours? Wouldn’t that be widely known?
I find all of this puzzling and frustrating. It leaves me wondering about the quality of our agricultural research. Is not the U.S. the leader at such basic work? Evidently, we have much to learn from the Brazilians.
0 notes
Text
The Southwestern U.S. Drought Done a Bit Differently
There is little doubt that many of the predictions made about climate change, or global warming, are coming true. Huge amounts of ice are calving off the coastal glaciers of Greenland and Antarctica, which may be at opposite poles of the earth, but share a similar fate: They are both losing ice to melting. In the western U.S. and Canada, the fire season lasts much longer than just a few years ago. The seasonal behavior patterns of plants and animals are changing in response to warmer temperatures. These events mean that human beings, by burning fossil fuels, are warming the planet.
California is now entering a fifth consecutive year of drought. This year’s “godzilla” El Nino flopped by failing to supply twice the normal precipitation as did the other two recent big El Ninos, in 1982-1983 and 1997-1998. There was also a lengthy mid-winter dry spell during this winter’s wet season as in the preceding four wet seasons. Such dry spells are not uncommon, but their length and the unusual warmth associated with them raise the question, Is California’s drought a sign of global warming, and if so, what can we expect in the future?
In his blog, weatherwest.org, Daniel Swain, a graduate student in Earth Systems Science at Stanford, named the persistent high pressure cell over the Northeast Pacific associated with the drought, the Ridiculously Resilient Ridge, or RRR. In normal years, the North Pacific storm track directs wet-season rain and mountain snow into California. But during the drought, the RRR diverted storms from California into Alaska, as seen in Figure 1.
Figure 1
Ridiculously Resilient Ridge

William Patzert, Jet Propulsion Laboratory
Swain and colleagues noted that the strength of the high pressure ridge was unprecedented in the instrumental record both for its size and persistence. Although a blocking high pressure ridge is a relatively common occurrence even in winter, the RRR was anchored for far longer than normal and effectively cancelled most precipitation during what are normally the state’s wettest months, October through April. This occurred during all five drought years.
Diffenbaugh et al., (2015) working with Swain, noted that over the period from 1895 to 2014 in California, annual precipitation was unchanged, but beginning in 1995, average annual temperatures began to rise. Higher temperatures made the drought more severe by increasing water loss from simple evaporation and from transpiration by plants, two processes referred to jointly as evapotranspiration. Diffenbough also suggested that climate change may be affecting high pressure patterns in the northeast Pacific.
Swain and colleagues (2016) found no explanation for the increasing frequency of high pressure ridges like the RRR. But Swain noted that others have suggested that the increased northeast Pacific ridging in recent years, including the RRR, may be due to two very different changes that have been observed and are, with a high degree of certainty, due to global warming. These are 1) greater temperature contrasts between land and water, for example between the North America landmass and the northeast Pacific ocean; and 2) loss of Arctic sea ice.
William Patzert, an oceanographer at Cal Tech’s Jet Propulsion Laboratory in Pasadena, declared that the RRR is simply characteristic of the Pacific Decadal Oscillation (PDO) shown in Figure 2. One can see in the figure that the water is warmer in the northeast Pacific off the west coast of North America in the positive or warm phase of the PDO; but the water is cooler in that same area in the negative or cold phase of the PDO. The PDO involves the entire Pacific and changes phases from warm to cold at a slow, or decadal, rate as seen in Figure 3.
The California drought of the past four years is part of a much larger pattern of drought throughout the Southwest that began in 1999 after the strong El Nino of 1997-1998. Patzert suggests using Lake Mead as a “rain gauge.” Doing so, you can see in Figure 4 that the level of the lake began to drop in 1999 when the PDO flipped into its negative or cold phase. In general, the warm phase of the PDO is associated with wetter winters in the American Southwest including California, and the cool phase with drier Southwest winters. Thus, if you really want to understand the alternating wet and dry patterns of the Southwest and California, you start with the PDO.
Figure 2

http://research.jisao.washington.edu/pdo/
The scale shows the departure from normal in degrees centigrade of the sea surface temperature anomaly patterns associated with the warm (positive) and cold (negative) phases of the PDO.
Figure 3
Warm and Cold Phases of the PDO

William Patzert, Jet Propulsion Laboratory
Figure 4
Lake Mead as a Measure of the Southwestern Drought

The sharp drop from 1960 to 1965 reflects the filling of Lake Powell behind the Glen Canyon dam upstream of Lake Mead. The sharp drop in the mid-50s reflects the drought that affected primarily the southern plains states, but those years were also dry for the west and California.
William Patzert, Jet Propulsion Laboratory; California Institute of Technology.
Even if climate change/global warming has had little or no effect on California’s drought, Cayan and colleagues at the Scripps Institute of Oceanography predict that droughts in the American Southwest are likely to become more frequent and more intense. This is likely to occur because, barring a huge change in world-wide fossil fuel use, carbon dioxide levels will increase indefinitely, temperatures will continue to rise, and evapotranspiration will increase. As a result, even if the RRR that led to California’s drought was not in any way “caused” by human factors, it is likely, indeed almost certain, that the American Southwest, including California, will contend with a drier climate as a result of human activity whether we like it or not and whether we are prepared for it or not.
Target Audience
The instructions at the end of the Lecture 6 notes say “briefly describe,” but the instructions in the Syllabus say “include a detailed description of the new target audience.” What follows is a response to the latter instructions:
I started out with the intention of recasting this for a wider audience, making it more journalistic. That didn’t last long. Thus, the audience remains the same as for the first draft, which was significantly revised using MS Word tracking.
I think the audience is between two of the target audiences you describe in Lecture 6, Page 5, “Managers” and “Experts.” I chose managers because I would like to reach a policy making audience, like I suspect Peter Gleick does at Pacific Institute; and experts because I base my content on recent technical articles, which I spend much time reading, and because I wish to be taken seriously by serious people.
At the same time I don’t want to be overly academic. Is such a middle ground possible to achieve? I think so. I will go into this in greater detail in the audience description I’ll be emailing to you. Below is an outline of what I did to change this paper, even though I’m not that happy with it
I simplified the material considerably. I cut out all mention of geopotential heights, and changed the references, from a 2013 paper by Swain et al. to a 2014 paper by the same authors and dropped all mention of Wang and Shubert. I also included a new paper by Diffenbough et al., (2015) with whom Swain works.
I added a new Figure 1, the RRR (increasing the figure count from 3 to 4). Although the latter text is unchanged, the first half has been cut and streamlined considerably. For some reason this took forever, as did reading and understanding the new technical papers I read. The word count is now 930 down from about 1250. It should be an easier read.
If I had this read into the Congressional Record, don’t you think it would raise the tone?
0 notes
Text
Climate Change and Conflict
Both recent events and scientific publications (Hansen et al., 2016; DeConto and Pollard, 2016) suggest that the effects of global warming are occurring at a more rapid rate than models predict. Hansen states this explicitly and predicts a worst case scenario of three meters sea-level rise by century’s end. DeConto and Pollard predict possible sea level rise of two meters by century’s end, less than Hansen’s three meters, but not comfortably so. The Intergovernmental Panel on Climate Change estimates have been too conservative according to Hansen, one reason being that their estimates are a consensus among many researchers. This means that they select the average or median of the range of estimates their panel of climate scientists predict.
Much of the literature on the effects of climate change focuses on environmental damage, but there are many societal impacts that are among the first climate-related effects to be felt. In fact, climate has had a profound impact at many points in history. In a study to be reviewed below in detail, Hsiang et al. (2013) plotted over time the collapse of civilizations such as the Akkadians, one of the early Mesopotamian civilizations; the Maya in Central America; dynastic collapse in China; political and social upheaval in Europe after the fall of the Roman Empire (itself not climate related); and the terminal collapse of Angor Wat in Cambodia and the Tiwanaku Empire in Peru/Bolivia. In both Europe and China, conflict occurred as a result of colder drier weather leading to lower crop yields and social unrest, not to rising temperatures.
Of the many effects on human society and individual lives, none can be more consequential than warfare. It has been my presumption for some time that outright war, either civil war or war between two states, has yet to occur because of climate change. I was wrong.
According to Solomon Hsiang writing in 2013 with co-authors Marshall Burke and Edward Miguel, there is something of a cottage industry developing around the issue of climate change and conflict that includes 60 published studies based on 45 data sets. With 78 percent of studies published since 2009 and a median release date of 2011, most of these studies are recent. The Hsiang paper plots the relationship between temperature and crimes such as murder, assault, rape, and property crime; and for intergroup conflict, such as race riots and civil conflict including civil war.
The heart of the Hsiang et al. (2013) paper is a meta-analyses of the effect of temperature increases, precipitation decreases, and change in precipitation on both crime and civil conflict, the latter most often in sub-Saharan Africa. Meta-analysis is a set of statistical procedures that synthesizes the results of many studies into a single overall result. For example, if we wanted to summarize ten studies of the correlation between height and weight of U.S. adults in a single result, meta-analysis would give a single pooled result for all ten studies, essentially the weighted average of the individual studies.
Using the percent change in conflict with increased temperature for all the studies in their review, Hsiang et al. (2013) found a 2.3 percent increase in interpersonal violence and a 11.1 percent increase in intergroup conflict (e.g., civil war) for each 1.0 σ increase in temperature. The standard deviation, σ, is a measure of the dispersion of numerical values around the mean of a set of values. In this case, telling us how far a given value is from the mean of the distribution. The Hsiang result says that if the temperature in a given year is 1.0 σ above average, there is a 11 percent greater chance of intergroup conflict, possibly civil war.
In all the studies included in the meta-analysis of intergroup conflict, each country was its own control, meaning a country was followed before, during, and after a change in climate, rather than comparing one country undergoing climate change with another not undergoing such change.
The Hsiang et al. (2013) study seems like it would be the last word on climate change and conflict because it is recent and includes most or all of the studies in the current literature. But there is in fact a rival school that is critical of Hsiang’s methods and asserts that climate change is unrelated to conflict. This school includes Halvard Buhaug and 25 co-authors (2014) who refuted the criteria used by Hsiang in his meta-analysis. Buhaug repeated the meta-analysis using different criteria for study inclusion, found essentially random results, and asserted that the claimed relationship between climate change and conflict is false.
This argument was carried out in a special issue of the journal Climatic Change, which included a new paper by Hsiang and Burke (2014a). The journal editors gave Hsiang, Burke, and Miguel the final word in a third paper (2014b), but the argument remains basically unsettled. This means the reader either chooses sides on the basis of one or another aspect of these papers, or remains agnostic on the important issue of whether climate change affects civil conflict. Buhaug presents no argument on climate and crime, from which we conclude, based on Hsiang’s work, that higher temperatures raise the rates of some crimes, including violent crime.
There is another dispute, this one involving Burke et al., (2009) and Buhaug (writing alone in 2010), centering more narrowly on the specific question of whether climate causes civil conflict in Africa. The Burke study, showed that climate warming was related to African civil war. As in the dispute above, Buhaug claimed there was no effect of climate on African civil conflict. He did analyses in which he first defined civil conflict differently than Burke and then ran models that were similar to Burke’s, but was unable to reproduce his results. Using different models, Buhaug found other predictors of civil conflict: national economy; dictatorship; and post-Cold War era.
Again, there is no final word on who is correct here. Note that Burke and one of his co-authors, Edward Miguel, are two co-authors Hsiang frequently works with. As commonly occurs in behavioral science research, much of what is at issue are methodological problems involving how to define “civil conflict” in developing countries. Meanwhile, these methodological disputes have cast a shadow on what may be concluded, if anything, about the effect of climate on civil conflict.
In addition to the debate on climate and conflict, I’ve looked into the effects of drought on a specific ongoing civil conflict in the Eastern Mediterranean, the Syrian civil war. I’ve read a technical meteorological article that attempts to find the underlying cause of the drought that has brought 10 of the 12 driest years since 1902 to the Eastern Mediterranean. The Mediterranean region is projected to experience the greatest drying of the 26 regions around the world declared as ‘Hot Spots’ by Flippo Giorgi (2006), a climate scientist.
If climate change can be shown to cause civil conflict, or any violent conflict for that matter, who is responsible for such conflict? The Los Angeles commuter burning fossil fuels commuting to and from work? Yuppies burning even more fossil fuels to vacation in far-off lands?
One interesting personal item of note is that although I am an applied statistician by training, I find the most convincing evidence of climate affecting civil conflict to be macro-level historical events. These are events like the terminal collapse of civilizations such as the Maya and Angor Wat; and the smaller scale but still major events such as dynastic change in China and social upheaval in Europe. As noted above, these latter seem to be related to change in climate from “normal” to colder, drier periods rather than from “normal” to warmer, drier periods that seem to predominate in the current literature on climate change and human conflict.
That climate change within the normal non-anthropogenic range causes civil conflict holds lessons for society. If normal variation can disrupt the social order, then we should prepare for this by living sustainably and within the limits natural climate disruption may impose on us. The same should be said for human-induced climate change: prepare for it, but do all we can to change our energy infrastructure to avoid it.
It’s worth noting the relevance of the dispute over whether “climate change is related to conflict,” to a comment made in class, which was something I said about the “commitment of scientists to objectivity,” and the instructor’s reply that scientists are often “not always objective.”
All of us, scientists included, get emotionally involved in our work and to the truth or falseness of our claims. It couldn’t be any other way. Scientists are not robots, completely dispassionate about their work and the outcome of their research. How motivated would anyone be to do the hard work of research if it wasn’t to show that something was or was not the case? For James Hansen, climate change is not a matter of if, but when. His work is still held in high regard and is open to falsification.
In the sciences, evidence is gathered by both sides in a debate, heredity vs. environment, for example, and presented for others to review and critique. Given time, “what is” versus “what is not the case,” gets sorted out and a consensus is reached. Darwinian evolution moved from a theory to the bedrock of modern biology.
I suspect in the case above, it will be that temperature and drought are related to civil conflict. Even if the quantitative studies of Hsiang and Buhaug leave the matter unsettled for now, there are glaring examples, such as the Syrian civil war, and eventually if climate change continues, other civil wars, that make will matters self-evident.
0 notes
Text
Can Artificial Photosynthesis Save Us?
James Hansen warns that if we continue emitting CO2 at our current high rate, we may face up to ten feet of sea-level rise in this century. Hansen has often been criticized as alarmist, but less than a week after publication of the paper on which he based his warning, two climate scientists unaffiliated with Hansen reported that melting of the West Antarctic ice sheet might lead to six feet of sea-level rise by the end of this century. Not only are these studies disturbing, atmospheric concentrations of carbon dioxide, the main greenhouse gas, are rising at an accelerating rate, and now stand at 405 parts per million.
Just looking around, anyone can see that our use of fossil fuels continues unabated. Cars and light trucks get bigger each year, and Detroit automakers are already asking the Obama Administration to relax stringent mileage requirements they agreed to five years ago. Next time you’re in a tall building of any downtown in the country, see how many roofs below you have solar installations. Almost none. There has been an increase in use of renewable energy, especially in some states (California) and some countries (Germany), but the transition to a low carbon economy by both the world and the US is simply going too slowly. Inertia, political resistance by the fossil fuel industries, and the collapse of petroleum prices all slow the transition. Given this, what can we do? Are there any hat tricks science might pull that would help us before it is too late?
We can reduce CO2 emissions in two ways, 1) lower the amount of CO2 we are putting into the atmosphere; and 2) remove CO2 we’ve already emitted into the air. Since we are doing so poorly on the former, there is some reassurance in knowing that scientists are working on the later, a technology called artificial photosynthesis (AP).
In a paper published last September, Peidong Yang and colleagues at Lawrence Berkeley National Lab reported on experiments using light to power the electrolysis of water. They then used the hydrogen thus produced as a feedstock for anaerobic bacteria to produce methane, which may then be burned as a fuel. Other useful molecules can also be made.
With energy from sunlight, plants use photosynthesis to convert water (H2O) and carbon dioxide (CO2) into carbohydrates that store energy and to make cellulose and other complex sugars to build plant structures, such as wood in a tree trunk.
How does AP work? Have we learned the secrets of plants and turned them to our advantage, possibly to clean up the air we’ve befouled? Not quite; but AP does make use of reactions perfected by single-celled organisms to produce natural gas.
Using an electrical current to “split” water, H20, into its constituent elements, molecular hydrogen (H2) and oxygen (O2), has been done for more than 200 years. The electricity may come from any source including renewables such as solar and wind, but direct rather than alternating current must be used. Some single-celled organisms can absorb hydrogen from their environment and together with water and carbon dioxide, make methane, CH4, which is the main component of natural gas.
The organism used in Yang et als.’ experiments, Methanosarcina barkeri, is adept at this. It is an “obligately anaerobic archaeon,” meaning that the organism will die when exposed to atmospheric oxygen, its metabolism involves no oxygen, and it is a member of the archaea family of organisms. Archaea form one of the three branches of living organisms, bacteria and eukaryotes, being the other two branches. Eukaryotes, have a nucleus, while archaea and bacteria do not.
M. barkeri, creates energy by metabolizing carbon dioxide to methane, or CO2 to CH4. It is this metabolic function that electrochemical AP harnesses to convert carbon dioxide (CO2) taken from the atmosphere in combination with hydrogen (H2) from hydrolysis to produce methane. Electrochemical means a chemical reaction that involves electrical energy.
Electrochemical AP is a first step toward the ultimate goal of photoelectrochemical AP. Figure 1 shows how the type of photoelectrochemical AP developed by Yang et al. works. It uses electricity from a light source, in Figure 1 the sun through a solar cell, to provide the energy to split water molecules into hydrogen and oxygen. Scientists refer to the process of splitting of water molecules to make hydrogen a “hydrogen evolution reaction,” or HER.
If we put both H2 and CO2 molecules in a nutrient medium containing M. barkeri organisms, the M. barkeri will combine them to create methane, or CH4, by liberating the oxygen molecule (O2). Loss of the oxygen molecule (O2) makes this a reducing reaction, one in which oxygen is removed from the CO2 molecule
In Figure 1, electricity generation and splitting of water is the artificial part of this process; and the production of methane from carbon dioxide is the biological part of this AP type.
Figure 1
Biological Artificial Photosynthesis

http://www.pnas.org/content/112/37/11461.full.pdf
Dr. Yang said that, “the electrical-to-chemical conversion efficiency” is better than 50 percent. This means if you burned the methane, it would produce over half the energy used to power the electrolysis required to create the methane.
Yang also said that, “the solar-to-chemical conversion efficiency is about 10 percent.” This means that if you used photoelectrical energy to drive the electrolysis and burned the methane produced, you would get about one tenth of the solar energy used to produce the methane.
Clearly, there are problems with this kind of AP. The loss of energy from solar to electrical to chemical/biological energy is huge, 90 percent. Efficiencies of only10 percent would make AP energy far more expensive than any form of renewable energy available today. It is only recently, and largely due to Chinese overproduction of solar panels, that the cost of solar energy has become competitive with fossil fuels.
The loss of 90 percent of the energy produced by solar panels means that you would be much better off using the electricity produced by the panels to fry an egg with an electrical stove than converting the solar energy to methane with AP to cook the egg with a gas stove.
It is only recently, and largely due to Chinese overproduction of solar panels, that the cost of solar energy has become competitive with fossil fuels. The highest commercially available solar panel efficiency claims are about 21 or 22 percent, which means AP performs at about half the efficiency level of the best available solar panels. Researchers at, for example, the National Renewable Energy Laboratory and similar labs around the world have achieved efficiencies as high as 46 percent, but this is done with exotic and expensive technologies that may never be used at commercial scale.
The other problem is that in their experiments, Yang et al.“saturated” the medium containing the M. barkeri bacterium. Even at 404 PPM, carbon dioxide is highly dispersed. To concentrate it and then mix it into the medium requires more energy than one would obtain from the AP itself. If one skipped the concentration step, then the CO2 must come from the minimal contact the medium makes with air on the medium’s surface, which would slow the process to a near halt.
Something to keep in mind about this approach to AP: It will not remove carbon dioxide from the atmosphere. Photosynthesis takes CO2 and water from the air and in a reaction using the sun’s energy, generates sugars and molecular oxygen, O2. In this way, plants act as a carbon sink, removing CO2 from the air, sequester it in useful plant molecules, and give off life-supporting oxygen.
The AP reaction involves taking CO2 from the atmosphere and combining it with molecular hydrogen created from electrolysis of water. M. barkeri is then used to produce methane, CH4, the main constituent of natural gas, which we may then burn. Note, that this burning of “artificial” natural gas will produce CO2 as an end product of combustion, returning it back to the atmosphere.
This is a closed system that creates the same amount of carbon dioxide as a “waste product” that was used to produce the methane. This means that CO2 will not be removed from the atmosphere and there is no net change in atmospheric CO2.
These are serious problems, but AP is a new area of research, with new agencies working on the problem. The best approach at this point is to fund as many alternatives as possible and remain open to all avenues that offer any possibility of reducing carbon dioxide emissions in the hope that their cost will fall and efficiencies rise.
1 note
·
View note
Text
The Southwestern U.S. Drought (More Thoroughly Revised)
While it is widely recognized among meteorologists that the most detectable climate change signal will be extreme events, it is difficult to determine which extreme events these are. We might well wonder, for example, whether the drought occurring throughout the American southwest, including California, is such a signal and therefore attributable, at least in part, to human activities such as fossil fuel burning.
Daniel Swain and colleagues observed that a high pressure ridge in the northeast Pacific, a relatively common occurrence even in winter, persisted during the first five months and last three months of 2013. This was far longer than normal and effectively cancelled most precipitation during what are normally the state’s wettest months, October through April. Were these conditions that made the 2013 calendar year and the 2013/2014 rainy season the driest in the instrumental record, which began in 1895, due to global warming? And if they were, what can we expect in the future? In his blog, weatherwest.org, Swain named the persistent high pressure cell, the Ridiculously Resilient Ridge, or RRR, a name that stuck. Swain and colleagues noted that the strength of the high pressure ridge was unprecedented in the instrumental record both for its geographical extent and persistence.
Geopotential height (GPH) is a term meteorologists use to indicate the location and strength of high and low pressure areas. GPH will be at a higher altitude above warm areas because warm air is lighter or less dense. Conversely, GPH will be lower above cold areas because cold air is heavier or more dense. In sophisticated analyses and modeling of GPH values associated with the RRR, Swain and colleagues concluded that two factors in the “forcing” of the high GPH values, 1) natural and 2) human-induced conditions, such as carbon dioxide emissions, were both involved. They concluded that natural forces alone could not have produced the RRR, and therefore man-made factors, chiefly carbon dioxide emissions, played at least some role in the drought.
In a different study, however, two NASA climate scientists, Hailan Wang and Siegfried Shubert, found no evidence that global warming had affected precipitation in California. Without resort to fancy climate modeling, William Patzert, an oceanographer at Cal Tech’s Jet Propulsion Laboratory in Pasadena, declared that the RRR is simply characteristic of the Pacific Decadal Oscillation (PDO) shown in Figure 1. One can see in Figure 1 that the water is warmer in the northeast Pacific off the west coast of North America in the positive or warm phase of the PDO; but the water is cooler in that same area in the negative or cold phase of the PDO. The PDO involves the entire Pacific and changes phases from warm to cold at a slow, or decadal, rate as seen in Figure 2.
The California drought of the past four years is part of a much larger pattern of drought throughout the southwest that began in 1999 after the strong El Nino of 1997-1998. Using Lake Mead as a “rain guage,” you can see in Figure 3 that the level of the lake began to drop in 1999. In general, the warm phase of the PDO is associated with wetter winters in the American Southwest including California, and the cool phase with drier Southwest winters. Thus, if you really want to understand the alternating wet and dry patterns of the Southwest and California, you start with the PDO.
Figure 1

http://research.jisao.washington.edu/pdo/
The scale shows the departure from normal in degrees centigrade of the sea surface temperature anomaly patterns associated with the warm (positive) and cold (negative) phases of the PDO.
Figure 2
Warm and Cold Phases of the PDO

William Patzert, Jet Propulsion Laboratory
Figure 3
Lake Mead as a Measure of the
Southwestern Drought

William Patzert, Jet Propulsion Laboratory
Even if human-induced climate change did not contribute to the RRR, which caused our drought, climate scientists agree that by raising temperatures globally, including the American southwest and California, climate change worsened the drought in two related ways. First, by increasing water loss from plants through transpiration; and second, by evaporation, leading to drier soils. Climate scientists refer to the two processes jointly as evapotranspiration, and it is having a severe effect on the survival of California’s forests.
There is still more to it, however. Cayan and colleagues at the Scripps Institute of Oceanography predict that droughts in the American Southwest are likely to become more frequent and more intense during the later part of this century as CO2 levels rise. Thus, even if the RRR that led to California’s drought was not in any way “caused” by human factors, it is likely, indeed almost certain, that the American Southwest, including California, will contend with a drier climate as a result of human activity whether we like it or not and whether we are prepared for it or not.
0 notes