
Don't wanna be here? Send us removal request.
Statistics
We looked inside some of the posts by slvaught-blog and here's what we found interesting.
Average Info
Notes Per Post
0
Likes Per Post
0
Reblog Per Post
0
Reply Per Post
0
Time Between Posts
6 days
Number of Posts By Type
Text
5
Last Seen Tumblr Blogs


Fun Fact
The KCSC sent more than 20K requests to delete posts related to prostitution and porn to Tumblr from January to June 2017.
Text
Week 4 assignment - Univariate and Bivariate Graphs
This week we created univariate and bivariate graphs for our chosen variables. My hypothesis is that students who participate in physical activities (I defined this as participating in a given physical activity 3 or more times per week) will perform better in school. I have three variables that measure school performance – current math grade (B or higher), current English grade (B or higher), and If the student has trouble paying attention in school more than nce a week. Here are the individual graphs of my variables:
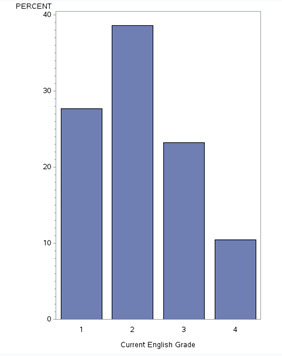
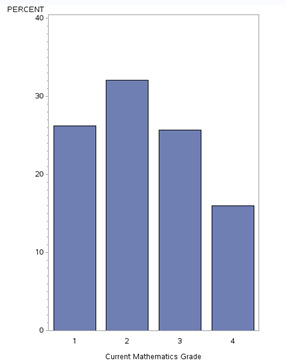

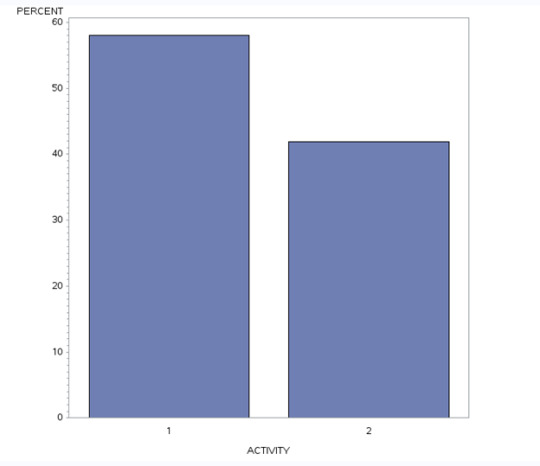
It appears that students who have a “B” in both their English and math classes is the most common category. If we could think of this as a quantitative variable (each grade A,B,C,D being a class of width 10) , the shape would be skewed left. The grades vary A – F, and it appears (although this is not of interest to my hypothesis) that students perform poorer in their math classes than in their english classes. The majority of students say they have trouble paying attention in school just a few times or never, and the number of students decreases as the amount of time they do not pay attention decreases. More students perform some form on physical activity 3 times or more per week (labeled as 1) than not (labeled as 2).
Here are my bivariate graphs:
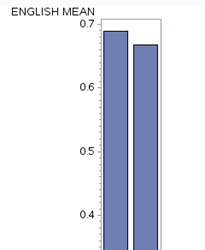
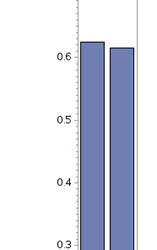
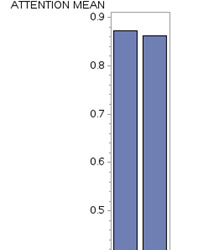
The above compare level of activity to each of the response variables – math grade, English grade, and how they pay attention in school. There is a slight decrease in the percent of students who perform well in math and English if they are not physically active – a larger decrease in English grades than in math grades. There is also a slight decrease in whether students have trouble paying attention in school for students who are not physically active. Because these changes are so small, I am beginning to doubt whether the results will be statistically significant.
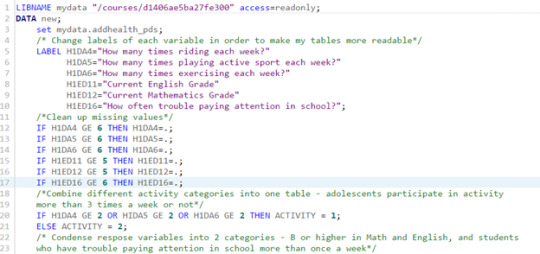
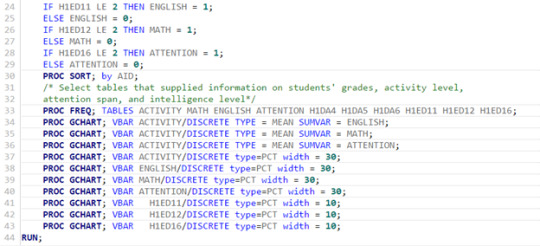
Here is the code I used to generate the graphs, tables, etc.
0 notes
Text
Week 3 Assignment
This week was very helpful in answering one of my lingering questions – how can I combine the 3 different activities adolescents are questioned about (I call them riding (bike, roller blades, etc.), sports, and exercising) into one variable. I assumed these variables were not mutually exclusive and I was correct. Unfortunately, the variable I created only has 2 levels – the students participate in one of these activities 3 or more times a week or they do not. But I believe I will be able to compare these results to their grades and attention level at school to see if there are significant results.
I first began by removing missing values from my 8 variables. I had to remove each one individually, so if anyone has a way to help shorten this code please let me know.
I noticed that there were 6 students total in each of my activity groups that either refused the question or didn’t know. I removed those. For the variables that gave the students grade in math or English there were quite a few variables to remove. Possibly students that went to schools that didn’t grade on an A-F scale, who were home schooled, who were not enrolled in math or English that year, or had dropped out of school. There were 321 of these values in my English variable and 582 in my Math variable. When adolescents were asked if they had trouble paying attention in school 137 did not respond, but 128 were a legitimate skip (maybe did not attend school). When students were asked if they felt like they were intelligent compared to other students their age there were 101 that refused or didn’t know and when asked if they were physically fit only 24 responded the same.
I only created one new variable this week – the ACTIVITY variable as described above. 1 – student participates in physical activity 3 or more times a week or 2 – student does not participate in one of these physical activities 3 or more times per week.
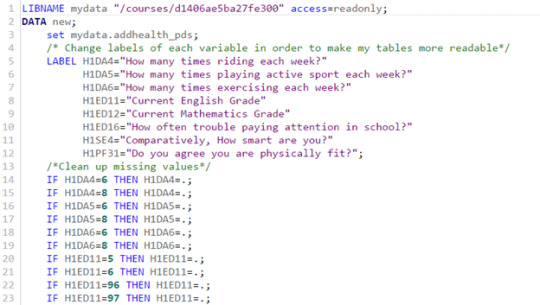
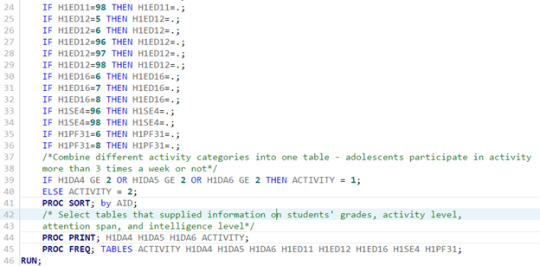
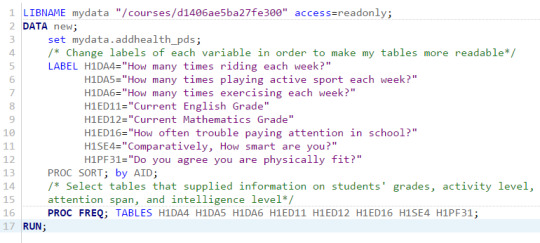
Here is the code for my SAS program:
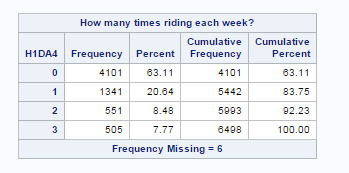
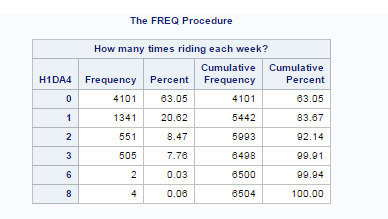
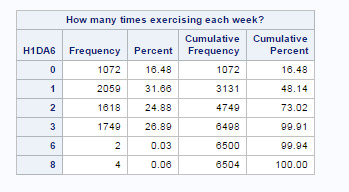
Here are the tables for the new ACTIVITY variable as well as the 3 variables it was created from:
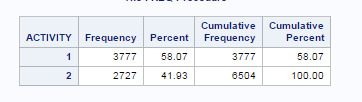
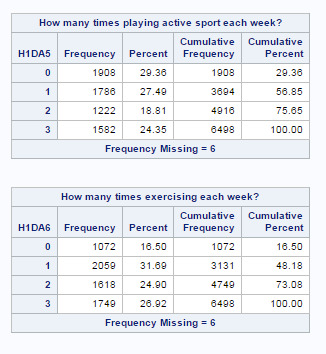
As you can see, over half of the adolescents participate in one of the physical activities 3 or more times per week (3777 out of 6504). This is only new variables created this week, so I have no other analysis of my variables (see week 2 for an analysis of the other variables).
0 notes
Text
Week 2 Assignment - First SAS Program

In this week’s lesson we learned how to create a program that would select only the variables we were interested from our selected data sets, and possibly select only a subset of the individuals based on one of the other variables (gender, whether or not they have smoked, etc.).
I chose to work with SAS because I am interested in getting certified in SAS so I used this lesson as an introduction. I also plan on going back and completing the python exercises because I feel an introduction to python will also be helpful in the future.
I am interested in looking into the association between levels of physical activity and students performance in their Math and English class, as well as their attention span at school.
In the variables regarding level of activity, I found three options. How often (per week) adolescents spend riding their bike (or other things), playing sports, and exercising. Students could answer not at all, 1 to 2, 3 to 4, of 5 or more time. The majority of students answered not at all or 1 to 2 times a week for each question. It appears that students spend much less time riding their bike (or other things) and are more likely to achieve activity through sports or exercising. But it appears that almost more than 50% of adolescents exercise only 1 to 2 times per week in these various activities. With these 3 variables I only had a 6 students total in each variable that either refused to answer or answered “don’t know”. There were no missing variables. I see an issue that these events are not mutually exclusive and I will have to write a program that combines these 3 activities so I can get an overall look at the students’ activity level. I also found a question that asked students how strongly they agreed with the statement “You are physically fit”. The majority of the students either agreed or strongly agreed with 21 students refusing or answering “I don’t know”.
I also examined adolescents current grades in English and Math. Students were given the options of: A, B, C, D or lower, didn’t take subject, took the subject but it wasn’t graded this way, refused legitimate skip, or don’t know. It appears that 97 students skipped the question for mathematics and English, so I will have missing values in these column. The majority of students have either an A or B in both their math and English classes.
Here is the SAS program I wrote to look at several variables that measure levels of activity, grades, intelligence, etc.
I opted not to subset the rows at this time. I might in future programs.
Here are the first 3 tables that were displayed.

0 notes
Text
Week 1 - Research and Hypothesis
I have begun my research into the Adolescent Health data set (AddHealth). As a teacher in secondary education I was interested in the data they had collected on their academic ability and health factors that could have an association with success in school. After reviewing the codebook I found the section on academics and school and printed this section of the code book. I then began reviewing the rest of the codebook to see if there was something that sparked my interest.
I remember having a conversation with one of our therapists about a student that was struggling in my statistics class. He had been diagnosed with ADHD and it was causing his inattentiveness and distraction in class. She told me that when the student participated in marching band first semester she saw fewer of the symptoms of his ADHD because of his higher level of physical activity during this time.
This made me wonder if a level of physical activity would be associated with academic success? Also, if a level of physical activity would be associated with students’ level of attentiveness in class.
I was interested in the association between students’ academic success and physical activity on those diagnosed with ADHD but this information was not available in the Addhealth data set.
I researched previous studies on these associations in google scholar. I found quite a few studies on the relationship between physical activity and academic achievement, but only a few on the relationship between physical activity and attentiveness. Here are my results.
Search term: Association between physical activity and attention span in students
· Effect of Physical Education and Activity Levels on Academic Achievement in Children DAWN PODULKA COE1 , JAMES M. PIVARNIK1,2, CHRISTOPHER J. WOMACK1 , MATHEW J. REEVES2 , and ROBERT M. MALINA3
https://www.researchgate.net/profile/Christopher_Womack/publication/6899305_Effect_of_Physical_Education_and_Activity_Levels_on_Academic_Achievement_in_Children/links/0a85e53396f357dc2c000000.pdf
experiment – random assignment of children to physical education either first or second semester (no association)
Obs. Study – polled on physical activity outside of school
Students who either performed some or met Healthy People 2010 guidelines for vigorous activity had significantly higher grades (P < 0.05) than students who performed no vigorous activity in both semesters.
Bilibiography-
o CATERINO, M. C., and E. D. POLAK. Effects of two types of activity on the performance of second-, third-, and fourth-grade students on a test of concentration. Percept. Mot. Skills 89:245–248, 1999
o CATERINO, M. C., and E. D. POLAK. Effects of two types of activity on the performance of second-, third-, and fourth-grade students on a test of concentration. Percept. Mot. Skills 89:245–248, 1999
o DWYER, T., J. F. SALLIS, L. BLIZZARD, R. LAZARUS, and K. DEAN. Relationship of academic performance to physical activity and fitness in children. Pediatric Exercise Science 13:225–237, 2001.
o KEAYS, J. J., and K. R. ALLISON. The effects of regular moderate to vigorous physical activity on student outcomes: a review. Can. J. Public Health 86:62–66, 1995.
o MCNAUGHTEN, D., and C. GABBARD. Physical exertion and immediate mental performance in sixth-grade children. Percept. Mot. Skills 77:1155–1159, 1993
o TREMBLAY, M. S., J. W. INMAN, and J. D. WILLMS. The relationship between physical activity, self-esteem, and academic achievement in 12-year-old children. Pediatric Exercise Science 12:312–323, 2000.
· Children with attention deficits concentrate better after walk in the park A Faber Taylor, FE Kuo
http://journals.sagepub.com/doi/abs/10.1177/1087054708323000
Students diagnosed with ADHD walked in a park, downtown area, and neighborhood for 30 minutes (randomly assigned order) with 1 week between treatments. After each walk concentration was measured using Digit Span Backwards. Children with ADHD concentrated better after the walk in the park than after the downtown walk (p = .0229) or the neighborhood walk (p = .0072).
Bibliography –
o Fiore, T.A., Becker, E.A., & Nero, R.C. (1993). Interventions for students with attention deficits . Exceptional Children: Special Issue: Issues in Education of Children with Attention Deficit Disorder, 60(2), 163-173. Google Scholar
o Hallowell, E., & Ratey, J. (1994). Driven to distraction: Recognizing and coping with attention deficit disorder from childhood through adulthood. New York: Pantheon. Google Scholar
Search Term: Association between physical activity and academic success in students
· Is There a Relationship Between Physical Fitness and Academic Achievement? Positive Results From Public School Children in the Northeastern United States: Virginia R. Chomitz PhD, Meghan M. Slining MS, MPH, Robert J. McGowan EdD, Suzanne E. Mitchell MD, MS, Glen F. Dawson MA, Karen A. Hacker MD, MPH
http://onlinelibrary.wiley.com/doi/10.1111/j.1746-1561.2008.00371.x/full
This study judged academic success on the students passing the Massachusetts Comprehensive Assessment System (MCAS) in Mathematics and English (grades four, six, and eight) and fitness achievement as the number of physical fitness tests the students passed in their physical education classes.
Multivariate logistic regression analyses were conducted to assess the probability of passing the MCAS tests, controlling for students’ weight status (BMI z score), ethnicity, gender, grade, and socioeconomic status (school lunch enrollment).
The odds of passing both the MCAS Mathematics test and the MCAS English test increased as the number of fitness tests passed increased (p < .0001 and p < .05, respectively).
Bibliography:
o Takuro Higashiura, Keita Kamijo, Association of childhood fitness with academic achievement and cognitive function, Journal of Health Psychology Research, 2017, 29, Special_issue, 153
o Kent A Lorenz, Michalis Stylianou, Shannon Moore, Pamela Hodges Kulinna, Does fitness make the grade? The relationship between elementary students’ physical fitness and academic grades, Health Education Journal, 2017, 76, 3, 302
o Laura Chaddock-Heyman, Kirk I. Erickson, Michael A. Chappell, Curtis L. Johnson, Caitlin Kienzler, Anya Knecht, Eric S. Drollette, Lauren B. Raine, Mark R. Scudder, Shih-Chun Kao, Charles H. Hillman, Arthur F. Kramer, Aerobic fitness is associated with greater hippocampal cerebral blood flow in children, Developmental Cognitive Neuroscience, 2016, 20, 52
o Joseph E. Donnelly, Charles H. Hillman, Darla Castelli, Jennifer L. Etnier, Sarah Lee, Phillip Tomporowski, Kate Lambourne, Amanda N. Szabo-Reed, Physical Activity, Fitness, Cognitive Function, and Academic Achievement in Children, Medicine & Science in Sports & Exercise, 2016, 48, 6, 1197
o C. C. A. Santana, L. B. Azevedo, M. T. Cattuzzo, J. O. Hill, L. P. Andrade, W. L. Prado, Physical fitness and academic performance in youth: A systematic review, Scandinavian Journal of Medicine & Science in Sports, 2016
· Physical Fitness and Academic Achievement. Grissom JB - Journal of Exercise Physiology Online, 2005
Scores on FITNESSGRAM (a physical fitness test) were compared to reading and mathematics scores on the Stanford Achievement Test in grades five, seven, and nine. Results indicate a consistent positive relationship between overall fitness and academic achievement. That is, as overall fitness scores improved, mean achievement scores also improved. This relationship between fitness and achievement appeared to be stronger for females than males and stronger for higher socioeconomic status (SES) than lower SES students
Bibliography:
o Dwyer T., Sallis JF, Blizzard L, Lazarus R, Dean K. Relation of academic performance to physical activity in children. Ped Exerc Sci 2001;13:225-237.
o Shepard LA, Flexer RJ, Hiebert EH, Marion SF, Mayfield V, Weston TJ. (Effects of introducing classroom performance assessments on student learning. Education Measurement: Issues and Practices 1996;15(3):7-18.
0 notes
Text
Post #1
Started this blog to talk about a class in coursera that teaches the principles of data analysis. I have chosen to work with the AddHealth data set and look at the students success in school compared to several other variables. I struggled to find a data set of interest (secondary math education) but I hope this will spark my interest. It says the data set is from 1994-1995 which seems untranslatable to today's students. But I just need to learn the skills that are in the course, not publish a paper when I’m done so I’m sure it will be fine.
0 notes