
Host of The Investors Podcast which is the #1 stock investing podcast worldwide with 12 million+ downloads and counting.
Don't wanna be here? Send us removal request.
Statistics
We looked inside some of the posts by stigbrodersen-blog and here's what we found interesting.
Average Info
Notes Per Post
0
Likes Per Post
0
Reblog Per Post
0
Reply Per Post
0
Time Between Posts
21 days
Number of Posts By Type
Text
17
Last Seen Tumblr Blogs


Fun Fact
Hackers stole 65M passwords from Tumblr in 2013.
Text
The Intrinsic Value of VOXX International Corp.
Introduction
VOXX International Corp. is a manufacturer and supplier of consumer electronic products in the automotive, premium audio, accessory and biometrics industries.
Their business is divided into three segments:
The Consumer Electronics unit sells speakers, headphones, audio systems, and other mostly audio-related electronics products. It includes the former Premium Audio segment and the former Consumer Accessories segment, less EyeLock, LLC. The company’s Klipsch brand is the number one premium speaker brand both in the US and in Canada.
Automotive Electronics consists of the Company's OEM and aftermarket automotive business. Here, VOXX offers several solutions for the automotive market, such as rear-seat entertainment devices, automotive security and remote start systems, advanced driver assistance systems, aftermarket satellite radio, and others.
Biometrics is a newly formed segment which includes EyeLock, LLC, the Company's majority-owned investment. EyeLock offers iris-authentication solutions for protecting identity and assets.
The revenue of International Corp. has massively declined during the last years. While in 2013 the company still reported sales of $836 million, this figure today stands at only $439 million. A recent decline in car sales and the timing of various programs explains this drop during the last one or two years, but the company’s problems run deeper. Lately, VOXX International Corp. also had to write down a large part of its goodwill, sending earnings sharply negative. One reason for these problems might be the various business segments, which seem to have little overlap and therefore offer only limited synergy savings.

VOXX International Corp.’s stock price has fallen from more than $18 in 2013 to a price of only $4.90 today. Is this a bargain, or is the stock market right to be so pessimistic?
The Intrinsic Value of VOXX International Corp.
To determine the value of VOXX International Corp., let’s start by looking at the company’s history of free cash flow. The free cash flow is important because it represents the company’s ability to retain earnings and grow the business. Most importantly, it demonstrates a return on the principal that might be invested into the ownership of equity of the business. Below is a chart of VOXX International Corp.’s free cash flow over the past years.

As one can see, the cash flows have been highly volatile. This is due to the cyclical business VOXX International Corp. is operating in. Also, the company has been repeatedly reorganized, and its business has constantly changed. As a consequence of these additional risks, we will use a conservative estimate for VOXX International Corp.’s future cash flows.
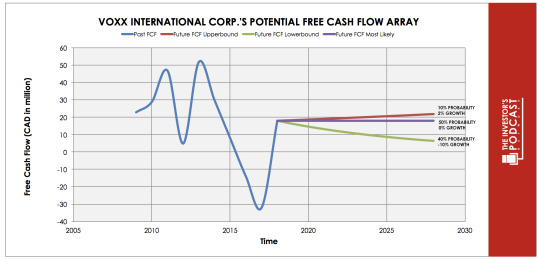
Each line in the above graph represents a certain probability for occurring. The upper growth rate of 2% assumes that the company can be successfully transformed and that its revenue stabilizes. While it might not be unreasonable to assume this sce
nario, we only set a 10% chance for this outcome. This might be overly pessimistic, but the company’s future is quite unpredictable. As most probable, we consider zero change in cash flow. For this scenario, we assign a probability of 50%. The worst case is assumed to be a sharp decline of 10% annually, which might be caused by a severe recession or if VOXX International Corp.’s current transformation is unsuccessful. We estimate the chance for this happening at 40%.
Assuming these growth rates and probabilities are accurate, VOXX International Corp. can be expected to give a 12.1 % annual return at the current price of $4.90. Now, let’s discuss how and why those free cash flows could be achieved.
The Competitive Advantage of VOXX International Corp.
VOXX International Corp. possesses some unique advantages that should allow it to be successful in the future:
Solid Balance Sheet. Despite its problems, VOXX International Corp. has consistently managed to keep a solid balance sheet. The current ratio and quick ratio are very healthy, and the company managed to get rid of almost its complete long-term debt. This was achieved by selling assets such as Hirschmann Car Communication.
Profitable Consumer Electronics. The Consumer Electronics segment is profitable and growing. The incorporated Klipsch brand is the market leader both in the US and in Canada.
Growth Potential. Biometrics is a new segment with vast possibilities. Due to the rise of the Internet of Things, secure verification procedures such as iris identification may yield vast rewards.
Opportunity Costs
When looking at various investing opportunities on the market today, let’s compare the expected return of VOXX International Corp. to other ideas. First, one could invest in the ten-year treasury bond, which is producing a 1.79% return. Considering the bond is completely impacted by inflation, the real return of this option is likely barely positive. Currently, the S&P 500 Shiller P/E ratio is 30.1. According to this valuation metric, the US Stock market is priced at a 3.3% yield. If one were to invest in the S&P500, they might purchase a low-cost ETF to take advantage of this return.
Macro Factors
The Consumer Electronics segment is strongly dependent on the general state of the world economy. In a recession, people first save on luxuries – such as state-of-the-art loudspeakers or high-end multimedia devices.
VOXX International Corp.’s Automotive Electronics segment is especially dependent on car sales, which in turn is again depending on the state of the global economy. Recently car sales have already plunged, and the company was negatively affected. The rise of the Internet of Things (IoT) offers use growth possibilities for the Biometrics segment, although this is also a new field which can be quite unpredictable. If the IoT does not deliver on its promises, this could also lead to disappointment for the Biometrics segment.
Risk Factors
There are several risks that might limit the growth prospects of VOXX International Corp.:
Uncertainty Due to Transformation. Revenue has fallen sharply for several years, showing that VOXX International Corp.’s business model was not sustainable. As a result, management tries to change course: Several parts of the company were sold and the structure of its business units reorganized. It is yet unclear if this new business model will be more successful than the old one.
Declining Automotive Car Sales. This already negatively impacts the automotive electronics segment. Car sales are very cyclical and closely connected to the state of the world economy. If another global recession strikes or if car sales continue to drop because of other reasons, demand for products of VOXX International Corp.’s Automotive Electronics products might be lowered.
Disconnected Business Parts. While the Consumer Electronics and Automotive Electronics segments are similarly aligned, it is hard to see a huge connection to the Biometrics segment. Loudspeakers and automotive entertainment devices bear very little resemblance with iris identification solutions. This limits the scope of synergies, and it remains to be seen if these different segments can be successfully integrated within a single company.
Summary
VOXX International Corp. is currently undergoing a vast transformation of its business model, and the outcome is as yet unclear. The company has solid finances, looks cheap, and offers the potential for huge growth – especially in its Biometrics segment. On the other hand, things can also easily go downhill, if the business transformation fails, global car sales deteriorate further, or the Internet of Things does not fulfill its vast promises.
The Biometrics segment is especially the big unknown variable: This company part has yet no meaningful revenue, the potential of the technology is still unknown, and management has little experience in this field. But if all works out well, the rewards are huge.
At this point, it is quite hard to determine if VOXX International Corp. is a bargain or a value trap. If the company manages to prosper within the new business environment, the expected annual return of 12.1 % seems generous. But the risks are equally large. Before investing in VOXX International Corp., investors are well-advised to investigate the company in more detail.
*
This article was written in collaboration with Christoph Wolf from Christoph Wolf Value Investing
Stig Brodersen is the host of the business podcast “We Study Billionaires.” You can find his free intrinsic value index here of popular stock picks.
0 notes
Text
The Intrinsic Value of XCel Brands Inc.
Introduction
XCel Brands Inc. is a media and consumer company with a novel approach to retail. The company is engaged in the design, production, marketing, and direct-to-consumer sales of branded apparel, footwear, accessories, and home goods. Its brands include Isaac Mizrahi, C. Wonder, Halston, Judith Ripka, and Highline.
Using its novel approach of a fast-to-market supply chain and using its integrated technology platforms, the company aims to give its retail partners an edge over existing fast fashion models. Its retail partners get exclusive rights of XELB’s brands, while XELB earns its revenues from royalties, design fees, margin participation, as well as marketing and other fees.
The company aims to address the problem of the disconnect between short-lead social media and long-lead supply chains. This is achieved by using an integrated technology platform using consumer insight testing, trend analytics tools, data science, 3D design, and AI. This allows XELB to react very fast to the market’s needs, while also maintaining a high quality of its products.

By applying both its novel fast-fashion model and working closely together with its retail partners, the company can operate on a capital-light approach. The firm does not need to rent huge areas for storage and selling of its wares – this capital-intensive part is done by its partners.
Although this approach has huge advantages, the company’s stock price has consistently declined during the last four years: From $9.10 in 2015, the stock has fallen to only $1.54 today. This is all the more surprising since XELB has consistently managed to raise revenue during this time, and also most of the time stayed profitable. Is XELB, therefore, a buy at its current price of $1.54?
The Intrinsic Value of XCel Brands Inc.
To determine the value of XELB, let’s start by looking at the company’s history of free cash flow. The free cash flow is important because it represents the company’s ability to retain earnings and grow the business. Most importantly, it demonstrates a return on the principal that might be invested into the ownership of equity of the business. Below is a chart of XELB’s free cash flow over the past ten years.
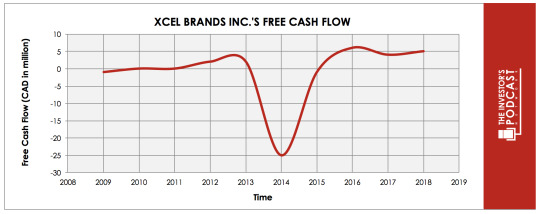
As one can see, the results have been quite volatile – but with an upward trend. The volatility is due to fluctuations in the operating and net margins – and not because of volatile revenue. In fact, revenue has consistently grown throughout the last decade.
Although these numbers look quite good, we will use a very conservative estimate of its future cash flows.

Each line in the above graph represents a certain probability for occurring. We assume a 25% chance for the upper growth rate of 2% per year, a 50% chance for zero growth and a 25% chance for the worst-case scenario of a 5% annual decline.
Assuming these growth rates and probabilities are accurate, XELB can be expected to give a 17.1% annual return at the current price of $1.54. This return seems very rewarding. Now, let’s discuss how and why those free cash flows could be achieved.
The Competitive Advantage of Xcel Brands Inc.
XELB possesses several advantages:
Innovative Company. XELB has a completely new approach to selling and marketing its products. By using social media and other tools, the company can always find out current trends and build its brands and products accordingly. This is not only done very fast, but also the high quality of its products can be maintained.
Capital-Light Business. XELB’s business is mostly focused on the capital-light part of retail, such as designing or marketing. No heavy machinery or inventory has to be kept by the company – this part is mostly taken care of by its retail partners. This frees up cash and allows the company to act fast and remain flexible.
Stickiness. By providing its retail partners with unique tools such as its virtual vertical platform, it enables these partners to be successful. This is a strong incentive for its partners to stay loyal to XELB.
Risk Factors
While XELB has been mostly successful so far, several issues also need to be included in the assessment of the company.
Untested novel business approach. XELB’s approach is completely new and might work out wonderfully. But new and untested ideas also carry a high risk of uncertainty and failure.
Multiple brands added recently. Except for Mizrahi, all of XELB’s brands have been acquired and launched within the last five years. The company, therefore, only has limited experience with the things it owns. Successfully integrating all into one company might still take some time and effort.
Risk of a global recession. While an economic downturn would affect all global companies, XELB might be especially vulnerable due to two reasons: Firstly, the retail sector is quite sensitive to a recession. Secondly, XELB’s retail partners will all aim to slash costs when the economy tanks. The first things to go are often expenses for novel and untested experimental business operations – such as the collaboration with XELB.
Opportunity Costs
When looking at various investment opportunities on the market today, let’s compare the expected return of XELB to other ideas. First, one could invest in the ten-year treasury bond, which is producing a 1.47% return. Considering the bond is completely impacted by inflation, the real return of this option is hardly above zero. What about investing in U.S. stocks? Currently, the S&P 500 Shiller P/E ratio is 28.8. As a result, the U.S. Stock market is priced at a 3.5% yield. If one were to invest in the S&P500, they might purchase a low-cost ETF to take advantage of this return.
Macro Factors
The retail sector currently experiences a major disruption– not only because of Amazon but also because of demographic factors and changed shopping behavior. Multiple retail companies have declared bankruptcy recently, and several others are struggling.
This is exactly the issue that XELB aims to address with its novel approach. While revenue is at best flat and margins are under pressure for most traditional brick-and-mortar retailers, XELB’s approach aims to react fast to customer’s needs and give them what they want. This allows the company to earn comparatively high margins.
Summary
XELB is a very interesting company, which brings a novel and refreshingly new approach to retail. As the current retail environment experiences a major disruption, this might just be the right time for such an entry.
While the expected annual return of 17.1% seems very rewarding, investors are well-advised to further analyze the company before investing. Only if one is truly convinced by XELB’s novel approach to retail, the stock should be considered for purchase.
*
This article was written in collaboration with Christoph Wolf from Christoph Wolf Value Investing
Stig Brodersen is the host of the business podcast “We Study Billionaires.” You can find his free intrinsic value index here of popular stock picks.
0 notes
Text
The Intrinsic Value of Vitamin Shoppe, Inc.
Introduction
Vitamin Shoppe, Inc. is a leading global retailer and manufacturer of nutritional products. Vitamin Shoppe manufactures and brands its own products, in addition to also manufacturing a variety of white-label products for third-parties. Its proprietary brands include BodyTech, True Athlete, and ProBioCare. Coupled with its e-commerce store, Vitamin Shoppe has approximately 750 physical stores spread across its two brands, Vitamin Shoppe, and Super Supplements.
At the time of this writing, Vitamin Shoppe, Inc.’s market capitalization is about $94 million, which has been cut from nearly $2 billion as recently as early-2013. Its revenue and cash flows for the 2018 fiscal year were $1.1 billion and $62 million, respectively. Its stock has hit a 52-week low of $3.32 and a 52-week high of $13.95. At today’s price of $4.34, is the stock undervalued?
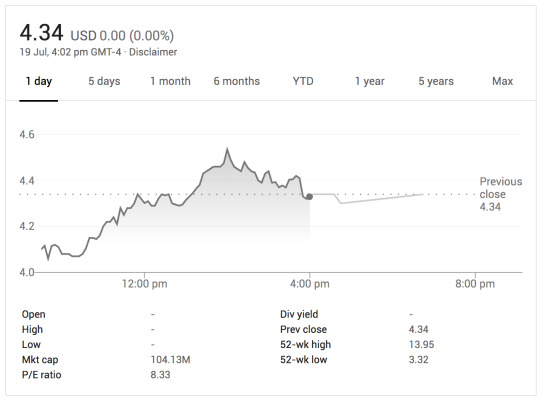
Source: Google Finance
The Intrinsic Value of Vitamin Shoppe, Inc.
With net income being easily manipulated and not a true representation of the cash available to a company’s owners, we prefer to use free cash flow to value a company’s stock. Using free cash flow instead of net income allows investors to value the company based on the actual cash it generated for its owners. Below is a chart of VSI’s free cash flow for the past ten years.

From its 2009 level of $22 million, Vitamin Shoppe, Inc. was able to grow its free cash flow to over $60 million in 2018, a compounded annual growth rate (CAGR) of 11%. However, this growth was not linear. Vitamin Shoppe, Inc.’s free cash flow generation was volatile without much of a dependable trend. Had 2018 not been its strongest year in over a decade, Vitamin Shoppe, Inc.’s cash flow would have contracted since 2009. The various risks discussed in detail in the ‘Risks’ section below may illustrate some of the causes of Vitamin Shoppe, Inc.’s volatile free cash flow generation, as well as potential issues it may face into the future.
To value Vitamin Shoppe, Inc.’s stock, its future free cash flows must be estimated. To do this, the array model below has been developed to account for three potential outcomes of Vitamin Shoppe, Inc.’s future free cash flows.

The upper-bound line (red) illustrates a -10% contraction rate with a 15% probability of occurrence. The middle line (blue) represents a -33% contraction with a 50% probability of occurrence. Finally, the lower-bound (green) line illustrates a -50% contraction with a 35% probability of occurrence. The contraction in Vitamin Shoppe, Inc.’s free cash flow generation is assuming that competitors and online retailers continue to disrupt the retail industry, Vitamin Shoppe, Inc.’s management fails in its strategies to expand its physical store footprint, its agreement with the US Navy isn’t material, and the United States economy enters into a recessionary period over the next one to three years, resulting in a significant slowdown in consumer spending.
Looking at these growth rates and probabilities, you will notice there is a drastic skew towards negative growth/contraction over the next decade. This may seem quite pessimistic, which it is, but it also allows for a conservative valuation and to consider the potential downside risk. While protecting downside risk is almost always important when investing, I see it as even more important in a situation like with Vitamin Shoppe, Inc. The stock may appear undervalued on a quantitative basis, which we will visit in the next part of this article, but there are two important considerations that must be addressed when analyzing Vitamin Shoppe, Inc.’s stock: 1) The base off which the future free cash flow growth is calculated, and 2) the momentum of the stock, before arriving at an “undervalued” conclusion.
When looking at our estimates for Vitamin Shoppe, Inc.’s future free cash flow generation, it is being estimated off of the most current year’s levels (2018). The reason this can potentially be an issue if overlooked is because this free cash flow figure is much higher than 2017, and is the highest in the last decade. This means that 2019 is being estimated off of a high base and subsequent years are continuing to be estimated off of this potentially misleading figure. If 2018 levels had been more in line with previous years, the estimate for 2019 and subsequent years would be significantly less, which would reduce Vitamin Shoppe, Inc.’s value. While this does not necessarily indicate that Vitamin Shoppe, Inc.’s stock is overvalued, it is an important consideration that needs to be thought about when completing a quantitative analysis, as we did.
Second, it is also important to consider the current momentum of the stock. Even if a stock may appear to be undervalued on a quantitative basis, it can continue in a downtrend for a significant period of time if it is showing negative momentum, resulting in a test on an investors emotions and psychology. In the TIP Finance chart below, you can see that Vitamin Shoppe, Inc.’s stock is currently in a negative momentum trend, which furthers my concern regarding it being a potential “falling knife” or “value trap.”
When creating a valuation model, one must consider the economic environment in which their investment would be made. In today’s environment, it is likely wise to estimate growth rates very conservatively with a margin of safety. Any outperformance of the conservative growth rates would provide investors with additional returns above and beyond what was expected.
It is also important to recognize that the above-estimated contraction rates are not expected to be exact each and every year over the next decade. In fact, that is very unlikely. Vitamin Shoppe, Inc.’s results will likely fluctuate from year-to-year. We do not attempt to estimate results on a yearly basis. Rather, we look to estimate accurate growth/contraction rates annualized over five to ten years.
Assuming the estimated outcomes discussed above prove accurate, Vitamin Shoppe, Inc.’s stock may be priced at a 13.7% annual return at today’s price of $4.34.
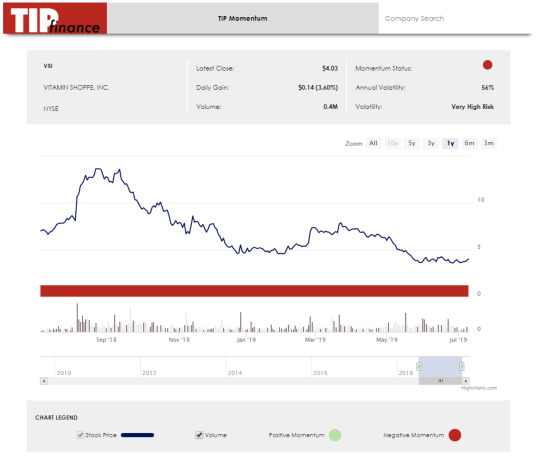
Source: TIP Finance
The Competitive Advantage of Vitamin Shoppe, Inc.
VSI’s competitive advantages will be discussed in detail below:
Brand. While VSI does face significant competition with many of its products, it does have a very strong brand. VSI’s products are very well known across the world and are known for being high-quality. It will be able to leverage its strong brand as the company continues to expand and compete with other retailers.
Diversified Business. Its diversified business model provides various avenues for potential growth, while also providing a hedge against competitive pressures. As the health and wellness industry continues to grow, VSI can take advantage of this buy, increasing its focus on manufacturing and white-labeling products to third-party companies. If its in-house brands continue to feel pressure, it can be offset by increasing its focus on white-label manufacturing.
Risk Factors
Let’s look at the potential risks that can offset Vitamin Shoppe, Inc.’s competitive advantages discussed above:
Relatively Weak Balance Sheet. Its balance sheet is heading in the right direction – management has paid off all of its short-term debt, and it is paying down its long-term debt. However, it has very little cash on its balance sheet, and a significant portion of its assets are tied up in “Other long-term assets” and “Property, Plant & Equipment.”
Severe Competition. With the strong growth in the popularity of the health and wellness industry over the last five to seven years, there has been a massive influx of competition into the industry. Not only is it facing competition from other traditional players, but it is facing increased competition from independent providers and influencers. Influencers have been able to disrupt markets by using their following and marketplaces like Alibaba and AliExpress to source products. If you combine the significant growth in new and strengthening competitors with the issues being faced by physical retailers (due to Amazon), Vitamin Shoppe, Inc. is faced with competitive pressures it may not be able to overcome.
Economy. Many of Vitamin Shoppe, Inc.’s products are discretionary and premium. This means that if/when the economy enters tough times, Vitamin Shoppe, Inc. is going to have weaker demand for its products in two-fold because, 1) consumers do not need its products, and 2) its products are expensive. When consumers have less disposable income, they will cut their spending on supplements, or transition away from the premium brands towards more affordable products.
Opportunity Costs
Although opportunity costs will not appear in your brokerage statements, it is a very real cost to investors that must be considered. When making an investment, an investor makes the conscious decision to forego other investment opportunities for the one chosen. Despite having a positive real result, an investment could actually be negative when considering opportunity costs if capital is not allocated to its most efficient use. Vitamin Shoppe, Inc. is currently priced to return better results than the 10-year treasury and the S&P 500 over the next decade, but it may not offer the best risk-adjusted return in comparison to other individual companies.
Macro Factors
Attempting to time the market is rarely a recipe for success when investing, but it would likely be unwise to not at least consider the overall macro environment. Specifically, with brick-and-mortar retailers like Vitamin Shoppe, Inc., economic conditions play a pivot role in their success. During a recessionary period, consumer spending is significantly reduced, and retailers see their sales plummet. Unemployment is currently at, or near, 50-year lows, and U.S. private debt levels have exceeded previous major financial crisis. With various economic indicators pointing to a potential peak, an investor should consider protecting oneself from an economic downturn.
Summary
On a quantitative basis, Vitamin Shoppe, Inc. appears to fall well into Benjamin Graham’s “cigar-butt” category or potentially a Warren Buffett value-investment. However, the negative momentum trend illustrated by the TIP Finance tool raises concern and may point to a value-trap more than a value-opportunity.
Vitamin Shoppe, Inc. provides a great example for investors of when they must look past the numbers and consider the qualitative side of the business. Purely quantitatively speaking, Vitamin Shoppe, Inc. would be a buy, but when you consider its negative momentum, the headwinds it faces, and the risks involved, an investor must carefully weigh the risk-reward opportunity presented. If you decide, based on your risk tolerance and holding period, that Vitamin Shoppe, Inc. provides a value-opportunity rather a value-trap, with more potential upside than downside, it is recommended you consider your portfolio allocation strongly when initiating your position. Given the assumptions outlined in this analysis, a return of approximately 13.7% can be expected at today’s prices.
*Disclaimer: The author does not currently hold any ownership in Vitamin Shoppe, Inc. (VSI) and has no intentions of initiating a position over the next 72 hours.
This article was written in collaboration with Robert Leonard from “The Investor’s Podcast.”
Stig Brodersen is the host of the business podcast “We Study Billionaires.” You can find his free intrinsic value index here of popular stock picks.
0 notes
Text
The Intrinsic Value of Stamps.com
Introduction
Stamps.com is a leading provider of Internet-based mailing and shipping solutions both in Europe and the U.S. The company offers customers the possibility to print postage approved by the United States Postal Service (USPS), requiring only a PC and a printer.
The firm operates under multiple brands like Stamps.com, Endicia, ShipWorks, ShipStation, or Metapack and offers its services both to individuals, small businesses, and large corporations.
Stamps.com has managed to grow revenue dramatically from $10 million in 2009 to $273 million in 2018. During this time, EPS rose from $0.38 to $8.99, and book value increased from $4.82 to $36.95 – an annual increase of 41.6% and 25.1% respectively.

Due to these very high growth rates, Stamps.com used to be a darling of Wall Street, trading as high as $285 only one year ago. But then the company experienced a double blow in 2019. Firstly, its exclusive relationship with USPS via Negotiated Service Agreement (NSA) was ended. Three months later, USPS also announced its intention to renegotiate the NSAs from existing resellers, thus also cutting this indirect relationship between STMP and USPS.
Both issues are highly problematic for Stamps.com since they strongly affect the core of its business model. As Stamps.com has already drastically reduced its earnings and revenue guidance, the stock dropped like a stone and trades for currently $46.33. Is Stamps.com now a bargain worth buying or are the risks for its business models too great?
The Intrinsic Value of Stamps.com
To determine the value of Stamps.com, let’s start by looking at the company’s history of free cash flow. The free cash flow is important because it represents the company’s ability to retain earnings and grow the business. Most importantly, it demonstrates a return on the principal that might be invested into the ownership of equity of the business. Below is a chart of Stamp.com’s free cash flow over the past years.

The growth in free cash flow surely looks impressive – but due to multiple recent obstacles, this growth cannot be expected to continue in the next years. In fact, even a drop in free cash flow seems highly likely. We will, therefore, use a very conservative estimate for Stamps.com’s future cash flows.

Each line in the above graph represents a certain probability for occurring. We assume a 10% probability for the upper band to be 0% annually, and for the most likely scenario, we estimate an annual decline of 7%, which we assign a 50% probability. The worst-case scenario could be a contraction of 15% every year, that is considered quite possible. We estimate the probability of that to happen to be 40%.
Assuming these growth rates and probabilities are accurate, Stamps.com can be expected to give a 23.7% annual return at the current price of $46.33. Now, let’s discuss how and why those free cash flows could be achieved.
The Competitive Advantage of Stamps.com
Stamps.com possesses some unique advantages that should allow it to be successful in the future:
Leading Provider. Stamps.com remains by far the leading provider of internet-based shipping solutions. This position could also give Stamps.com clout when dealing with the USPS. While there are other USPS-approved PC postage services like EasyPost and Pitney Bowes, Stamps.com offers a superior user interface and a larger number of features.
Sticky business. Stamps.com’s churn rate (the percentage of subscribers that are discontinuing their subscriptions) in the latest quarter was a very low 2.9%. This indicates that customers tend to stay loyal and seem to be satisfied with the offer from Stamps.com.
Chances due to canceled USPS deal. One must bear in mind, that Stamps.com decided to cancel the NSA with USPS, not the other way around. While the risks of this move are obvious, it also gives Stamps.com new possibilities, since it is no longer bound by this rather restrictive agreement. Now Stamps.com can do more deals and agreements with other players.
Opportunity Costs
When looking at various investment opportunities on the market today, let’s compare the expected return of Stamps.com to other ideas. First, one could invest in the ten-year treasury bond, which is producing a 2.04% return. Considering the bond is completely impacted by inflation, the real return of this option is likely only around 1%. Currently, the S&P 500 Shiller P/E ratio is 29.75. As a result, the US Stock market is priced at a 3.36% yield. If one were to invest in the S&P500, they might purchase a low-cost ETF to take advantage of this return.
Macro Factors
The mailing and shipping business is vast and will only grow more important in the future. While Stamps.com is a leading provider of Internet-based mailing and shipping solutions in the U.S. and Europe, this large business attracts multiple competitors. Users have many other ways to use the services of USPS, and there are also many other private carriers, package manifesting systems, and enterprise software solutions that offer easy mailing and shipping systems.
Until recently, the NSA with the USPS gave Stamps.com a huge advantage over these competitors. It remains to be seen, how successful Stamps.com can operate without this competitive advantage. The market might also experience a major disruption in the future if, for example, Amazon delivers much or even all of its shipping itself.
Risk Factors
Several risks might limit the growth prospects of Stamps.com:
End of NSA with USPS. In February 2019, the company announced that it ends its exclusive relationship via Negotiated Service Agreement (NSA) with the U.S. Postal Service. As a result of the company drastically decreased its sales and earnings targets and lowered its guidance. This is especially problematic because many of Stamps.com’s customers were lured by its favorable USPS prices due to the NSA. No longer able to offers such cheap prices, Stamps.com may lose both customers and see a drop in its margins.
Renegotiating of NSAs between USPS and its resellers. In May 2019, the USPS announced its intention to renegotiate its existing NSAs with its resellers. This might also threaten the indirect relationship of Stamps.com with the USPS using these intermediate companies.
Amazon’s aggressive expansion into the shipping market. Amazon is both friend and foe for Stamps.com. The deliveries of Amazon’s postage accounted for a whopping 88% of Stamps.com’s revenue. This makes Stamps.com very dependent on Amazon, which is especially risky since Amazon explores several ways to deliver its goods itself – thus no longer relying on Stamps.com’s services.
Goodwill. Stamps.com’s impressive growth was at least partly realized by multiple acquisitions. As a result, the company has currently $385 million goodwill on its balance sheet, which is more than half of its market capitalization. If this huge amount of goodwill has to be written down in the future, earnings can easily become negative. On the positive side, Stamps.com’s debt level seems sustainable and does not yet raise a red flag.
Summary
Stamps.com is an intriguing company. On the one hand, its historical performance has been breathtaking and has included very high growth rates in revenue, earnings, free cash flow, and book value. The company is an important player in a vast global market that can be expected to remain relevant for the foreseeable future.
On the other hand, its whole business model has been completely turned upside down by the cancellation of the NSA with the USPS and the renegotiation of the NSAs between the USPS and its resellers. Obviously, this makes Stamps.com’s future path highly uncertain and the business in five years will probably look very different from the one today.
Although risky, the decision to cut the relationship with the USPS also holds interesting opportunities for Stamps.com. While the USPS remains relevant, its numbers and influence have been declining for years. Doing “business as usual” with the USPS would therefore also have carried risks for Stamps.com.
At this point, it is quite hard to determine if this is a bargain or a value trap. If Stamps.com manages to prosper within the new business environment, this stock could offer vast returns of 23.7% annually. If not, things can go downhill very fast. Before investing in Stamps.com, investors are well-advised to investigate the company in more detail.
*
This article was written in collaboration with Christoph Wolf from Christoph Wolf Value Investing
Stig Brodersen is the host of the business podcast “We Study Billionaires.” You can find his free intrinsic value index here of popular stock picks.
0 notes
Text
The Intrinsic Value of GNC Holdings, Inc.
Introduction
GNC Holdings, Inc. is a leading multinational health and wellness brand which is a manufacturing and retail business at its core. GNC manufactures its own branded products, while also manufacturing white-label products for third-party companies. Its retail segment consists of company-owned physical stores, franchise locations, and e-commerce. Of its 8,500 locations, approximately 75% of them are in the United States, while the remaining 25% of stores are spread across about 50 different countries. Through its physical and online stores, GNC sells performance and diet supplements, vitamins, health and beauty products, other food and drink products, and general sports-related goods.
At the time of this writing, GNC’s market capitalization is about $120 million, which has been cut from over $4 billion as recently as mid-2015. Its revenue and cash flows for the 2018 fiscal year were $2.4 billion and $77 million, respectively. Its stock has hit a 52-week low of $1.32 and a 52-week high of $4.65. At today’s price of $1.42, is the stock undervalued?
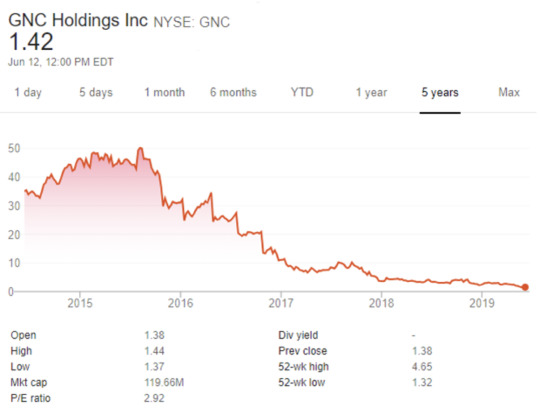
Source: Google Finance
The Intrinsic Value of GNC Holdings, Inc.
With net income being easily manipulated and not a true representation of the cash available to a company’s owners, we prefer to use free cash flow to value a company’s stock. Using free cash flow instead of net income allows investors to value the company based on the actual cash it generated for its owners. Below is a chart of GNC’s free cash flow for the past ten years.

From the bottom of the Housing Crisis in 2008-2009 to its peak in 2015, GNC was able to grow its cash flow from $85 million to over $309 million, a compounded annual growth rate (CAGR) of 20%. However, since then, it’s cash flow has been in a near free fall. Its 2018 free cash flow was $8 million lower than it was a decade ago. The various risks discussed in detail in the “Risks” section below illustrate the causes of this large decline.
To value GNC’s stock, its future free cash flows must be estimated. To do this, the array model below has been developed to account for three potential outcomes of GNC’s future free cash flows.

The upper-bound line (red) illustrates a -15% contraction rate with a 15% probability of occurrence. The middle line (blue) represents a -33% contraction with a 50% probability of occurrence. Finally, the lower-bound (green) line illustrates a -50% contraction with a 35% probability of occurrence. The contraction in GNC’s free cash flow generation is assuming that competitors and online retailers continue to disrupt the retail industry, GNC’s management fails in its strategic and joint venture initiatives, and the United States economy enters into a recessionary period, resulting in a significant slowdown in consumer spending.
Looking at these growth rates and probabilities, you will notice there is a drastic skew towards negative growth/contraction over the next decade. This may seem quite pessimistic, which it is, but it also allows for a conservative valuation and to consider the potential downside risk. While protecting downside risk is almost always important when making an investment, I see it as even more important in a situation like GNC. The stock may appear undervalued on a quantitative basis, which we will visit in the next part of this article, but the momentum of the stock has been very strong downwards, leading to a potential “falling knife” or “value-trap” situation.
When creating a valuation model, one must consider the economic environment in which their investment would be made. In today’s environment, it is likely wise to estimate growth rates very conservatively with a margin of safety. Any outperformance of the conservative growth rates would provide investors with additional returns above and beyond what was expected.
It is also important to recognize that the above-estimated contraction rates are not expected to be exact each and every year over the next decade. In fact, that is very unlikely. GNC’s results will likely fluctuate from year-to-year. We do not attempt to estimate results on a yearly basis; rather we look to estimate accurate growth/contraction rates annualized over 5-10 years.
Assuming the estimated outcomes discussed above prove accurate, GNC’s stock may be priced at an 11.3% annual return at today’s price of $1.42.
Two other valuable quantitative metrics to consider when analyzing a stock’s potential return are the earnings yield (inverse P/E) and free cash flow yield (inverse P/FCF). At the time of this writing, GNC’s current earnings and free cash flow yields are 34.2% and 111.1%, respectively. This is due to its low P/E ratio of just 2.92x and its P/FCF ratio of just 0.90x. Its earnings and free cash flow yields are significantly above our DCF analysis and are at levels that are not realistic. In many cases, these yields are indicative of the potential return an investor might earn by owning a stock, but not always – as we can see here with GNC. This example provides investors with a reminder that an investment cannot be made blindly based solely on quantitative metrics with the expectation of actually obtaining those returns. An investor must consider other quantitative factors, as well as qualitative factors when developing an investment thesis.
Given the abnormally and likely unrealistically high yields just discussed, GNC appears to be priced significantly better than the S&P 500 and the industry average on an earnings and free cash flow yield basis. This relationship is not unexpected as it is indicative of investors having a much higher required rate of return when investing in a struggling individual company than they do when investing in a broad index, like the S&P 500. The graph below illustrates the earnings and free cash flow yields for GNC, the S&P500, and the industry average.

Up to this point, everything quantitative about GNC’s valuation indicates it may be undervalued and priced to outperform the S&P 500 over the next decade. However, before we come to that as our final conclusion, let’s further compare GNC to its competitors.
In the graph below, you will see GNC’s valuation metrics compared to that of the industry’s average on a P/E, P/B, P/S, and P/FCF basis. GNC currently trades at a significant discount to the industry averages on a P/E, P/S, and a P/FCF basis (GNC’s book value is negative, so its P/B value is incalculable). Given GNC’s risks that we will discuss in the next section, it is reasonable to believe that GNC should trade at a discount to the overall industry. The size of the discount is subjective to the investor; if you believe that GNC’s risks are overstated by the market and it shouldn’t trade at this deep of a discount to its competitors, you may consider the stock undervalued. However, if you believe the market is rightly capturing the risks facing GNC, then the discount may be warranted.

The Competitive Advantage of GNC Holdings, Inc.
GNC’s competitive advantages will be discussed in detail below:
Brand. While GNC does face significant competition with many of its products, it does have a very strong brand. GNC’s supplements and overall health products are very well known across the world and are known for being high-quality. It will be able to leverage its strong brand as the company continues to expand internationally.
Diversified Business. Its diversified business model provides various avenues for potential growth, while also providing a hedge against competitive pressures. As the health and wellness industry continues to grow, GNC has the ability to take advantage of this buy, increasing its focus on manufacturing and white-labeling products to third-party companies.
Risk Factors
Let’s look at the potential risks that can offset GNC’s competitive advantages discussed above:
Weak Balance Sheet. GNC appears to have a fairly strong cash position (1.14x its market cap), but in comparison to its debt levels, it is immaterial and misleading. It currently has nearly $900 million in debt, in addition to $518 million in capital leases, $175 million in accounts payable, and over $250 million in “other long-term liabilities.” Also, a significant portion of its assets is not easily usable to generate cash or growth the business. Over $800 million of its $1.7 billion in assets is tied up in intangible assets and “other long-term assets.” Its debt-heavy and cash-light balance sheet does not allow for GNC to take advantage of potential opportunities that may arise.
Severe Competition. With the strong growth in the popularity of the health and wellness industry over the last 5-7 years, there has been a massive influx of competition into the industry. Combine the significant growth in new and strengthening competitors with the issues being faced by physical retailers (due to Amazon), GNC is faced with competitive pressures; it may not be able to overcome.
Economy. Many of GNC’s products are discretionary and premium. This means that if/when the economy enters into tough times, GNC is going to have significantly weaker demand for its products in two-fold because, 1) consumers do not need its products, and 2) its products are premium and expensive. When consumers have less disposable income, they will cut their spending on supplements, or transition away from the premium brands like GNC towards more affordable products.
Opportunity Costs
Although opportunity costs will not appear in your brokerage statements, it is a very real cost to investors that must be considered. When making an investment, an investor makes the conscious decision to forgo other investment opportunities for the one chosen. Despite having a positive real result, an investment could actually be negative when considering opportunity costs if capital is not allocated to its most successful and efficient use. GNC is currently priced to return better results than the 10-year treasury and the S&P 500 over the next decade, but it may not offer the best risk-adjusted return in comparison to other individual companies.
Macro Factors
Attempting to time the market is rarely a recipe for success when investing, but it would likely be unwise to not at least consider the overall macro environment. Specifically, with brick-and-mortar retailers and premium brands like GNC, economic conditions play a pivot role in their success. During a recessionary period, consumer spending is significantly reduced, and retailers see their sales plummet. Unemployment is currently at, or near, 50-year lows, and U.S. private debt levels have exceeded previous major financial crisis. With various economic indicators pointing to a potential peak, an investor should consider protecting oneself from an economic downturn.
Summary
On a quantitative basis, GNC appears to be a perfect Benjamin Graham “cigar-butt” or potentially Warren Buffett “value-investment.” However, the momentum of GNC’s stock indicates investors seeking a value opportunity might be instead purchasing into a value-trap. GNC provides a great example for investors of when they must look past the numbers and consider the qualitative side of the business. Purely quantitatively speaking, GNC would be a buy, but when you consider the headwinds it faces and the risks involved, an investor must carefully weigh the risk-reward opportunity presented. If you decide, based on your risk tolerance, that GNC provides a valuable opportunity rather a value-trap, with more potential upside than downside, it is recommended you consider your portfolio allocation strongly when initiating your position. Given the assumptions outlined in this analysis, a return of approximately 11.3% can be expected at today’s prices.
Disclaimer: The author does not currently hold any ownership in GNC Holdings, Inc. (GNC) and has no intentions of initiating a position over the next 72 hours.
This article was written in collaboration with Robert Leonard from “The Investor’s Podcast.”
Stig Brodersen is the host of the business podcast “We Study Billionaires.” You can find his free intrinsic value index here of popular stock picks.
0 notes
Text
The Intrinsic Value of Kohl’s Corporation
Introduction
With over 1,150 stores across 49 states and its headquarters in Menomonee Falls, Wisconsin, Kohl’s Corporation is one of the United States largest traditional brick-and-mortar department stores. It has a wide range of product offerings, ranging from men’s and women’s clothing to cosmetics to home furnishings. Within its stores, it carries numerous national brands, such as Oakley, PUMA, and Adidas, as well as its own portfolio of exclusive brands (Simply Vera Vera Wang, LC Lauren Conrad, and Apt. 9).

At the time of this writing, the market capitalization for Kohl’s is about $8.34 billion and its revenue and cash flows for the 2018 fiscal year were $20.2 billion and $1.5 billion, respectively. Currently trading at about $51.83, the stock has hit a 52-week low of $50.40 and a 52-week high of $83.28. At today’s price of $51.83, is its stock undervalued?
The Intrinsic Value of Kohl’s Corporation
With the net income being easily manipulated and not a true representation of the cash available to a company’s owners, we prefer to use free cash flow to value a company’s stock. Using free cash flow instead of net income allows investors to value the company based on the actual cash it generated for its owners. Below is a chart of Kohl’s free cash flow for the past ten years.

With the exception of 2012, Kohl’s free cash flow has remained in a range between about $800 million and $1.4 billion from 2010 to 2017, as illustrated by the lines on the graph below. There certainly has been volatility from year to year, but it has been successful in maintaining relatively consistent free cash flow generation as e-commerce companies have attempted to replace traditional retailers. Looking at Kohl’s free cash flow more closely from 2012 to present, it appears it may be slightly trending upwards as it has made higher lows and higher highs. In future sections when we value the company, we will not rely on growth in free cash flow, but it is important to note that it may be trending upwards.

From 2009 to 2018, Kohl’s free cash flow actually contracted by about 2.5%, cumulatively. From its low in 2012, Kohl’s free cash flow has grown from $915 million to $1.5 billion, for a compounded annual growth rate (CAGR) of about 5.9% (67% cumulatively).
To value Kohl’s stock, its future free cash flows must be estimated. To do this, the array model below has been developed to account for three potential outcomes of Kohl’s future free cash flows.
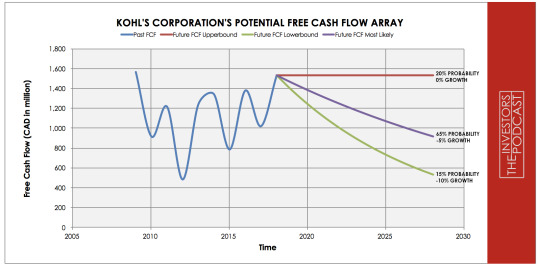
The upper-bound line illustrates a 0% growth rate with a 20% probability of occurrence. This growth rate was assigned to allow for the potential of management to successfully maintaining its current free cash flow levels, while also considering the highly competitive nature of the retail landscape.
The middle line represents a -5% contraction with a 65% probability of occurrence. This outcome assumes that Kohl’s will be semi-successful competing in the increasingly competitive and changing retail industry, but will still see some of its free cash flow diminish.
Finally, the lower-bound line illustrates a -10% contraction with a 15% probability of occurrence. The contraction in Kohl’s free cash flow generation is assuming that competitors and online retailers continue to disrupt the retail industry, Kohl’s management fails in its new strategic initiatives, and the United States economy enters into a recessionary period, resulting in a significant slowdown in consumer spending.
Looking at these growth rates and probabilities, you will notice there is a skew towards negative growth or a contraction over the next decade. This may seem pessimistic, but it allows for a conservative valuation and to consider the potential downside risk. When creating a valuation model, one must consider the economic environment in which their investment would be made.
In today’s environment, it is likely wise to estimate growth rates very conservatively with a margin of safety. Any outperformance of the conservative growth rates would provide investors with additional returns above and beyond what was expected. It is also important to recognize that the above-estimated growth rates are not expected to be exact each and every year over the next decade. In fact, that is very unlikely. As they have since 2009, Kohl’s results will likely fluctuate from year-to-year. We do not attempt to estimate results on a yearly basis. Rather, we look to estimate accurate growth rates annualized over a decade. Assuming the estimated outcomes discussed above prove accurate, Kohl’s stock may be priced at a 13.1% annual return at today’s price.
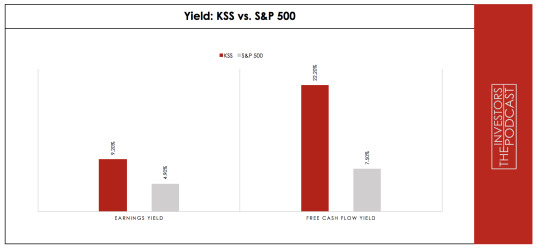
Two other valuable quantitative metrics to consider when analyzing a stock’s potential return are the earnings yield (inverse P/E) and the free cash flow yield (inverse P/FCF). At the time of this writing, Kohl’s current earnings and free cash flow yields are 9.2% and 22.2% respectively. Its earnings and free cash flow yields appear to be below and above our calculated expected return from our DCF analysis. Kohl’s also appears to be priced moderately better than the S&P 500 on an earnings yield basis and significantly better on a free cash flow yield basis. This relationship is not unexpected as it is indicative of investors having a higher required rate of return when investing in an individual company than they do when investing in a broad index, like the S&P 500, but it also puts into perspective the extra return an investor might be able to achieve by taking on more risk. The graph below illustrates the earnings and free cash flow yields for Kohl’s and the S&P 500.
Source: Morningstar
Up to this point, everything quantitative about Kohl’s valuation indicates it may be undervalued and priced to outperform the S&P 500 over the next decade. However, before we come to that as our final conclusion, let’s compare Kohl’s to its competitors.
In the graph below, you will see Kohl’s valuation metrics compared to that of the industry’s average on a P/E, P/B, P/S, and P/FCF basis. It is quite close on all of these metrics. Given Kohl’s competitive advantages that we will discuss in the next section, it is reasonable that Kohl’s should trade at a slight premium to the overall industry.

Source: Morningstar
The Competitive Advantage of Kohl’s Corporation
Kohl’s has multiple advantages that will be discussed in detail below:
Management. While other companies and management teams have struggled to adjust to the changing retail landscape, Kohl’s management team has excelled. It has been willing to think “outside-the-box” and look for unconventional ways to drive traffic to the stores and ignite growth. It has entered into two strategic partnerships (one with Amazon and one with Planet Fitness) that really help illustrates management’s ability to differentiate itself from its competitors.
Financial Strength. Despite a difficult environment over the past decade, Kohl’s has been able to grow its topline revenue, maintain high Returns on Equity and Returns on Invested Capital, pay down its debt and preserve a healthy cash position. It has consistently raised its dividend every year since 2012 and has bought back nearly half its stock.
Rewards/Loyalty Program. As illustrated from the likes of Starbucks and Domino’s, customer loyalty programs can drive great customer retention. Kohl’s is widely known for its “Kohl’s Cash” rewards program, which management continues to focus on and improve. This has helped management successfully achieve positive comp sales year over year, while many retailers are struggling to get customers to return to its stores.
Risk Factors
Although Kohl’s has competitive advantages, it is not without risks that could weaken an investor’s returns.
Severe Competition. It is no secret that the retail industry has become extremely competitive over the last 5-7 years, and this trend continues to this day. In addition to competing with major brick-and-mortar and e-commerce players like Walmart and Amazon, Kohl’s is increasingly having to compete with individual sellers and small businesses through platforms such as Etsy.
Lack of Switching Costs/Stickiness. When it comes to buying well-known, non-exclusive brands, consumers do not generally have a preference where they purchase the products from – their main focus is on price. It is difficult to convince customers to continually purchase products from Kohl’s when there are other stores offering the same products at a cheaper price.
Lack of Bargaining and Pricing Power. Due to the dynamic discussed in the previous bullet, this makes for a difficult bargaining and pricing power relationship for the retailers, such as Kohl’s. In general, an $11 billion retailer like Kohl’s cannot demand significantly better pricing from a major brand and/or manufacturer than other large, $290 billion retailers like Walmart can. This reduces its bargaining power and limits its ability to improve margins through lower cost of goods. On the other end of the transaction, Kohl’s also struggles with a lack of pricing power. Kohl’s cannot consistently demand a significantly higher price for its products when customers are able to get the same product at another retailer for a lower price. Lack of power on both the bargaining and pricing sides leads to increased pressure on Kohl’s margins.
Protecting Customer Data. With mass amounts of customer data, retailers have become a target for hackers. In 2018 alone, nine retailers (Macy’s, Adidas, Sears, Kmart, Best Buy, Saks Fifth Avenue, Lord & Taylor, Forever 21, and Gamestop) were victims of data breaches. It can be a short-term problem if handled appropriately, but it still poses a major risk to companies in possession of large amounts of valuable data.
Opportunity Costs
Although opportunity costs will not appear in your brokerage statements, it is a very real cost to investors that must be considered. When making an investment, an investor makes the conscious decision to forgo other investment opportunities for the one chosen. Despite having a positive real result, an investment could actually be negative when considering opportunity costs if capital is not allocated to its most successful and efficient use. Kohl’s is currently priced to return better results than the 10-year treasury and the S&P 500 over the next decade, but it may not offer the best risk-adjusted return in comparison to other individual companies.
Macro Factors
Attempting to time the market is rarely a recipe for success when investing, but it would likely be unwise to not at least consider the overall macro environment. Specifically, with brick-and-mortar retailers like Kohl’s, economic conditions play a pivot role in their success. During a recessionary period, consumer spending is significantly reduced, and retailers see their sales plummet. Unemployed is currently at, or near, 50-year lows, and US private debt levels have exceeded previous major financial crisis. With various economic indicators pointing to a potential peak, an investor should consider protecting oneself from an economic downturn.
Summary
While the current conditions of the retail industry have attracted many value investors, it is recommended you do extra due diligence when researching individual companies to help combat against the possibility of a value-trap.
Kohl’s skilled management and its ability to identify and implement intriguing strategic partnerships add potential upside that most retailers do not have. Although both initiatives are still in their infancy, Kohl’s has recently expanded its return-program partnership with Amazon to all its stores and plans to lease space to Planet Fitness next to ten of its stores this year. These characteristics do provide exciting potential upside, but the risks must not be forgotten. It currently trades at a discount to our calculated intrinsic value, but the risks may prove severe and dampen expected returns. Given the assumptions outlined in this analysis, a return of approximately 13.1% can be expected at today’s price.
Disclaimer: The author does not currently hold any ownership in Kohl’s (KSS), but may initiate a long position in KSS over the next 72 hours.
This article was written in collaboration with Robert Leonard from “The Investor’s Podcast.”
Stig Brodersen is the host of the business podcast “We Study Billionaires.” You can find his free intrinsic value index here of popular stock picks.
0 notes
Text
The Intrinsic Value of Schaeffler
Introduction
Schaeffler is a German supplier for automotive and industrial companies. Their products include parts and systems for engines, gearbox, chassis, as well as ball bearing, and friction bearing. Their business is divided into three units.
Automotive OEM is by far the largest segment. This unit creates solutions for all major automotive companies. Besides the traditional combustion engine, hybrid and electric propulsion systems are also developed here. Automotive Aftermarket is a new unit, which deals with all aspects of automotive spare parts. The Industry unit sells various components and systems for rotative and linear movement to multiple different industrial companies.
Schaeffler has recently run into problems and issued several profit warnings and reduced its guidance. Due to declining margins and a generally harsher business environment, Schaeffler’s stock price has fallen from its high of more than €16 at the end of 2017 to a price of only €7.26 euros today. Is this a bargain or do the increased risks outweigh the stock’s cheap price?

The Intrinsic Value of Schaeffler
To determine the value of Schaeffler, let’s start by looking at the company’s history of free cash flow. The free cash flow is important because it represents the company’s ability to retain earnings and grow the business. Most importantly, it demonstrates a return on the principal that might be invested into the ownership of equity of the business. Below is a chart of Schaeffler’s free cash flow over the past years.

As one can see, the cash flows have been trending upward with a high volatility. This is due to the cyclical business it is operating in. As a consequence of this additional risk, we will use a conservative estimate for Schaeffler’s future cash flows.

Each line in the above graph represents a certain probability for occurring. The upper growth rate of 5% is slightly higher than the approximate annual growth during the last seven years and is given a 25% chance. As most probable, we consider a small annual increase of 3%, which is in line with expected GDP growth. For this scenario, we assigned a probability of 50%. The worst case is assumed to be a sharp decline of 5% annually, which might be caused by a severe recession or if Schaeffler’s current problems cannot be resolved. We estimate the chance for this happening at 25%.
Assuming these growth rates and probabilities are accurate, Schaeffler can be expected to give a 7.6 % annual return at the current price of 7.26 euros. Now, let’s discuss how and why those free cash flows could be achieved.
The Competitive Advantage of Schaeffler
Schaeffler possesses some unique advantages that should allow it to be successful in the future:
Consistent Revenue Growth. Over the last seven years, Schaeffler increased revenue consistently by an annual average of more than 4%. While the current stronger focus on profitability should limit this vast growth, the company is growing its sales even during this period of uncertainty.
Innovative Company. For the last five years, Schaeffler has been the company with the second-most claimed patents in Germany. This is very impressive for such a small firm and is vital due to the rapidly changing business environment that Schaeffler is operating in. The company is strong both in e-mobility and autonomous driving. Its “Space Drive” system is a unique adaptive drive and steering system, which enables severely disabled persons to drive.
Crucial Link in Worldwide Supply Chains. Another reason for the company’s moat is its position in the global supply chains. Since these structures are highly complex and globalized, replacing Schaeffler with another company would result in high switching costs for a customer. This further stabilizes Schaeffler’s position.
Solid Balance Sheet. Although Schaeffler’s business is capital-intensive and the company has strongly expanded over the last years, its debt load remains manageable and even has vastly declined over the last few years. This was possible due to consistently positive and strong free cash flows.
Opportunity Costs
When looking at various investment opportunities on the market today, let’s compare the expected return of Schaeffler to other ideas. First, one could invest in the ten-year treasury bond which is producing a 2.43% return. Considering the bond is completely impacted by inflation, the real return of this option is likely only around 1%. Currently, the S&P 500 Shiller P/E ratio is 29.86. According to this valuation metric, the US Stock market is priced at a 3.4% yield. If one were to invest in the S&P 500, they might purchase a low-cost ETF to take advantage of this return.
Macro Factors
As a car supplier, Schaeffler is deeply ingrained in the global car supply chains, which is a double-edged sword. On the one hand, the company is a vital part of the chain, which gives it a high barrier of entry. Its business is capital-intensive, relies on long-established connections and includes much know-how that would be costly to replicate. But while Schaeffler’s position within the current supply chain seems safe, there are two major threats.
Firstly, the health of the current supply chain can come under threat. This might happen because of increased trade barriers and cooling of the world economy. Secondly, the nature of the chain itself is expected to change dramatically in the next years. The traditionally-used combustion engine will be replaced by electric or hybrid propulsion systems, and also autonomous driving adds a completely new element to the development of cars. While Schaeffler is engaged in all of these new technologies, this is a new business environment for the firm, which includes high costs and risks.
Risk Factors
Several risks might limit the growth prospects of Schaeffler:
Dependency on Global Car Sales. Car sales are very cyclical and closely connected to the state of the world economy. If another global recession strikes or if car sales drop because of other reasons, demand for Schaeffler’s products would fall. Also, imposed tariffs could increase the price of cars, which adds pressure to car sales.
Protectionism. Increased trade barriers pose multiple threats to Schaeffler. It can increase its production costs, make it costlier to ship its products to its customers, and also dampen car sales in general.
Dramatically changing the car sales market. Cars in twenty years will very likely be quite different than the one we see today. Electric cars or autonomous driving will have a vast impact on the industry, which adds uncertainty. Schaeffler is already investing in electric and hybrid propulsion systems, but this undertaking is costly, and the exact direction the car market will take is yet unclear.
Summary
Schaeffler is a very interesting company. The firm possesses a strong position in the global car supply chain – which also makes it vulnerable to the health and nature of this chain. If global car sales fall or electric propulsion systems and autonomous vehicles change the nature of driving, Schaeffler’s business model is under threat.
Reassuringly, the company has invested heavily in these new technologies, but this incurs high costs and risks – and forces Schaeffler to operate in a new and yet relatively unknown business environment. If the current price of 7.26 euros and an expected annual return of 7.6% adequately compensate for this risk should be further investigated before buying this stock.
*
This article was written in collaboration with Christoph Wolf from Christoph Wolf Value Investing
Stig Brodersen is the host of the business podcast “We Study Billionaires.” You can find his free intrinsic value index here of popular stock picks.
0 notes
Text
The Intrinsic Value of Tillys Inc.
Introduction
With 229 stores spread across the United States and its headquarters in Irvine, California, Tillys is a specialty brick-and-mortar apparel retailer with a growing e-commerce platform. Through its larger-than-average physical stores and its online store, Tillys sells various well-known brands, such as Nike, Vans, Adidas, and RVCA, as well as its own exclusive brands (Full Tilt, RSQ, Sky & Sparrow, White Fawn, Ivy + Main, and Blue Crown).
At the time of this writing, Tillys’ market capitalization is about $352 million and its revenue and cash flows for the 2018 fiscal year* were $598 million and $32 million, respectively. Currently trading at about $11.82, the stock has hit a 52-week low of $10.19 and a 52-week high of $25.46. At today’s price of $11.82, is Tillys’ stock undervalued?

*Note on Tillys’ Fiscal Years from its Annual Report: “Our fiscal year ends on the Saturday closest to January 31. For example, “fiscal 2018” refers to the fiscal year ended February 2, 2019; “fiscal 2017” refers to the fiscal year ended February 3, 2018; and “fiscal 2016” refers to the fiscal year ended January 28, 2017.
The Intrinsic Value of Tillys
With net income being easily manipulated and not a true representation of the cash available to a company’s owners, we will use Tillys’ free cash flow to value its stock. Using the free cash flow allows investors to value the company based on the actual cash it generated, which can be used to reinvest in the business, pay dividends, or buy back its own stock. Below is a chart of Tillys’ free cash flow for the past ten years.

Tillys’ free cash flow saw strong growth the three years prior to its Initial Public Offering (IPO) on May 4th, 2012. Likely in an attempt to win over the public markets, management began reinvesting heavily in the business, which significantly increased its capital expenditures (CapEx) and therefore reducing its free cash flow. After 2014, its most capital-intensive year over the past decade, management scaled back its CapEx spending in 2015 and continues to do so to this day. This reduced CapEx spending over the past five years has led to a generally increasing free cash flow trend, as illustrated by the black arrows in the graph below.

From 2010 to 2019, Tillys’ free cash flow grew from $18 million to $32 million, for a compounded annual growth rate (CAGR) of 6% (78% cumulatively).
To value Tillys’ stock, its future free cash flows must be estimated. To do this, the array model below has been developed to account for three potential outcomes of Tillys’ future free cash flows.
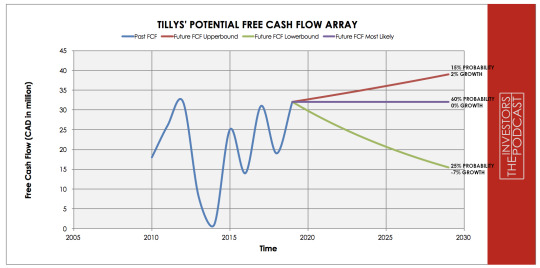
The upper-bound line illustrates a 2% growth rate with a 15% probability of occurrence. This growth rate was determined by using the United States governments’ target inflation rate of 2%, as well as discounting Tillys’ current earnings yield (inverse P/E ratio) by about two-thirds (66%) in order to build in a margin of safety for the risks we will visit in the ‘Risks’ section below. It was assigned this probability to allow for the potential of some growth - conservatively estimated at the country’s target inflation rate - while also accounting for the challenges Tillys would face in the coming years, as its previously obtained growth rates are unlikely to materialize again over the next decade.
The middle line represents a 0% growth rate with a 60% probability of occurrence. This outcome assumes that Tillys will face competitive and economic pressure, but will be able to maintain its current free cash flow levels by using its large stores to provide an above-average experience for its customers and further improving its online presence.
Finally, the lower-bound line illustrates a -7% contraction with a 25% probability of occurrence. The contraction in Tillys’ free cash flow generation is assuming that online retailers, such as Amazon, continue to disrupt the retail industry and that the United States economy enters into a recessionary period, resulting in a significant slowdown in consumer spending on discretionary items.
The noticeable pessimistic skew of growth rates and probabilities to the downside and the 85% probability that Tillys will have zero or negative growth over the next decade may appear high, but this is to allow for a conservative valuation. Given where we currently are in the market cycle, it is likely wise for investors to err on the side of caution when creating valuation models, as we have done here. It certainly is possible for Tillys to outperform these estimates, but it behooves investors to add in a margin of safety and be a bit defensive, especially in market conditions like today. If the expected return is satisfactory with conservative estimates, any outperformance of these growth rates will provide investors with an added bonus.
It is also important to recognize that the above-estimated growth rates are not expected to be exact every year for the next decade. The growth rate is expected on an annualized basis. As they have from 2014 to 2019, Tillys’ results will likely fluctuate from year-to-year. We shall not try to estimate those results; rather we look to estimate accurate growth rates annualized over the next decade. Assuming the estimated outcomes discussed above prove accurate, Tillys’ stock may be priced at a 7.0% annual return at today’s price.
Two other valuable quantitative metrics to consider when considering a stock’s return are the earnings yield and free cash flow yield. At the time of this writing, Tillys’ current earnings and free cash flow yields (inverse P/FCF ratio) are 7.1% and 9.1%, respectively. Its earnings and free cash flow yields both illustrate a similar expected return to that of our discounted cash flow (DCF) analysis above. Tillys also appears to be priced for a better-expected return over the next decade than does the S&P 500. The graph below illustrates the earnings and free cash flow yields for Tillys and the S&P 500.

The Competitive Advantage of Tillys
Tillys has multiple advantages that will be discussed in detail below:
Financial Strength. As of its most recent 10-K, Tillys cash and cash equivalents total about $15 million more than its total liabilities. It has no debt, a growing cash position, and inventory levels that have remained satisfactory. Tillys current and quick ratios are 2.2 and 1.5, respectively. Over the last decade, it has shown revenue and free cash flow growth, while maintaining its margins. These characteristics not only allow Tillys to be in a position to take advantage of future opportunities, but it should also help the company weather an economic downturn.
Omnichannel Strategy. Tillys has been successfully implementing an omnichannel strategy that provides its customers with a better, more streamlined experience. Customers are able to purchase products through its e-commerce platform and pick them up in-store. This is an important feature, specifically for clothing retailers, because purchasing clothes/shoes/accessories online has been notoriously frowned upon by consumers. However, Tillys is able to provide a more pleasant experience for customers by allowing them to be able to see the items online and then trying the items on in-store – often preceding the tedious online shopping return process that might arise from purchasing clothing through other online retailers, such as Amazon.
Customer Experience. Tillys’ management team has been successfully following the trend of improving the customer experience to compete with online retailers. The physical stores have been designed to not only carry the trendiest clothing but to also provide a great atmosphere to shop. Tillys is also launching a promotion called “Second Saturdays” in which they host in-store parties. The success of this venture is yet to be seen, but it illustrates management’s focus on improving the customer experience.
Risk Factors
Although Tillys has competitive advantages, it is not without risks that could weaken an investor’s returns.
Large Stores. Tillys’ large stores are the proverbial double-edged sword. They allow Tillys to differentiate itself from its most direct competitors (Pac Sun and Zumiez) by carrying a much larger variety of products and being a destination retailer. When the economy is strong, this plays into Tillys hand by benefiting from strong consumer spending, but when the economy takes a turn for the worse, it has significantly more overhead than its competitors with a smaller store format.
Severe Competition. Tillys not only has competition from online retailers and other brick-and-mortar retailers, but it is also competing directly with the brands it sells, such as Nike. It is competing directly with the major brands it sells in two different ways; The first, Tillys has its own exclusive brands that it sells, which competes in-store with other well-known brands. The second, well-known brands have begun cutting out the middle-man, Tillys in this case, to go directly to the consumer. The rise of e-commerce and the strength of their brands has allowed large consumer brands to sell directly to its customers through its own online stores.
Lack of Switching Costs/Stickiness. Customers cannot get Tillys’ RSQ or Ivy + Main products in other stores, but they can get products very similar, as well as the other major consumer brands, in other stores. Customers are able to go to Pac Sun, Zumiez, Foot Locker, Target, Walmart, or various other stores to purchase many of the well-known non-exclusive brands that Tillys carries without suffering from any switching costs.
Opportunity Costs
It is not enough to simply analyze a company in isolation and make an investment decision. Investors must compare the expected return of one investment with the others available in the market. We previously saw that based on earnings and free cash flow yields, Tillys is expected to outperform the S&P 500 over the next decade. We also saw that our free cash flow estimates for Tillys led to a potential annual return of about 7.0%. Assuming the S&P 500 reverts to its long-term mean Shiller P/E ratio from its current level of about 29.4, the expected return for the S&P 500 is -1.4%. 10-year treasuries are currently yielding 2.451% at the time of this writing. These three comparisons indicate that Tillys may outperform the S&P 500 and 10-year treasuries over the next decade. However, there may be other individual stocks that offer a similar, or better, risk-adjusted return.
Macro Factors
Although individual investors should not attempt to time the market, it would be unwise to not at least consider the overall macro environment when making an investment decision. According to one of Warren Buffett’s favorite market valuation indicators, Wilshire 5000 Total Market Cap vs. GDP, the overall market is significantly overvalued, and at one of its most expensive points since 1971. The Wilshire 5000 Total Market Cap is currently at 163% of GDP, which is 63% higher than the peak before the Housing Crisis and 45% higher than the peak before the Dot Com Bubble.
The S&P 500 is currently priced over 70% higher than its historical average on a Shiller P/E basis. Unemployment is current at, or near, 50-year lows, and U.S. private debt levels have exceeded the previous financial crisis. It is not possible to accurately estimate when a downturn will come, but economic and stock market characteristics are pointing towards a potential peak.
Summary
Buffett recommends, “be fearful when others are greedy, and greedy when others are fearful.” The market is certainly being fearful towards the retail sector, which indicates there may be an intriguing opportunity for value investors. However, investors must also be careful of falling victim to a value-trap, which many retail companies have been as of late (for example, Bed Bath and Beyond and JC Penney).
Tillys is currently selling at a discount to our calculated intrinsic value due to its economic risk, large overhead costs, competition, lack of switching costs, and being a part of a sector that is out of favor. These risks are very real, and investors must consider them, but when doing so, they must be objectively and realistically compared to the potential upside and advantages Tillys has. Given the assumptions outlined in this analysis, a return of 7% can be expected.
Disclaimer: The author does not currently hold any ownership in Tillys (TLYS) and does not expect to within the next 72 hours.
This article was written in collaboration with Robert Leonard from “The Investor’s Podcast.”
Stig Brodersen is the host of the business podcast “We Study Billionaires.” You can find his free intrinsic value index here of popular stock picks.
0 notes
Text
The Intrinsic Value of I Got Games Inc.
Introduction
I Got Games Inc. is mobile game developer headquartered in Singapore with regional offices in the United States, mainland China, Canada, Hong Kong, South Korea, Belarus, Philippines, Japan, Thailand, and the United Arab Emirates. Despite being a small-cap company, IGGGF’s games have become some of the most popular across the globe, with over 480 million users across more than 200 countries. Its major hits include Lords Mobile and Castle Clash. Its revenue is generated via in-app purchases to enhance the game-playing experience.
At the time of writing, IGGGF’s market cap is about $1.7 billion and its revenue and cash flows for the 2018 fiscal year were $749 million and $234 million, respectively. Currently trading at $1.35, the stock has hit a 52-week low of $0.98 and a 52-week high of $1.65. At today’s price of $1.35, is IGGGF’s stock undervalued?

The Intrinsic Value of I Got Games Inc.
With net income being easily manipulated and not a true representation of the cash a business generated throughout the year, we will turn to IGGGF’s free cash flow to value its stock. Using free cash flow allows investors to value the company based on its actual cash generated that can be used to reinvest in the business, pay dividends, or buy back its own stock. Below is a chart of IGGGF’s free cash flow for the past seven years.

Starting in 2012, IGGGF had relatively minimal cash flow due to its limited game portfolio. However, in the latter half of 2013, one of IGG’s hit games, Castle Clash, was released. This led to cash flow generation increasing more than 7.5x from 2012 to 2014. With a small lapse in time before its next hit would be released, free cash flow dipped slightly in 2015. After its next hit, Lords Mobile, was released in early 2016, its free cash flow began growing rapidly again and has continued to do so through 2018. From 2012 to 2018, IGGGF’s free cash flow grew from just $9 million to $234 million, for a CAGR of 59% (2,500% cumulatively).
To value IGGGF’s stock, its future free cash flows must be estimated. To do this, the array model below has been developed to account for three potential outcomes of IGGGF’s future free cash flows.
The upper-bound line illustrates a 10% growth rate with a 15% probability of occurrence. This growth rate was determined using IGGGF’s current earnings yield (inverse P/E ratio), a slightly lower free cash flow yield (invest P/FCF ratio), and assuming it is able to turn a few of its currently in-development-games into future hits. It was assigned this probability to allow for the potential of high rates of growth in the short-term, while also accounting for the deceleration that is expected in later years, as IGGGF’s previously obtained growth rates are unsustainable over the long-term.
The middle line represents a 5% growth rate with a 55% probability of occurrence. This outcome assumes that IGGGF will be faced with competitive pressures but will be able to use its competitive advantages to produce popular and profitable games into the future.
Finally, the lower-bound line illustrates a -10% contraction with a 30% probability of occurrence. The contraction in IGGGF’s free cash flow generation is assuming its current portfolio of games slowly declines, and its pipeline fails to deliver promising results.
The 30% probability of occurrence for a -10% contraction may appear high, but this is to allow for a conservative valuation. Given where we are currently in the market cycle, it is likely wise for investors to err on the side of caution, which is what we have done here with this valuation. It is certainly possible for IGG to outperform these estimates, but it behooves investors to add in a margin of safety and be a bit defensive.
It is also important to recognize that the above growth rates are not expected to be exact every year for the next decade. The growth rates are to be expected on an annualized basis. IGG’s results will likely fluctuate from year-to-year, we shall not try to estimate those results, rather we look to estimate accurate growth rates annualized over the next decade.
Assuming the estimated outcomes discussed above prove accurate, IGG may be priced at a 14.5% annual return at today’s price.
Two other valuable quantitative metrics to consider when considering a stock's return are the earnings yield and free cash flow yield. At the time of this writing, IGGGF’s current earnings and free cash flow yields are 9.52% and 12.05%, respectively. The graph below illustrates the earnings and free cash flow yields for IGGGF and the S&P 500.
To increase our confidence in our previous valuations and to determine if other valuation metrics support our estimates, we will analyze IGGGF’s relative valuation to its peers. As seen in the graph below, IGGGF trades at less than one-third its industry average on P/E and P/FCF basis – arguably our two most heavily weighted metrics – and nearly one-half its industry average on a P/S basis. These three relative valuation metrics may indicate that IGGGF’ stock is undervalued in relation to its competitors, at today’s prices. You may be wondering about the P/B ratio; you’ll see that IGGGF is actually more expensive than its peers on a P/B basis. Given how the P/B ratio is calculated and that technology companies, of which IGGGF is, do not generally have many physical assets, the P/B ratio and its relative valuation do not carry material weight when valuing IGGGF’s stock. If we were valuing a manufacturing business heavily dependent on physical assets to operate its business, the P/B ratio would be far more important. However, given the lack of dependence on physical assets for technology companies, the slight overvalue result on a P/B basis is not of major concern.
Source: Morningstar
The Competitive Advantage of I Got Games Inc.
I Got Games Inc. has multiple advantages that will be discussed in detail below:
Customer Service and Involvement. You may be a bit surprised this is the first competitive advantage listed, especially for a mobile game developer, but that is exactly why it is so powerful and has worked so well for IGGGF – none of its competitors have this focus. Management doesn’t just simply state that customer service, and involvement is its priority, it proves it by listing exactly how many customer inquiries its customer service team fielded and through which mediums.

Source: 2018 Annual Report
IGGGF also promotes customer involvement by hosting real-life, live, offline gaming tournaments, trade shows, and game shows. This unparalleled level of customer service and involvement has allowed IGGGF to extend the lifespan of its games, improve and cement its brand, and prove its commitment to high-quality customer experience.

Source: 2018 Annual Report
Quality and Brand. While the focus on customer service and involvement improves the quality of the overall customer experience, management takes it a step further by using the interactions with its customers to further improve its games’ quality. IGGGF can use these customer interactions to gather data on changes that need to be made to its current games to improve them, as well as what customers are looking for in future games. IGGGF’s numerous awards year in and year out prove its strategy and ability to produce high-quality games are successful. Customers have also consistently verified the quality of IGGGF’s games by rating them highly in the app stores.
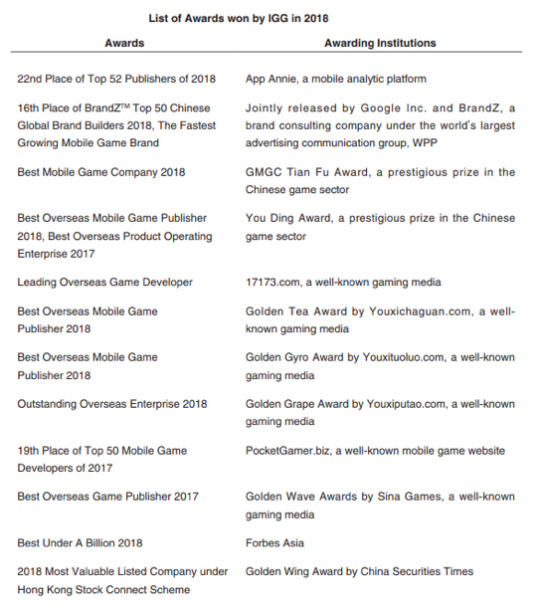
Source: 2018 Annual Report
Pipeline. As recent as the first two months of 2019, IGGGF has been able to prove the value of its pipeline. In early 2019, IGGGF released “Mobile Royale,” which attracted more 4 million registered users within just two months of its release date. This game was not created on a whim or acquired; it is a game that was developed entirely through IGGGF’s pipeline. IGGGF also notes it has multiple high-potential games in its pipeline currently, such as sequels to Castle Clash and Clash of Lords, and sandbox and casual games.
Intellectual Property. The combination of the three previously discussed competitive advantages has led to IGGGF’s intellectual property becoming extremely valuable and a competitive advantage in and of itself. IGGGF is now able to use its intellectual property to not only produce more gaming content but also produce memorabilia and novelty products for its customers and fans to purchase.
Streaming Subsidiary. IGGGF has a little-known subsidiary called PocketSocial, Inc., which is developing StreamCraft – a live stream gaming platform. This venture is in its early stage and management does not provide much guidance regarding it, but its popularity in the app stores, number of downloads, and the overall trend towards live streaming gaming illustrate the major potential competitive advantage IGGGF is currently holding close to its chest. Remember, Amazon recently purchased a similar company, Twitch, for just under $1 billion.
Strong Management, High Insider Ownership, and Great Corporate Culture. Time in and time out management continues to show its ability to successfully lead IGGGF’s business. It is in tune with the ever-changing gaming and technology markets and is putting its business in a place to succeed. The two co-founders are also both active in the business, with Zong Jian Cai serving as the Chief Executive Officer and Chairman of the Board, while Yuan Chi is a non-executive adviser. Management and insider interests are aligned well with shareholders through its 30% ownership stake. The executives and management team at IGGGF also take great care of its employees and foster an entrepreneurial and innovative environment.

Financial Strength. IGGGF is an abnormal tech company in the sense that it is cash rich, has no debt, and is actually profitable. Tech companies, especially in today’s market, are notorious for losing significant amounts of money and being ridden with debt. For IGGGF, it has current and quick ratios of 2.87 and 2.82, respectively. Its cash and cash equivalents alone are more than 2.4x its total liabilities. It has a history of strong revenue, income, and free cash flow growth. These characteristics not only allow IGGGF to be in a position to take advantage of future opportunities, but it also allows the company to weather a significant downturn relatively unscathed.

Risk Factors
Although IGGGF has strong competitive advantages and bright opportunities ahead, it is not without risks that could weaken an investor's returns.
Concentration of Revenue. Nearly 95% of IGGGF’s revenue came from just two games, with 80% coming from just one game. Lords Mobile and Castle Clash account for 80.1% and 14.7% of IGGGF’s revenue, respectively, with “other” accounting for just 5.2%. Relying so heavily on one revenue stream can lead to detrimental results if something were to impact negatively, or even remove, that income source.
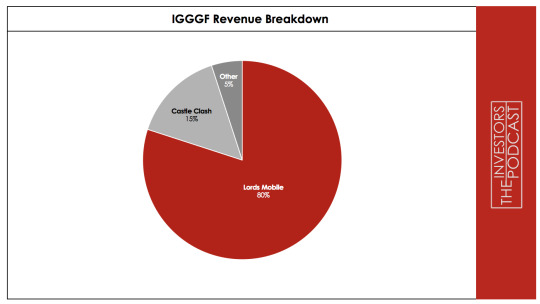
Severe Competition. The mobile gaming and app development space are extremely competitive. Not only is IGGGF competing against other mobile game and app developers, but in general sense, they are competing against all companies that provide entertainment. Arguably, any company that provides entertainment that could take time away from customers playing IGGGF’s games is a competitor. There are also relatively low barriers to entry to the mobile gaming and app development industry. Technological improvements have allowed nearly anyone with a computer to code apps.
Lack of Switching Costs/Stickiness. There are very little switching costs, and therefore very little stickiness to IGGGF’s games. Users do not generally incur actual expenses to switch from one game to another; Their “switching costs” are only the value of previous in-app purchases that are surrendered when switching games. If a user exhausts all value from their in-app purchases before switching games, they have no switching costs. This dynamic can lead to relatively short-term and minimal stickiness for IGGGF’s games.
International Exposure. Being an organization based internationally, IGGGF is open to foreign risks such as political, foreign exchange rate, different accounting policies, and corruption.
Size, Exchange, and Lack of Liquidity. These risks do not directly impact IGGGF’s business, rather than impact the investor. IGGGF’s small-cap designation, trading on the OTC Markets in the US, and an illiquid stock can make for volatile prices and inefficient marketing pricing for irrational periods of time. The lack of trading volume can also make it difficult for an investor to exit their position when hoped.
Opportunity Costs
It is not enough to simply analyze a company in isolation and make an investment decision. Investors must compare that expected investment result with the others available in the market. We previously saw that based on earnings and free cash flow yields, IGGGF is expected to significantly outperform the S&P 500 over the next decade. We also saw that our free cash flow estimates for IGGGF lead to a potential annual return of about 13-14%. Assuming the S&P 500 reverts to its long-term mean Shiller P/E ratio from its current level of 29.4, the expected return for the S&P 500 is -1.6%. 10-year treasuries are currently yielding 2.52% at the time of this writing. These three comparisons indicate that IGGGF may significantly outperform the S&P 500 and 10-year treasuries over the next decade. However, there may be other individual stocks that offer a similar, or better, risk-adjusted return.
Macro Factors
Although individual investors should not attempt to time the market, it would be unwise to not at least consider the overall macro environment when making an investment decision. According to one of Warren Buffett’s favorite market valuation indicators, Wilshire 5000 Total Market Cap vs. GDP, the overall market is significantly overvalued, and at its most expensive point since 1971. The Wilshire 5000 Total Market Cap is currently at 162% of GDP, which is 62% higher than the peak before the Housing Crisis and 44% higher than the peak before the Dot Com Bubble.
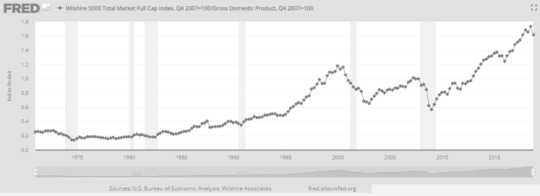
Source: Fred, St. Louis Fed
The S&P 500 is currently priced over 70% higher than its historical average on a Shiller P/E basis. Unemployment is currently at, or near, 50-year lows, and US private debt levels have crossed the previous financial crisis. It is not possible to accurately estimate when a downturn is coming, but economic and stock market characteristics are telling investors that we may be reaching a peak.
Summary
IGGGF is currently selling at a discount to our calculated intrinsic value due to its revenue concentration, competition, international risks, lack of switching costs, and its size. These are very real risks that investors must weigh, but they should be realistically compared to the potential upside from IGGGF’s competitive advantages.
IGGGF has a great management team, significant ownership, great margins, non-capital-intensive business (low capex), growing income and cash flow statements, very healthy balance sheet with a lot of cash, multiple competitive advantages, and a promising game pipeline and streaming service.
The projected return of 14.5% is based on quite conservative assumptions and does not take into consideration the significant upside IGGGF would have if its StreamCraft offering continues to grow.
*Disclaimer: The author holds fractional ownership in I Got Games, Inc. (IGGGF).
This article was written in collaboration with Robert Leonard from “The Investor’s Podcast.”
Stig Brodersen is the host of the business podcast “We Study Billionaires.” You can find his free intrinsic value index here of popular stock picks.
0 notes
Text
The Intrinsic Value of Network-1 Technologies Inc.
Introduction
Network-1 Technologies Inc. is a U.S. based communications equipment company whose principal business involves the development, licensing, and protection of intellectual property. At the time of writing, the firm’s market cap stands at around $59 Million and its revenues and free cash flows for the previous financial year were around $16 Million and $6 Million respectively. The company’s common stock has fluctuated between a high of $3.25 and a low of $2.00 over the past 52 weeks and currently stands at $2.48. Is Network-1 Technologies Inc. undervalued at the current price?

The Intrinsic Value of Network-1 Technologies Inc.
To determine the intrinsic value of Network-1 Technologies Inc., we’ll begin by looking at the company’s history of free cash flow. A company’s free cash flow is the true earnings which management can either reinvest for growth or distribute back to shareholders in the form of dividends and share buybacks. Below is a chart of Network-1 Technologies Inc.’s free cash flow for the past ten years.

As can be seen, the firm’s free cash flow has fluctuated significantly over the past decade. This is a result of the fact that the company receives money to license its patents in either lump sums or through ongoing royalty payments. The firm must also enforce its patent protection through legal proceedings which can result in delays in payments. In order to determine Network-1 Technologies Inc.’s intrinsic value, an estimate must be made of its potential future free cash flows. To build this estimate, there is an array of potential outcomes for future free cash flows in the graph below.
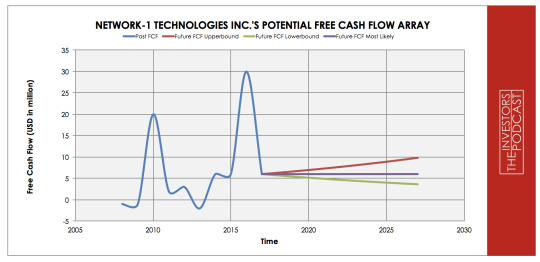
When examining the array of lines moving into the future, each one represents a certain probability of occurrence. The upper-bound line represents a 5% growth rate which assumes that the firm’s future free cash flow growth is driving by additional patent acquisitions and through the firm’s recently investment the clinical stage biotech company, ILiAD Biotechnologies. This upper growth line has been assigned a 20% probability of occurrence to account for the uncertainties associated with securing future profits from subsequent patents and investments.
The middle growth line represents a 0% growth rate which assumes future free cash flow does not increase. This scenario assumes that the firm does not successfully win ongoing legal proceedings and that its recent patent additions and investments do not progress favorably. This growth rate has been assigned a 60% probability of occurrence to account for the uncertainty which currently surrounds the company.
The lower bound line represents a -5% rate in free cash flow growth and assumes that the company suffers a period of contraction in earnings due to future patent expirations. This growth rate has been assigned a 20% probability of occurrence.
Assuming these potential outcomes and corresponding cash flows are accurately represented, Network-1 Technologies Inc. might be priced at an 8.4% annual return if the company can be purchased at today’s price. We’ll now look at some other valuation metrics to see if they correspond with this estimate.
Network-1 Technologies ’s current free cash flow yield, which is the inverse of its Price/FCF ratio, is 15.25%. This is based on a ttm free cash flow of $9 Mil, assuming a $6 Mil free cash flow, which the firm achieved in three of the last four years, would result in a 10.16% free cash flow yield.Finally, we’ll look at Network-1 Technologies Inc.’s book value growth and dividend yield to see whether this supports our other estimates of growth. Year-on-Year book value has grown at an annualized rate of around 6%, and the current dividend yield stands at around 4%. Assuming Network-1 Technologies can grow its book value at a similar rate for the next ten years and its current dividend yield can at least be maintained, the firm should return around 10% at the current price.
Taking all these points into consideration, it seems reasonable to assume that Network-1 Technologies Inc. may return between 8-10% at the current price if the estimated free cash flows are achieved. Now, let’s discuss how and why these estimated free cash flows could be achieved.
The Competitive Advantage of Network-1 Technologies Inc.
Network-1 Technologies Inc. has various competitive advantages outlined below.
Intangible Assets. Network-1 Technologies currently holds a portfolio of 28 patents which protect its proprietary technology. These intangible assets are the primary source of earnings for the company, and it aggressively protects them through legal action.
o The Remote Power Patent covering the delivery of power over Ethernet (PoE) cables for the purpose of remotely powering network devices, such as wireless access ports, IP phones, and network-based cameras; o The Mirror Worlds patent portfolio (the “Mirror Worlds Patent Portfolio”) relating to foundational technologies that enable unified search and indexing, displaying and archiving of documents in a computer system; o The Cox patent portfolio in relating to enabling technology for identifying media content on the Internet and taking further action to be performed based on such identification; and o Patents covering systems and methods for the transmission of audio, video, and data over computer and telephony networks in order to achieve a high quality of service (QoS) (the “Qos Patents”).
Source: Network-1 Technologies Inc. Company Website
Low-cost Operations. Since Network-1 Technologies Inc. is an intellectual property company which generates earnings from the acquisition, licensing, and enforcement of patents it only requires a small workforce of under ten employees. These low-cost operations allow the firm to achieve performance metrics well more than the Global Communications Equipment Industry averages.
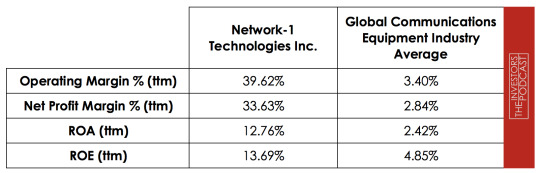
Strong Corporate Culture. Network-1 Technologies Inc’s management is closely aligned with shareholders with insider ownership currently standing at around 26%. The firm has also begun to pay dividends in recent years and has bought back around $15 Mil in shares since 2011. Considering the large levels of cash and equivalents on the balance sheet and the prospect of favorable outcomes in ongoing legal proceedings, the chance exists that these dividends may increase, or a special dividend may be paid.
Network-1 Technologies Inc.’s Risks
Now that Network-1 Technologies Inc.’s competitive advantages have been considered, let’s look at some of the risk factors that could impair my assumptions of investment return.
Network-1 Technologies Inc. currently has multiple legal proceedings in play including those against Hewlett Packard and Google. If these legal proceedings are not resolved in a favorable manner, then the firm stands to not only lose out on $100-200 Mil in potential damages but will be unable to collect royalties from other companies who are withholding payments while legal proceedings are ongoing.
Network-1 Technologies Inc.’s business is dependent on the acquisition and monetization of patents. A number of the patents which have accounted for a significant portion of the firm’s past earnings are set to expire within the next few years. If the company is unable to acquire and successfully monetize new patents, its economic future is likely to be negatively impacted.
Network-1 Technologies Inc. has recently invested in the clinical stage biotechnology company, ILiAD Biotechnologies. There is always an element of risk with the probability of success for clinical trials, and there is no guarantee that this investment will prove a useful allocation of capital for the firm.
Opportunity Costs
Whenever an investment is considered, one must compare it to any alternatives to weigh up the opportunity cost. At the time of writing, 10-year treasuries are yielding 2.63%. If we take inflation into account, the real return is likely to be closer to 1%. The S&P 500 Index is currently trading at a Shiller P/E of 29.4 which is 74% higher than the historical mean of 16.9. Assuming reversion to the mean occurs, the implied future annual return is likely to be -1.6%. Network-1 Technologies Inc., therefore, appears to offer a much better return for investors at present, but other individual stocks may be found which offer a similar return relative to the risk profile.
Macro Factors
Investors must consider macro-economic factors that may impact economic and market performance as this could influence investment returns. At present, the S&P is priced at a Shiller P/E of 29.4. This is 74% higher than the historical average of 16.9 suggesting markets are at elevated levels. U.S. unemployment figures are at a 48-year low suggesting that the current business cycle is nearing its peak. U.S. private debt/GDP currently stands at 202.80% and is at its highest point since 2009 when the last financial crisis prompted private sector deleveraging.
Summary
Network-1 technologies Inc. is currently selling at a discount to fair value due to negative market perception relating to the uncertainties surrounding court proceedings, cash settlements, and withheld royalties’ payments from other licensees. Investors should be aware that there is no guarantee that the company will be successful in its claims of patent infringement against Hewlett Package, Google, and other companies.
Network-1 Technologies Inc. does, however, have a very good track record in winning legal battles based upon patent infringement. The company’s most recent 10-Q notes that;
“In September 2011, we initiated patent litigation against sixteen (16) data equipment manufacturers in the United States District Court for the Eastern District of Texas, Tyler Division, for infringement of our Remote Power Patent. We settled the litigation against fifteen (15) of the sixteen (16) defendants. The remaining defendant in the litigation is Hewlett-Packard Company.”
Given that the company has a strong track record of winning legal battles against companies such as Sony, Motorola, Samsung, and Huawei, it seems reasonable to assume that Network-1 Technologies may be successful in one or more of its current patent infringement cases. If the Hewlett Packard case can be successfully won then, the firm will not only receive a significant sum from the ruling but will also be able to rightly lay claim to unpaid royalties’ payments from Cisco, Dell, and Netgear.
The company is currently in a very strong financial position with no debt to speak of and a formidable liquidity position as evidenced by the firm’s quick ratio of 26.72. As of the most recent quarter, around 93% of the company’s balance sheet is comprised of cash and equivalents. Given that the firm is currently trading at around 1x, book value investors have the potential to make an investment which offers the potential for significant upside with excellent downside protection.
The projected return of 8-10% is based on extremely conservative assumptions for the company and does not take into account the possibility for significant upside if the legal challenges are successful.
In summary, Network-1 Technologies Inc. in an investment with significant upside potential and credible downside protection. Investors must be prepared for continuing uncertainty and patience will be required to see this investment play out. Based on the conservative assumptions used in the analysis of the company, Network-1 Technologies Inc. may return around 8-10% at the current market price. If the firm is successful in the current legal battles it is engaged in, this upside could be much higher.
Disclaimer: The author holds fractional ownership in Network-1 Technologies Inc.
*
This article was written in collaboration with David J. Flood from “The Investor’s Podcast.”
Stig Brodersen is the host of the business podcast “We Study Billionaires.” You can find his free intrinsic value index here of popular stock picks.
0 notes
Text
The Intrinsic Value of Lennar Corporation
Introduction
Lennar Corporation is one of the largest homebuilders in the U.S., focusing on the construction and sale of single-family homes targeted to first-time, move-up, and luxury homebuyers. Its homebuilding operations are made up 89% of consolidated revenues in 2017. The remaining business consists mostly of its financial arm, Lennar Financial Services, which offers mortgages to the buyers of its homes.

At the beginning of 2018, Lennar Corporation merged with CalAtlantic, another of the largest U.S. homebuilders. This immensely increased Lennar Corporation’s footprint in U.S. homebuilding, but also added even more to its already considerable debt pile. Considering that Lennar Corporation’s stock price has fallen from more than $70 in 2018 to only $48 today, is this a bargain investors should consider?
The Intrinsic Value of Lennar Corporation
To determine the value of Lennar Corporation, let’s start by looking at the company’s history of free cash flow. The free cash flow is important because it represents the company’s ability to retain earnings and grow the business. Most importantly, it demonstrates a return on the principal that might be invested into the ownership of equity of the business. Below is a chart of Lennar Corporation’s free cash flow over the past years.

One can see that Lennar Corporation operates in a very cyclical business, which makes it both harder to value and also adds uncertainty. We will, therefore, use caution when modeling the expected future cash flows.
Each line in the above graph represents a certain probability for occurring. We assume a 10% chance for the upper growth rate of 6% per year. The most likely scenario of 3% is based on the approximately expected growth rate of the economy and is assigned a 60% chance. We denote a 30% chance to the possibility of a sharp annual contraction of 8% in case of a severe recession.

Assuming these growth rates and probabilities are accurate, Lennar Corporation can be expected to give a 10.1 % annual return at the current price of $48.5. Now, let’s discuss how and why those free cash flows could be achieved.
The Competitive Advantage of Lennar Corporation
Lennar Corporation possesses some unique advantages that should allow it to be successful in the future:
Economies of Scale. Having merged with CalAtlantic, Lennar Corporation is one of the biggest players in U.S. homebuilding. This gives the company a good position when negotiating with suppliers, banks, and customers.
Brand. Due to its size and long-term experience, Lennar Corporation is a well-known and trusted brand in the homebuilding market. Its size also allows us to run a large marketing program, which further increases visibility and brand recognition.
Vertical integration. By offering both homebuilding and mortgages, Lennar Corporation can profit from the complete value chain when building and selling a home to a customer.
Risk Factors
Several risks might limit the growth prospects of Lennar Corporation:
Strong dependency on U.S. economic conditions. An investment in Lennar Corporation is a bet on a strong U.S. economy. In a downturn, Lennar Corporation will be affected in multiple ways: Demand for homebuilding will decline, more mortgages will turn sour, and write-downs of land will have to be undertaken.
Large debt pile. Due to the acquisition of CalAtlantic, Lennar Corporation’s long-term debt increased to more than $10 billion. This limits Lennar Corporation’s financial flexibility and could be especially dangerous in an economic downturn.
Much competition. Both homebuilding and mortgage lending are highly competitive industries. This can put pressure on Lennar Corporation’s margins and the size of its business operations.
Dependency on Federal Reserve policy. Mortgage rates are strongly connected to the Federal Funds rate. When rates go up, mortgages become more expensive, which both makes homebuilding less attractive and also increases the default rate of mortgages.
Opportunity Costs
When looking at various investing opportunities on the market today, let’s compare the expected return of Lennar Corporation to other ideas. First, one could invest in the ten-year treasury bond, which is producing a 2.67% return. Considering the bond is completely impacted by inflation, the real return of this option is likely only marginally positive. Also, investment in the U.S. stock market does not offer significantly higher returns. Since the S&P 500 Shiller P/E ratio is currently 30.5, the U.S. stock market is priced at a 3.28% yield. If one were to invest in the S&P500, they might purchase a low-cost ETF to take advantage of this return.
Macro Factors
Lennar Corporation’s business is completely based on the state of U.S. homebuilding. This, in turn, is strongly connected to the U.S. economy. When economic growth is strong, unemployment is low, and people feel confident, more citizens are able and confident to invest in a new home.
At the moment, the U.S. economy still runs strong, but there are multiple risks ��� international trade-wars, geopolitical risks, a Chinese slowdown, and a break-up of the eurozone – that can negatively impact the world economy, and in turn also the situation in the U.S. Lennar Corporation’s business success is also connected to the policy of the Federal Reserve since its policy strongly affects mortgage rates.
Summary
Lennar Corporation is a very interesting company. Due to its size, it has a strong position in U.S. homebuilding and reaps benefits due to its vertical integration. It has high visibility and very long experience in its business. The downside is mainly the dependency on the state of homebuilding, the U.S. economy and the actions of the Federal Reserve – all of which are out of Lennar Corporation’s hands. The company is well-run and can be expected to retain its strong position in U.S. homebuilding. Also, the expected annual return of 10.3% seems rewarding. Nevertheless, investors are well-advised to only invest in its stock, if they expect a strong U.S. economy in the next years.
*
This article was written in collaboration with Christoph Wolf from Christoph Wolf Value Investing
Stig Brodersen is the host of the business podcast “We Study Billionaires.” You can find his free intrinsic value index here of popular stock picks.
0 notes
Text
The Intrinsic Value of ADDvantage Technologies Group
Introduction
ADDvantage Technologies Group is a small-cap company with two operating segments. The cable TV part is the legacy business. They sell new, surplus, and refurbished cable television equipment to cable television operators. This business unit has been in steady decline and has just been sold, and the deal is expected to be finalized in Q3 2019. The Telco segment provides new and used telecommunication networking equipment and makes up their new business. ADDvantage Technologies Group started this segment by acquiring Nave in 2014, followed by the takeover of Triton in 2016.
As the company has recently reported a large loss and it is yet unclear if ADDvantage Technologies Group will succeed with this completely new business model, the stock has crashed to only $1.43. Is ADDvantage Technologies Group a bargain or will the company not succeed with the turnaround?

The Intrinsic Value of ADDvantage Technologies Group
To determine the value of ADDvantage Technologies Group, let’s start by looking at the company’s history of free cash flow. The free cash flow is important because it represents the company’s ability to retain earnings and grow the business. Most importantly, it demonstrates a return on the principal that might be invested into the ownership of equity of the business. Below is a chart of ADDvantage Technologies Group’s free cash flow over the past years.
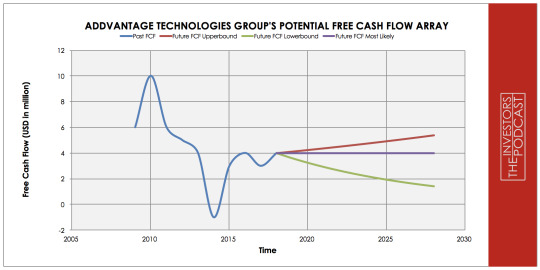
Except for 2014, the free cash flow has been consistently positive and stable. Then, how come the company reported a large net loss recently? This loss was due to several non-cash factors such as goodwill impairment in the cable TV segment, provisions of obsolete inventory, and deferred payments due to the two acquisitions.
Since negative earnings should not be dismissed and there is much uncertainty with this business, we will err on the safe side when estimating the future cash flows.

Each line in the above graph represents a certain probability for occurring. We assume a 10% chance for the upper growth rate of 3% per year. The most likely scenario of zero growth is assigned a 50% chance. We denote a 40% chance to the possibility of a 10% annual contraction.
Assuming these growth rates and probabilities are accurate, ADDvantage Technologies Group can be expected to give a 24.3 % annual return at the current price of $1.43. Now, let’s discuss how and why those free cash flows could be achieved.
The Competitive Advantage of ADDvantage Technologies Group
ADDvantage Technologies Group possesses some unique advantages that should allow it to be successful in the future:
Positive effects of Nave acquisition. In 2014, Nave Communications was bought to kick-off ADDvantage Technologies Group’s Telco business. While this caused many costs and problems, the company has now been fully integrated and grows nicely. ADDvantage Technologies Group also plans to lower costs at this division by moving Nave’s inventory management and order fulfillment to Huntsville, Alabama. The existing facility in Baltimore will be subleased. All of this will reduce operating costs.
Synergies of Triton acquisition. In 2016, ADDvantage Technologies Group bought Triton, which significantly improved the footprint in the Telco segment. While ADDvantage Technologies Group had to downvalue equipment because of this acquisition (which in accounting terms reduced their earnings), the synergies only now start to improve ADDvantage Technologies Group’s business.
Vast recent cashflow injection. ADDvantage Technologies Group sold its Broken Arrow property in Oklahoma for $5 million in late 2018, making ADDvantage Technologies Group debt-free. Currently, the company is divesting its cable TV business for another $10.3 million. This cash gives ADDvantage Technologies Group many possibilities and should cushion any problems with the integration of Triton.
Consistently cash-flow positive. While earnings have recently turned negative, the company has consistently produced free cash flow throughout the last decade (with one small exception in 2014). While the negative earnings should not be completely ignored, this mismatch is mostly an accounting issue. Earnings turned negative because of a $1.2 million goodwill impairment in the cable TV segment, provisions of obsolete inventory, and deferred payments due to the two acquisitions.
Experienced and good management. Having worked as interim-CEO before, Joseph Hard was named permanent CEO at the end of 2017. He has vast experience from his former work as vice president of services at AT&T, as well as management positions at Gordman Networks and Aero Communications. His experience combined with ADDvantage Technologies Group’s history of prudent management – low debt, not overpaying for acquisitions – improve the chances to turn around ADDvantage Technologies Group’s business.
Opportunity Costs
When looking at various investing opportunities on the market today, let’s compare the expected return of ADDvantage Technologies Group to other ideas. First, one could invest in the ten-year treasury bond, which is producing a 2.65% return. Considering the bond is completely impacted by inflation, the real return of this option is likely only marginally positive.
Also, investment in the U.S. stock market does not offer significantly higher returns. Based on the S&P 500 Shiller P/E (“CAPE”) ratio of 29.7, the U.S. stock market is priced at a 3.34% yield. By adjusting the CAPE ratio for fluctuations in the profit margins, John Hussman developed the even more reliable MAPE-ratio. Based on this indicator, expected S&P 500 total returns are negative for the next twelve years. If one were to invest in the S&P500, they might purchase a low-cost ETF to take advantage of this return.
Macro Factors
As the cable TV segment has been in constant decline, ADDvantage Technologies Group’s management was forced to reorganize the company by focusing on the Telco segment. While ADDvantage Technologies Group has already found another niche with Telco, the business of selling old and new telecommunications equipment does not exactly sound exciting, which also explains the low stock price. Since boring businesses are often successful businesses, this lack of enthusiasm for Wall Street might give an opening to value-conscious investors.
The planned 5G expansion in the wireless space by all major U.S. telecommunication carriers should give ADDvantage Technologies Group also a great opening into a new addressable market. To take advantage of this possibility, ADDvantage Technologies Group has recently launched a new wireless infrastructure services business.
Risk Factors
Several risks might limit the growth prospects of ADDvantage Technologies Group:
Disruption due to the selling of a legacy business. ADDvantage Technologies Group’s legacy cable TV segment has been in steady decline and was recently sold off completely. The company has now to run a completely different business based on the Telco business. It is yet not clear if the company will manage to successfully transform itself in this new business environment.
Risk of further impairments. ADDvantage Technologies Group’s inventory can easily become obsolete, requiring further write-downs. This is especially a risk because of the two recent acquisitions. Still, the acquisition of Nave in 2014 is complete, so there should no larger write-ups to be expected. The 2016 Triton acquisition is nevertheless not finished, so the possibility of write-downs of goodwill, intangibles, and inventory cannot be dismissed. The Triton acquisition also requires ADDvantage Technologies Group to make additional deferred payments. All of these issues can or will eat into ADDvantage Technologies Group’s earnings.
Risk of overpaying for acquisitions. Because of the sale of the Broken Arrow property and its cable TV business, ADDvantage Technologies Group is currently flush with cash. While this is surely a good thing, there is the risk that management makes bad decisions because of this available money. The need to invest and “do something” might prompt them to overpay for acquisitions or use the money for other shareholder value- destroying means. Since management seems thoughtful and responsible, this risk can be considered small.
Summary
ADDvantage Technologies Group is currently in the process of completely reorganizing its business. Not surprisingly, this causes many problems and costs, and it is yet not clear if the company will be successful in the new area of the Telco segment. Although earnings have turned negative recently, the company has been consistently able to produce positive free cash flows.
While surely not without risk, the signs so far look rather encouragingly – which makes the projected annual return of 24.3% seem appealing. Since the risk of a failure of the turnaround is nevertheless existing, investors are well-advised to do further research before buying this stock.
Disclaimer: The author does not hold ownership in any of the companies mentioned at the time of writing this article.
*
This article was written in collaboration with Christoph Wolf from Christoph Wolf Value Investing
Stig Brodersen is the host of the business podcast “We Study Billionaires.” You can find his free intrinsic value index here of popular stock picks.
0 notes
Text
The Intrinsic Value of Exco Technologies Ltd.
Introduction
Exco Technologies Ltd. is a Canadian company, which designs, develops, and produces dies, molds, and equipment for the die-cast, extrusion, and automotive industries. The company’s operations are divided into two divisions.
The Casting and Extrusion Segment focuses on die-casting and extrusion tooling, as well as parts for both die-casting and extrusion machines. Its operations are based in the Americas and Thailand, and its customers consist of global automotive and other industries. Exco is the leader in most of these markets. The Automotive Solution Segment is focused on interior trim components and assemblies both for passenger and light truck vehicles. The manufacturing facilities are primarily based in the Americas, and its main customers are automotive industries in North America and Europe.
Considering that Exco Technologies Ltd.’s stock price has fallen from its high of more than 17 CAD in 2015 to a price of only 9.30 CAD today, should investors now consider the stock?

The Intrinsic Value of Exco Technologies Ltd.
To determine the value of Exco Technologies Ltd., let’s start by looking at the company’s history of free cash flow. The free cash flow is important because it represents the company’s ability to retain earnings and grow the business. Most importantly, it demonstrates a return on the principal that might be invested into the ownership of equity of the business. Below is a chart of Exco Technologies Ltd.’s free cash flow over the past years.

As one can see, the cash flows have been trending upward with high volatility. This is due to the cyclical business it is operating in. As a consequence of this additional risk, we will use a conservative estimate for Exco Technologies Ltd.’s future cash flows.

Each line in the above graph represents a certain probability for occurring. The upper growth rate of 9% is based on the approximate annual growth between 2009 and 2018 and is given a 20% chance. As most probably we consider a small annual increase of 4%, this medium growth rate is therefore assigned a probability of 50%. The worst case is assumed to be flat a cash flow, and we guess the chances for this scenario at 30%. Assuming these growth rates and probabilities are accurate, Exco Technologies Ltd. can be expected to give a 7.0 % annual return at the current price of 9.59 CAD. Now, let’s discuss how and why those free cash flows could be achieved.
The Competitive Advantage of Exco Technologies Ltd.
Exco Technologies Ltd. possesses some unique advantages that should allow it to be successful in the future:
Local Leader in many markets in casting and extrusion. Exco Technologies Ltd. is a leader in most global markets in the niche of die-casting and extrusion machines. Since the company has decades-long experience in this field and operates in a capital-intensive environment, the barrier for entry is high. This should shield the company from competitors.
Crucial link in worldwide supply chains. Another reason for the company’s moat is its position in the global supply chains. Since these structures are highly complex and globalized, replacing Exco Technologies Ltd. with another company would result in high switching costs for a customer. This further stabilizes Exco Technologies Ltd.’s position.
Vigilant leaders. Although Exco Technologies Ltd.’s business is very capital-intensive and management has acquired multiple companies over the years, its debt load is very low. This was possible due to consistently strong free cash flows. The business has grown nicely, but mostly organically.
Opportunity Costs
When looking at various investing opportunities on the market today, let’s compare the expected return of Exco Technologies Ltd. to other ideas. First, one could invest in the ten-year treasury bond which is producing a 2.7% return. Considering the bond is completely impacted by inflation, the real return of this option is likely only around 1%. Currently, the S&P 500 Shiller P/E ratio is 28.17. According to this valuation metric, the U.S. Stock market is priced at a 3.5% yield. If one were to invest in the S&P500, they might purchase a low-cost ETF to take advantage of this return.
Macro Factors
Exco Technologies Ltd. is deeply ingrained in the global car supply chains, which is a double-edged sword. On the one hand, the company is a vital part of the chain, which gives it a high barrier of entry. Its business is capital-intensive, relies on long-established connections and is also not large enough to attract serious threats from competitors. Exco Technologies Ltd.’s competitive advantage lies in the fact that it is simply not worth the effort to attempt to grab its market share.
But while Exco Technologies Ltd.’s position within the supply chain seems safe, the company is fully dependent on the health of the chain. Since globalization including free trade across borders is currently threatened on multiple fronts due to protectionism and populism, Exco Technologies Ltd. is highly vulnerable to a reversal of global free trade. Also, if the world economy tanks, a globally operating company like Exco Technologies Ltd. will feel the pressure.

Risk Factors
Several risks might limit the growth prospects of Exco Technologies Ltd.:
The backlash against globalization. Exco Technologies Ltd. produces and sells in multiple countries and is very dependent on a smooth global supply chain. If free trade were restricted by other means, Exco Technologies Ltd. would be hit hard. This risk is mostly political, which makes it very hard to assess and is out of the company’s hands.
Dependency on global car sales. Car sales are very cyclical and closely connected to the state of the world economy. If another global recession strikes or if car sales drop because of other reasons, demand for Exco Technologies Ltd.’s products would fall.
Currency risks. A global company like Exco Technologies Ltd. naturally buys and sells in multiple currencies. Especially the CAD/USD-conversion rate is very important for the profitability of its business. This complicates management’s decisions, especially regarding capital allocation and is a success factor that is out of the company’s hands.
Summary
Exco Technologies Ltd. is an impressive company led by a trustworthy management, which has grown the firm organically to maximize long-term success. Exco Technologies Ltd.’s niche in the global supply chain seems sustainable and should guarantee that the company prospers in the future – as long as the health of this supply chain remains robust. A backlash against globalization or a slowdown of the world economy would hit the company hard.
In short, Exco Technologies Ltd. is a truly globalized company. So, buying a stake in the company is also a bet on free-trade and globalization to continue in the future. If the current prize of 9.59 CAD and an expected annual return of 7% adequately compensates for this, risk should be further investigated before buying this stock.
*
This article was written in collaboration with Christoph Wolf from Christoph Wolf Value Investing
Stig Brodersen is the host of the business podcast “We Study Billionaires.” You can find his free intrinsic value index here of popular stock picks.
0 notes
Text
The Intrinsic Value of Expedia, Inc.
Introduction
Expedia, Inc. is an online travel company that provides leisure travellers and businesses with the technology, tools, and information they need to plan, book, and experience travel. Expedia owns and controls a broad portfolio of travel brands and is the world’s largest travel agency by bookings.

Expedia derives the majority of its revenues from lodging and accommodations services (68% of sales in 2017). The remainder of its revenues is derived from services for air tickets (8%), rental cars, cruises, in-destination, and others (13%), and advertising (11%).
Travel suppliers distribute and market products via Expedia’s desktop and mobile offerings (apps), as well as through alternative distribution channels, and Expedia’s private label business. Expedia also operates an advertising and media business that helps other businesses, mainly travel providers, reach a large audience of travellers around the globe.
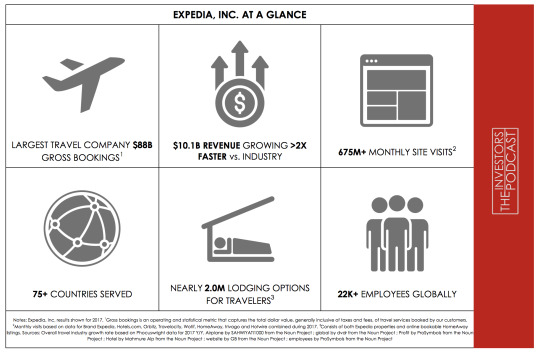
Source: Expedia Inc., Investor Presentation of February 8, 2018
Expedia’s portfolio of brands and businesses include the following, among others:

Expedia.com®, a leading full-service online travel company with localized websites in 33 countries;
Hotels.com®, a leading global lodging expert operating 90 localized websites in 41 languages with an award-winning loyalty program (book ten nights, get one free);
Expedia® Affiliate Network, a global B2B brand that powers the hotel business of hundreds of leading airlines, travel agencies, loyalty, and corporate travel companies plus several top consumer brands through its API and template solutions;
trivago®, a leading online hotel metasearch platform with websites in 55 countries worldwide;
HomeAway®, a global online marketplace for the vacation rental industry with nearly 1.8 million online bookable vacation rental listings, which also includes the VRBO, VacationRentals.com, and BedandBreakfast.com brands, among others. These brands compete with the popular and fast-growing Airbnb. In addition to its online marketplace, HomeAway also offers software solutions to property managers through its HomeAway Software and Glad to Have You products. On October 25, 2018, Expedia also announced the acquisition of Pillow and ApartmentJet, which will be folded into HomeAway portfolio of companies;
Egencia®, a leading corporate travel management company;
Orbitz® and CheapTickets®, leading U.S. travel websites, as well as ebookers®, a full-service travel brand with websites in seven European countries;
Travelocity®, a leading online travel brand in the United States and Canada;
Hotwire®, a leading online travel website offering spontaneous travel deals;
Expedia® Media Solutions, the advertising sales division of Expedia, Inc. that builds creative media partnerships and enables brand advertisers to target a highly-qualified audience of travel consumers;
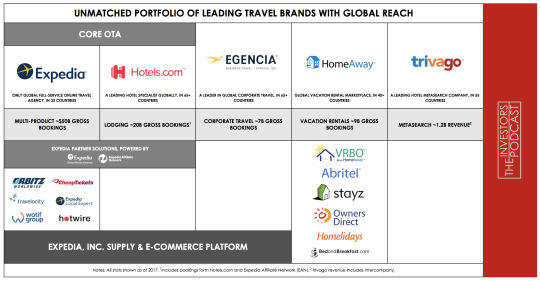
Source: Expedia Inc., Investor Presentation of February 8, 2018
The Company’s current market cap is about $17.01 Billion, and its enterprise value (i.e., market cap + total debt net of cash) is approximately $18.77 Billion. During the most recent twelve-month period, it generated $15.7 Billion in sales and $1.2 Billion in levered free cash flow (i.e., after interest expense), or $1.5 billion in unlevered free cash flow (i.e., before interest expense). The company’s common stock has fluctuated between a high of $139.77 and a low of $98.52 over the past 52 weeks and currently stands at around $114.56. Is Expedia undervalued at the current price?
The Intrinsic Value of Expedia, Inc.
To determine the intrinsic value of Expedia, we’ll start by looking at the company’s historical free cash flow. A company’s free cash flow is the true earnings which management can either reinvest for growth or distribute back to shareholders in the form of dividends and share buybacks. Below is a chart of Expedia’s free cash flow for the past ten years.
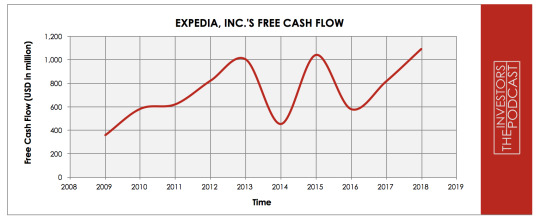
As one can see from the chart above, the company’s free cash flow has grown over the last ten years, from $361 million in 2008 to $1.2 billion in the twelve-month period through September 2018. In other words, free cash flow grew at a compound annual growth rate (CAGR) of 12.76% over the past ten years.
To determine Expedia’s intrinsic value, an estimate must be made of its potential future free cash flows. To help us build this estimate, we have calculated and displayed an array of potential outcomes for future free cash flows below.

When examining the array of lines moving into the future, each one represents a certain probability of occurrence. The upper-bound line represents a 12% growth rate which is slightly less than the 12.76% compounded annual growth rate (CAGR) achieved over the past ten years. This 12% growth rate has been assigned a 30% probability of occurrence as it is certainly possible, but perhaps not the most plausible scenario since companies typically grow slower and slower as they mature and as revenues get larger. However, in Expedia’s case, three factors argue in favor of a 12% growth rate.
First, the market in which it competes is huge. The global travel market was estimated to be about $1.6 trillion in 2018, and the online travel segment of that market is still less than half (44% of the global travel market) and even a smaller percentage outside the U.S. (7% in EMEA, 6% in LATAM, and 5% in APAC).

Source: Expedia Inc., Investor Presentation of February 8, 2018
Second, during the five-year period from 2013 through 2017, revenue grew at a CAGR of 22% while Adjusted EBITDA (somewhat of a proxy for cash flow) grew at a CAGR of 18%.

Source: Expedia Inc., Investor Presentation of February 8, 2018
Third, certain capital expenditures, such as data center investments, are shrinking as Expedia migrates to the cloud.

Source: Expedia Inc., Investor Presentation of February 8, 2018
To account for a number of factors including fierce competition and promotional activity among branded food manufacturers and private-label products as retailers consolidate, offset somewhat by potential revenue and earnings increases from future acquisitions.
The middle growth line represents a 7% growth rate to account for a number of factors including fierce competition in the online travel space and the plausibility of slowing global economic growth and/or a recession in the near term. Expedia’s competitors include well-capitalized online and offline travel companies, large online portals and search websites, certain travel metasearch websites, mobile travel applications, social media websites, as well as traditional consumer e-Commerce and group buying websites. The middle growth scenario has been assigned a 60% probability of occurrence, as it is most likely to occur.
The lower bound line represents a 3% growth rate in free cash flow and assumes that the company will grow at about the same rate as the 10-Year Treasury Note, which is a good proxy for projected GDP growth (i.e., the growth of the overall economy) over the next ten years. Expedia is very likely to grow at least as fast as the overall economy. This scenario has been assigned only a 10% probability, as the company will most likely grow much faster than the overall economy given the vast market in which it competes and the global trend from offline to online bookings.
Assuming these potential outcomes and corresponding cash flows are accurately represented, Expedia might be priced to generate a 9.4% annual return if the company can be purchased at today’s price of $117. Let’s now take a look at another valuation metric to see if it corresponds with this estimate.
Based on Expedia’s current earnings yield, which is the inverse of its EV/EBIT ratio, the company is currently yielding 4.5%. This is below the Consumer Discretionary Sector median average of 7.6% suggesting that the company may be overvalued on a comparable basis. However, Expedia has a current EV/LTM Free Cash Flow yield of 7.1%. This is above the Consumer Discretionary Sector median average of 5.3% suggesting that the company may be undervalued on a comparable basis. Finally, we’ll look at Expedia’s free cash flow yield, a
metric which assumes zero growth and simply measures the firm’s trailing free cash against its current market price or market capitalization. At the current market price, Expedia has a free cash flow yield of 6.9% compared to 5% for the Consumer Discretionary Sector.
Taking all these points into consideration, it seems reasonable to assume that Expedia is currently trading at a discount to fair value. Furthermore, the company may return around 9.4% annually at the current price if the estimated free cash flows are achieved. Now, let’s discuss how and why these estimated free cash flows could be achieved.
The Competitive Advantage of Expedia, Inc.
Expedia has various competitive advantages outlined below.
Brand Value. One of Expedia’s most powerful competitive advantages is its portfolio of recognizable brands. Expedia sells its travel offerings under numerous leading and trusted brands (see the list of brands in the introduction section above). Expedia can leverage these brands to garner trust with customers when making large travel purchases.

Source: Expedia Inc., Investor Presentation of February 8, 2018
For a competitor to challenge Expedia’s competitive brand position, they would have to deploy a large amount of capital and resources on advertising, customer service, and distribution. In fact, in 2017, Expedia spent $4.36 billion on direct selling and marketing activities.
Strong Network Effects. Expedia has built and continues to build, a broad network of travel offerings. On the supply side, as of September 30, 2018, the core Expedia platform exhibited 895,000 properties, and HomeAway sported nearly 1.8 million bookable listings. On the demand side, as measured by App Annie on October 25, 2018, Expedia's core platform ranks as a top-10 journey iOS mobile application in 17 countries versus 118 for Booking.com, and 25 for TripAdvisor.
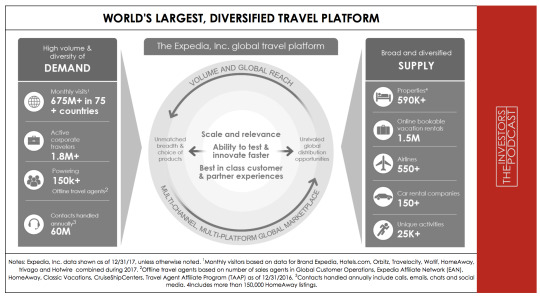
Source: Expedia Inc., Investor Presentation of February 8, 2018
This strong network effect has led Expedia to become one of two dominant players in the global online travel agency booking market—the other player being Booking Holdings (formerly known as Priceline). Expedia and Booking each have about 35% share in the global online travel agency booking market. The number three player, Orbitz, was acquired by Expedia in 2014.
Beneath Expedia and Booking, market share is highly fragmented, making it very hard for smaller players to gain customer traffic and supplier scale. Smaller players would need to expend large amounts of capital and substantial human capital to build relationships with hotels and gather critical accommodation information, including pictures, just to get started. Then, to attract customers, they would need to spend heavily on advertising to attract customers to their app or website (as mentioned, Expedia spent over $4.3 billion or 43% of revenue on direct marketing in 2017). And even if a smaller player managed to attract a few customers, it would need to build out IT systems, data centers, and a 24/7 customer support team to retain them. Not an easy task!
Switching Costs. Finally, Expedia’s scale allows it to economically offer rewards and loyalty programs to its customers. Once Expedia wins a customer, its rewards and loyalty programs incentivize the customer to book with Expedia or one of its brands again and make it hard to switch to a competitor. For instance, Hotels.com Rewards®, the loyalty program established in 2008, offers travelers the ability to earn one free night for every ten nights stayed. I personally have taken advantage of this rewards program and was reluctant to book a hotel through any site other than Hotels.com. Beyond Hotel.com Rewards®, Expedia offers Expedia®+ rewards on over 30 Brand Expedia points of sale, as well as Orbitz Rewards on Orbitz.com.
Expedia, Inc.’s Risks
Now that Expedia’s competitive advantages have been considered let’s look at some of the risk factors that could impair our assumptions of investment return.
Potential competition for well-capitalized mega companies. Expedia may encounter meaningful competition over the next ten years from mega companies that already have the pocketbooks and user traffic necessary to build network scale and the desire to enter a $1.6 trillion market for the sake of growth. These potential new entrants include Google, Facebook, Amazon, Alibaba, Baidu,
TripAdvisor, and hotel consortia. Focused entry by any one of these competitors could lead to industry commodification and margin contraction. That said, the market can probably support some level of increased competition over the next several years, as the travel booking market is extremely large, at $1.6 trillion, and online penetration of the travel market remains low, especially outside the United States.
Growth in Alternative Accommodations Market. The explosive growth experienced over the past few years in the alternative accommodations market (think Airbnb) has taken many travel companies by surprise. Continued growth and transition toward alternative accommodations could hamper Expedia’s core platform business. However, this may be offset by Expedia’s HomeAway segment, which competes in the alternative accommodations space and directly against Airbnb. In fact, Expedia’s HomeAway segment has experienced 35% year-over-year revenue growth and 66% year-over-year Adjusted EBITDA growth over the last two years. In the most recent quarter (ending September 2018), HomeAway accounted for approximately 12% of total revenue, up from 10.3% a year ago.
Lower Bookings in Economic Downturn. Finally, an economic downturn could negatively impact Expedia’s results. The travel industry is cyclical and affected by changes in economic growth. During economic downturns, consumers have typically cut leisure travel before many other expenses. During the 2009 downturn, when Expedia was still a young and growing company, sales were flat. If a downturn were to occur today, now that Expedia is mature, it would probably experience a decline in sales.
Opportunity Costs
Whenever an investment is considered, one must compare it to any alternatives to weigh up the opportunity cost. At the time of writing, 10-year treasuries are yielding 2.731%. If we take inflation into account, the real return is likely to be closer to 1%. The S&P 500 Index is currently trading at a Shiller P/E of 28.5 which is 69.64% higher than the historical mean of 16.8. Assuming reversion to the mean occurs, the implied future annual return is likely to be -2.8%. Expedia, therefore, appears to offer a much better return for investors at present, but other individual stocks may be found which offer a similar return relative to the risk profile.
Macro Factors
Investors must consider macroeconomic factors that may impact economic and market performance as this could influence investment returns. At the time of writing, the S&P is priced at a Shiller P/E of 28.5. This is 69.64% higher than the historical average of 16.8 suggesting markets are at elevated levels. U.S. unemployment figures are at a 30-year low suggesting that the current business cycle is nearing its peak. U.S. private debt/GDP currently stands at 199.6% and is at its highest point since 2009 when the last financial crisis prompted private sector deleveraging.
Summary
Expedia is competitively positioned given advantages that are difficult for competitors to replicate: (1) a stellar portfolio of well-known and trusted travel brands, (2) network effects created by apply supply and demand, and (3) switching cost advantages created by its ability to offer rewards and loyalty programs at scale.
Expedia is well-positioned in a large and growing global travel market. As mentioned above, it is one of two dominant players and odds are that it won’t be displaced from the duopoly anytime soon. Furthermore, it is worth noting that the future looks bright for the company’s HomeAway segment, which continues to grow alongside Airbnb in the popular alternative accommodations market. In fact, earlier this year, Airbnb was valued at 31 billion dollars in the private market, which is much higher than Expedia’s current enterprise value of about $18-19 billion.
In short, Expedia’s shares look attractively valued. Indeed, based on the assumptions used in the analysis above, Expedia may return around 9.7% to shareholders annually if purchased at the current market price of $114.20. Assuming that diversified market investors generally require a 7% annual rate return (equating roughly to a 14x earnings multiple), then it stands to reason that Expedia is trading at about a 38-39% discount ([9.7% - 7%]/7% = 0.3857) at current prices.
Disclaimer: The author of this article is long EXPE at the time of writing.
*This article was written in collaboration with Stephen Barnes from “The Investor’s Podcast.”
Stig Brodersen is the host of the business podcast “We Study Billionaires.” You can find his free intrinsic value index here of popular stock picks.
0 notes
Text
The Intrinsic Value of Psychemedics Corporation
Introduction
Pychemedics Corporation is a U.S. based medical diagnostics & research company whose principal business involves providing drugs detection services through the analysis of hair samples. At the time of writing, the firm’s market cap stands at around $89.6 Million and its revenues and free cash flows for the previous financial year were around $40 Million and $8 Million respectively. The company’s common stock has fluctuated between a high of $22.88 and a low of $16.11 over the past 52 weeks and currently stands at $16.27. Is Psychemedics Corporation undervalued at the current price?

The Intrinsic Value of Psychemedics Corporation
To determine the intrinsic value of Psychemedics Corporation, we’ll begin by looking at the company’s history of free cash flow. A company’s free cash flow is the true earnings which management can either reinvest for growth or distribute back to shareholders in the form of dividends and share buybacks. Below is a chart of Psychemedics Corporation’s free cash flow for the past ten years.

Psychemedics Corporation’s free cash flow has grown at an annualized rate of 11.51% over the past decade with negative free cash flow in 2014 resulting from increased capital spending for growth. In order to determine Psychemedics Corporation’s intrinsic value, an estimate must be made of its potential future free cash flows. To build this estimate, there is an array of potential outcomes for future free cash flows in the graph below.

When examining the array of lines moving into the future, each one represents a certain probability of occurrence. The upper-bound line represents an 11.51% growth rate which assumes that the firm’s future free cash flow growth mirrors that of the previous ten years. This upper growth line has been assigned a 20% probability of occurrence to account for the possibility of mounting competitive pressures and a narrowing of Psychemedics Corporation’s moat.
The middle growth line represents a 6.34% growth rate which assumes future free cash flow falls in line with long-term revenue growth. Since revenue growth tends to be more stable over time, it can be used as a proxy for a more conservative assumption of future growth. This growth rate has been assigned a 60% probability of occurrence to account for the fact that as Psychemedics Corporation continues to grow, its growth rate will slow as the law of large numbers comes into play.
The lower bound line represents a -5% rate in free cash flow growth and assumes that the company suffers a period of contraction in earnings due to competitive and cyclical pressures. This growth rate has been assigned a 20% probability of occurrence.
Assuming these potential outcomes and corresponding cash flows are accurately represented, Psychemedics Corporation might be priced at an 11.2% annual return if the company can be purchased at today’s price. We’ll now look at some other valuation metrics to see if they correspond with this estimate.
Psychemedics Corporation’s current earnings yield, which is the inverse of its EV/EBIT ratio, is 9.32% which is above the global medical diagnostics & research industry median of -0.98% and the firm’s historical median average of 8.20%. This suggests that Psychemedics Corporation may be undervalued relative to the industry and its historical average.
Finally, we’ll look at Psychemedics Corporation’s book value growth and dividend yield to see whether this supports our other estimates of growth. Over the last ten years, book value has grown at an annualized rate of 4.97%, and the current dividend yield stands at 4.24%. Assuming Psychemedics Corporation can grow its book value at a similar rate for the next ten years and its current dividend yield can at least be maintained, the firm should return around 9.21% at the current price.
Taking all these points into consideration, it seems reasonable to assume that Psychemedics Corporation may currently be trading at a discount to its industry and historical averages. Furthermore, the company may return between 9-11% at the current price if the estimated free cash flows are achieved. Now, let’s discuss how and why these estimated free cash flows could be achieved.
The Competitive Advantage of Psychemedics Corporation
Psychemedics Corporation has various competitive advantages outlined below.
Intangible Assets. Psychemedics Corporation holds a portfolio of 11 U.S. patents which protects its proprietary technology. This collection of patents includes a number which pertains to “digesting hair and releasing drugs trapped in the hair without destroying the drugs.”
Technical Advantage. Psychemedics Corporation enjoys a technical advantage over competitors which use urinary analysis for the detection of drugs. Independent side-by-side tests demonstrate that the firm’s patented technology can detect 6-10 times more drug users and the data shows that around 85% of drug users detected by Psychemedics Corporation’s technology would be missed through urinary analysis.
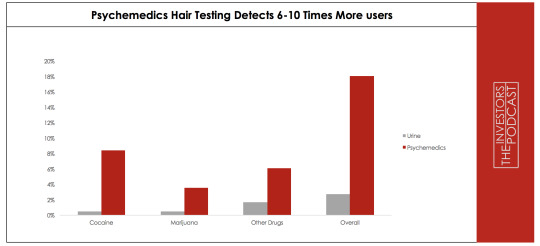
First Mover Advantage. Psychemedics Corporation was the first company to develop and patent technology for detection of drugs through hair analysis and as such has established itself as “the largest and leading supplier of drugs of abuse hair testing worldwide.” The company’s latest annual report notes the following; “Our drug testing services are trusted by over 10% of the Fortune 500 companies, numerous international organizations, many of the largest police departments, rehabilitation programs, schools, and parents throughout the world.”
Psychemedics Corporation’s Risks
Now that Psychemedics Corporation’s competitive advantages have been considered, let’s look at some of the risk factors that could impair my assumptions of investment return.
Psychemedics Corporation’s Brazilian subsidiary currently accounted for around 1/3 of the company’s revenue. Given that Brazil is experiencing a quite severe recession, there is an increased likelihood that revenues and earnings could be negatively affected in the near to mid-term.
Psychemedics Corporation’s business is cyclical. The company’s business is dependent on the staffing and recruitment levels of its clients, and in a recessionary environment, they are likely to see a decline in business.
Psychemedics Corporation’s Brazilian subsidiary, ‘Psychemedics Brazil,’ recently lost a legal battle with Omega Labs, a competitor who claimed that Psychemedics Corporation had engaged in anti-competitive practices. This unfavorable ruling is likely to facilitate increased competitive pressure in the coming years.
Opportunity Costs
Whenever an investment is considered, one must compare it to any alternatives to weigh up the opportunity cost. At the time of writing, 10-year treasuries are yielding 2.86%. If we take inflation into account, the real return is likely to be closer to 1%. The S&P 500 Index is currently trading at a Shiller P/E of 30.3 which is 79.3% higher than the historical mean of 16.9. Assuming reversion to the mean occurs, the implied future annual return is likely to be -1.9%. Psychemedics Corporation, therefore, appears to offer a much better return for investors at present, but other individual stocks may be found which offer a similar return relative to the risk profile.
Macro Factors
Investors must consider macroeconomic factors that may impact economic and market performance as this could influence investment returns. At present, the S&P is priced at a Shiller P/E of 30.3. This is 79.3% higher than the historical average of 16.9 suggesting markets are at elevated levels. U.S. unemployment figures are at a 30-year low suggesting that the current business cycle is nearing its peak. U.S. private debt/GDP currently stands at 202.80% and is at its highest point since 2009 when the last financial crisis prompted private sector deleveraging.
Summary
Psychemedics Corporation’s historical performance has been quite strong with the firm has been profitable for the past 25 consecutive years and has paid dividends for the past 88 quarters consecutively. Even though the firm’s Brazilian subsidiary has experienced issues in recent years, there are some positive developments afoot.
Psychemedics Corporation notes the following in their most recent annual report;
“1. It is a large and expanding market. The Brazil professional driver market is large by law. All professional drivers must pass a hair test in securing and renewing their driver’s license. And it is also expanding by law. That law requires that commencing in September 2018; professional drivers must renew their licenses every 2 ½ years, instead of the current requirement of every [five] years. This virtually doubles the size of that major portion of the market in the near‐term.
2. The results of this Brazil driver program thus far have been very dramatic and
Have had a major positive impact on the people of Brazil. Recently published data from the Brazil Federal Highway Police show that in the first year of the program, the numbers of highway deaths and disabilities have been reduced by 39% ‐‐‐ a reduction of approximately 39,000! Also, 31% of professional drivers chose not to renew their license, showing this test to be a major deterrent as well.
3. The great success of this professional driver program has the government discussing and considering possibly requiring a hair test for some other types of driver’s licenses.”
This is very good news for the shareholders of Pychemedics Corporation as revenues from its Brazilian subsidiary, which account for around of 1/3 of consolidated revenues, have the potential to increase dramatically in the coming years.
The company is currently in a strong financial position with a D/E ratio of 0.14 and a robust liquidity position as evidenced by the firm’s quick ratio of 2.73. Return on invested capital has averaged 24.95% over the previous decade, and free cash flow as a percentage of sales has averaged 10.78% over the same period.
In summary, Psychemedics Corporation is likely to experience some short-term challenges due to cyclical pressures, but its long-term economic future appears quite favorable. Providing that the company can maintain its competitive position, it should be able to capitalize upon favorable regulatory changes which look likely to significantly increase potential revenue streams.
Based on the conservative assumptions used in the analysis of the company, Psychemedics Corporation may return around 9-11% at the current market price.
Disclaimer: The author does not hold fractional ownership in any companies mentioned at the time of writing.
*
This article was written in collaboration with David J. Flood from “The Investor’s Podcast.”
Stig Brodersen is the host of the business podcast “We Study Billionaires.” You can find his free intrinsic value index here of popular stock picks.
0 notes
Text
The Intrinsic Value of Fonar Corporation
Introduction
Fonar Corporation is a U.S. based technology company whose principal business involves the design, manufacture, sale, and servicing of magnetic resonance imaging (MRI) scanners. At the time of writing, the firm’s market cap stands at around $155 Million and its revenues and free cash flows for the previous financial year were around $82 Million and $16 Million respectively. The company’s common stock has fluctuated between a high of $33.75 and a low of $21.10 over the past 52 weeks and currently stands at $23.92. Is Fonar Corporation undervalued at the current price?

The Intrinsic Value of Fonar Corporation
To determine the intrinsic value of Fonar Corporation, we’ll begin by looking at the company’s history of free cash flow. A company’s free cash flow is the true earnings which management can either reinvest for growth or distribute back to shareholders in the form of dividends and share buybacks. Below is a chart of Fonar Corporation’s free cash flow for the past ten years.
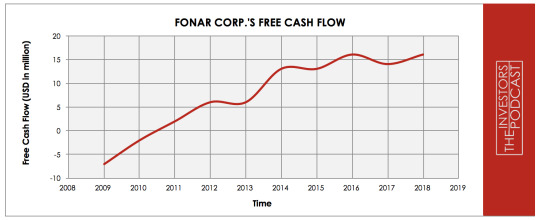
As one can see, the company’s free cash flow has grown substantially over the past decade, after making losses in 2009-2010, the firm has grown free cash flow at an annualized rate of around 34% between 2011-2018. In order to determine Fonar Corporation’s intrinsic value, an estimate must be made of its potential future free cash flows. To build this estimate, there is an array of potential outcomes for future free cash flows in the graph below.
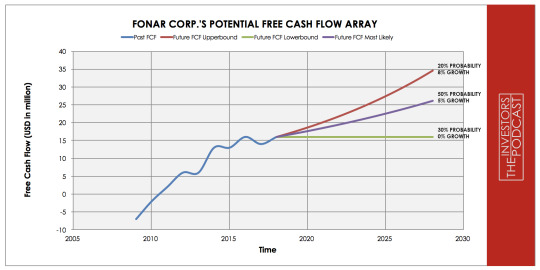
When examining the array of lines moving into the future, each one represents a certain probability of occurrence. The upper-bound line represents an 8.2% growth rate which assumes that the firm’s future free cash flow growth tracks MRI market growth rate projections for the period 2018-2025. This upper growth line has been assigned a 20% probability of occurrence to account for the possibility of mounting competitive pressures and a narrowing of Fonar Corporation’s moat. The middle growth line represents a 4.5% growth rate which assumes free cash flow tracks CMS office projections for U.S. health care spending growth free cash flow growth rate for the period 2017-2025. This growth rate has been assigned a 50% probability of occurrence. The lower bound line represents a 0% rate in free cash flow growth and assumes that the company suffers a period of stagnation in earnings due to competitive and cyclical pressures. This growth rate has been assigned a 30% probability of occurrence.
Assuming these potential outcomes and corresponding cash flows are accurately represented, Fonar Corporation might be priced at a 13.6% annual return if the company can be purchased at today’s price. We’ll now look at some other valuation metrics to see if they correspond with this estimate. Fonar Corporation’s current earnings yield, which is the inverse of its EV/EBIT ratio, is 14.37% which is above the industry median of 0.74% and the firm’s historical median average of 12.50% suggesting that Fonar Corporation may be undervalued relative to the industry and its historical average.
Finally, we’ll look at Fonar Corporation’s free cash flow yield, a metric which assumes zero growth and simply measures the firm’s trailing free cash against its current market price. At the current market price, Fonar Corporatoin has a free cash flow yield of around 19.51%.
Taking all these points into consideration, it seems reasonable to assume that Fonar Corporation may currently be trading at a discount to its peers and the global medical devices market. Furthermore, the company may return between 13-14% at the current price if the estimated free cash flows are achieved. Now, let’s discuss how and why these estimated free cash flows could be achieved.
The Competitive Advantage of Fonar Corporation
Fonar Corporation has various competitive advantages outlined below.
Niche Attribute. Fonar Corporation’s former CEO and current chairman Raymond Damadian was the inventor of the MRI scanner in 1972, and he subsequently founded Fonar Corporation in 1978. More recently, Fonar Corporation invented and patented the upright MRI scanner which allows the patient to sit, stand, bend, or lay while receiving a scan. This patented technology grants the company with a niche attribute since the upright machine is a more comfortable experience for patients to use and allows for patients to be scanned in weight-bearing positions which can aid diagnosis of particular injuries and ailments.
Intangible Assets. Fonar Corporation holds a portfolio of 209 patents related to its MRI technology including those related to the firm’s unique upright MRI scanning technology. While the company has cross-licensing agreements on some of its patents, it has thus far not engaged in any licensing agreements pertaining to its upright MRI technology. This further strengthens the firm’s competitive advantage.
Sticky Business Model. Fonar Corporation derives a large proportion of its revenue and earnings from patient fees, management, maintenance, and serving business which is conducted by the company’s subsidiary, Health Management Corporation of America (HMCA). These revenue and earnings streams are recurring since clients are not inclined to switch management providers due to the high associated costs, this leads to a sticky business model.
These competitive advantages have allowed Fonar Corporation to outperform the NASDAQ, NAS-Med, and NAS-Hea indexes for the last several years.
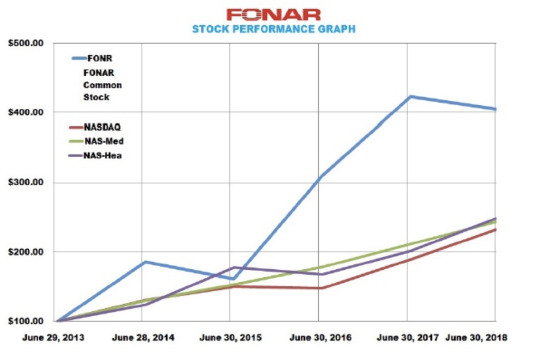
Source: Fonar Corporation 2018 Annual Report
Fonar Corporation’s Risks
Now that Fonar Corporation’s competitive advantages have been considered, let’s look at some of the risk factors that could impair my assumptions of investment return.
Fonar Corporation’s equipment business has been in decline for quite some time now with machine sales have fallen from over $9 Mil in 2010 to $0.6 Mil in 2018. Thankfully, the firm’s management and services business has more than made up for this, but it could suggest that the machine sales segment is unlikely to generate meaningful future income.
Fonar Corporation’s competitors include heavy hitters such as GE, Siemens, Toshiba, and Philips. These firms are much larger in size and thus possess much greater resources which can be directed at R&D and marketing. Given Fonar Corporation’s small-capitalization, there exists the possibility that a competitor may try to snuff the company out.
The implementation of Obamacare has seen reimbursement rates to MRI centers fall thus lowering fees paid to Fonar Corporation. It remains to be seen how health care legislation will evolve over the coming years, and there can be no guarantee that regulatory pressures will subside.
Opportunity Costs
Whenever an investment is considered, one must compare it to any alternatives to weigh up the opportunity cost. At the time of writing, 10-year treasuries are yielding 3.07%. If we take inflation into account, the real return is likely to be closer to 1%. The S&P 500 Index is currently trading at a Shiller P/E of 30.6 which is 81.8% higher than the historical mean of 16.9. Assuming reversion to the mean occurs, the implied future annual return is likely to be -1%. Fonar Corporation, therefore, appears to offer a much better return for investors at present, but other individual stocks may be found which offer a similar return relative to the risk profile.
Macro Factors
Investors must consider macroeconomic factors that may impact economic and market performance as this could influence investment returns. At present, the S&P is priced at a Shiller P/E of 30.6. This is 81.8% higher than the historical average of 16.9 suggesting markets are at elevated levels. U.S. unemployment figures are at a 30-year low suggesting that the current business cycle is nearing its peak. U.S. private debt/GDP currently stands at 202.80% and is at its highest point since 2009 when the last financial crisis prompted private sector deleveraging.

Source: Fonar News Release – February 23, 2005
Summary
Fonar Corporation appears to be selling at a discount to fair value after the recent market sell-off. While machine sales have declined income from patient fees, maintenance and servicing have seen revenues and earnings continue to rise. Healthcare spending as a proportion of GDP is projected to rise from the 2016 level of 17.9% to 19.7% by 2026. Health spending is also projected to grow at 1% faster than GDP between now and 2026 meaning a worst-case growth rate of 4-5% is highly likely. If Fonar Corporation can match or outpace MRI Scanner growth projections of around 8%, it could easily provide market-beating returns in the coming years.
With regards to financial stability, the firm is currently in a strong position with virtually no debt and a current and quick ratio of 4.60 and 4.41 respectively. Cash and equivalents currently stand at $19.6 Million meaning the possibility for accretive acquisitions without recourse to debt financing is open along with the potential for future dividend distributions.
In summary, Fonar Corporation appears to be a financially strong company with favorable future growth prospects. The firm currently possesses a narrow economic moat stemming from intangible assets, niche attributes, and a sticky business model. Fonar Corporation’s moat is likely to be maintained in the near-to-mid-term, but the risk exists that a larger competitor could seek to move on the firm’s market share.
Book value per share currently stands at $15.22 which equates to around 63% of the current share price. This offers a reasonable floor for the stock, and if current free cash flows can be maintained, then investors have the potential to achieve annualized double-digit returns over the next decade. Based on the conservative assumptions used in the analysis of the company, Fonar Corporation may return around 13-14% at the current market price.
Disclaimer: The author does not hold fractional ownership in any companies mentioned at the time of writing.
*
This article was written in collaboration with David J. Flood from “The Investor’s Podcast.”
Stig Brodersen is the host of the business podcast “We Study Billionaires.” You can find his free intrinsic value index here of popular stock picks.
0 notes
Text
The Intrinsic Value of Hibbett Sports
Introduction
Hibbett Sports is a U.S. retailer focusing on athletic sports fashion and associated equipment. The company is unique in selling almost exclusively in small and midsized communities – which allows the company to pay lower rents than in large, expensive cities, and also reduces competition from other brick-and-mortar retailers. Hibbett Sports operates more than 1000 stores throughout the U.S.
Hibbett Sports has experienced multiple headwinds recently. Not only does it operate in the highly competitive and cyclical retail industry, which has led to stagnating sales and compressed margins. The company has also been very late to build its online platform – which is especially problematic since many of its products are rather small and can be easily sent by post. These problems are also reflected in its rather disappointing earnings during the last two years. From a high of $67 in 2014 the stock has declined sharply and today only trades at only $19. Is Hibbett Sports a buy at this price?

The Intrinsic Value of Hibbett Sports
To determine the value of Hibbett Sports, let’s start by looking at the company’s history of free cash flow. The free cash flow is important because it represents the company’s ability to retain earnings and grow the business. Most importantly, it demonstrates a return on the principal that might be invested into the ownership of equity of the business. Below is a chart of Hibbett Sports’ free cash flow over the past ten years.

As one can see, the results have been quite volatile – but with an upward trend. The volatility is due to fluctuations in the operating and net margins – and not because of volatile revenue. In fact, revenue has consistently grown throughout the last decade. Although these numbers look quite good, we will account for the recent drop in earnings and use a very conservative estimate of its future cash flows.

Each line in the above graph represents a certain probability for occurring. We assume a 5% chance for the upper growth rate of 5% per year, a 50% chance for zero growth and a 45% chance for the worst-case scenario of a 10% annual decline.
Assuming these growth rates and probabilities are accurate, Hibbett Sports can be expected to give a 19.3% annual return at the current price of $19. Even if the worst case becomes a reality, the annual return is still a solid 12.4%. Unless this company goes bankrupt in the next few years, these returns are truly outstanding. Now, let’s discuss how and why those free cash flows could be achieved.
The Competitive Advantage of Hibbett Sports
HIBB possesses several advantages:
Niche in Rural Locations. By focusing on small and midsized communities, Hibbett Sports has found its niche within the highly competitive retail environment. This strategy results in lower rents and less competition since most brick-and-mortar shops are clustered in larger cities. This focus on rural locations allows Hibbett Sports to achieve margins that are higher than its competitors achieve.
Very Strong Balance Sheet. Hibbett Sports’ foundation is very solid. During the last ten years, the company has never held any long-term debt, and its current ratio and quick ratio are conveniently high. These strong financials should protect HIBB from any short-term problems that might arise.
Long-Term Focus and Stability. Hibbett Sports’ business might look rather boring. But by steadily investing and expanding its reach, the company has consistently increased revenue, book value, and cash flow. This is not a company that tries to grow by costly acquisitions, but by organically growing through internal investments.
Risk Factors
The risks for Hibbett Sports are visible. While revenue has still been growing during the last years, same-store sales were often negative, and also margins have contracted sharply. The last reported quarterly earnings were especially disappointing, resulting in a crash of about 30% of HIBB’ stock.
Here is a list of the most important headwinds:
The Immense Competition by Amazon and Other Online Sellers. Hibbett Sports is especially vulnerable to digital competition because the company has launched its e-commerce website only in July 2017 and must now try to catch up.
Risk of a U.S. Recession. Due to its sole focus on the U.S., Hibbett Sports is highly vulnerable to a U.S. downturn. Especially sports equipment, footwear, and apparel – which are Hibbett Sports’ main products – might either not be bought at all or customers might switch to cheaper no-name products. All of this would hurt Hibbett Sports’ revenue and margins.
Fragmentation of Athletic Merchandise. The business of sports footwear, apparel, and athletic equipment is spread over a vast number of players – and Hibbett Sports is comparatively small. This gives the company a disadvantage when it comes to negotiating with its vendors, public visibility, and advertisement.
Strong Dependability on Nike. While also selling products from Adidas, Under Armour, and others, Nike accounted for about 57% of Hibbett Sports’ purchases. This makes the company very dependent on Nike and Hibbett’s sport is therefore strongly correlated with the success of Nike’s products.
Opportunity Costs
When looking at various investing opportunities on the market today, let’s compare the expected return of Hibbett Sports to other ideas. First, one could invest in the ten-year treasury bond which is producing a 3.2% return. Considering the bond is completely impacted by inflation, the real return of this option is likely only about 1%. What about investing in U.S. stocks? Currently, the S&P 500 Shiller P/E ratio is 31. As a result, the U.S. Stock market is priced at a 3.3% yield. If one were to invest in the S&P500, they might purchase a low-cost ETF to take advantage of this return.

Macro Factors
The retail sector currently experiences a major disruption– not only because of Amazon but also because of demographic factors and changed shopping behavior. Since sports fashion is mostly small, it can easily be sent, ordered and delivered online – which makes Hibbett Sports especially vulnerable. This is especially critical because Hibbett Sports has only recently started investing in its online platform. On the positive side, the focus on rural locations at least shields HIBB from conventional brick-and-mortar competition.
Summary
Hibbett Sports’ stock has been crushed alongside many other struggling retailers. Earnings and margins are under pressure, and its management has been too late to accept the new realities of online selling. Despite these negatives, the company is still growing, has a solid financial footing and has good chances to survive due to its niche in rural areas. Since it is very hard to see the company going out of business anytime soon, the expected annual return of 19.3% should adequately compensate for all current uncertainties.
*
This article was written in collaboration with Christoph Wolf from Christoph Wolf Value Investing
Stig Brodersen is the host of the business podcast “We Study Billionaires.” You can find his free intrinsic value index here of popular stock picks.
0 notes