
Last Seen Blogs

that-worm-rpgverse
The Worm Army

system-splintered
healing.every.moment.

masako34-blog
Sakura

click2submit
Click 2 Submit

let-everything-participate
Nothing prevents a dreamer from dreaming🧚🌈🌌✨
Text
Basic technical analysis for trading.
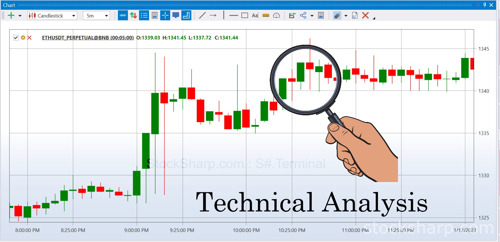
👩🎓 🧑🎓 "Technical analysis" is a method of studying stock behavior by analyzing charts to forecast future price trends. Technical analysts examine stock behavior based on price and trading volume (or trading value), considering them as important sources of information for technical analysis.
💥However, the strategies used in technical analysis are not formulated without principles. In fact, they are based on three concepts or beliefs:
1. Price Behavior Reflects All Information: According to this concept, the price of a stock reflects all relevant information. Economic, political, and other changes that impact supply and demand in the stock market will affect the price. Since the price is determined by the interaction of supply and demand, positive changes lead to increased demand surpassing supply (greater buying pressure than selling pressure), resulting in price increases. Conversely, negative changes lead to increased supply surpassing demand (greater selling pressure than buying pressure), leading to price declines.
👩🎓 🧑🎓 However, technical analysts primarily focus on price and volume data for analysis. This approach narrows the scope of study compared to fundamental analysis, which delves into the causes behind price changes. While analyzing fundamentals, the driving forces behind changes in supply and demand are thoroughly examined. Both approaches aim to solve the problem of determining the direction of stock prices, although they differ in their analytical models.
0 notes
Text
Custom index and how can use in trading.
In addition to price and volume indicators, there are some indicators in technical analysis that can be used to display general market conditions. To make this possible, traders usually prefer to use indices.
Exchanges usually provide their own built-in indices such as S&P or DAX. But what to do when you need to use your own calculation only with the instruments of interest to us? Or use some market (for example, cryptocurrencies) where there are no ready-made indices.
In the StockSharp platform, we can create any kind of index from downloaded market data using our own formula. So we can determine the direction of the market as a whole.
The index as a method will allow us to determine the direction of movement of this for all the instruments that are included in it. For example, let's say we want to create an index that compares Apple and Amazon.
When we create an index in S# (by using S#.Data index builder), we can see the direction of the trend from the data of the index on the chart. It will show that during this period, Apple is stronger than Amazon if the chart goes up. But if the chart shows a downtrend, then it means that Apple is weaker than Amazon. If the chart shows a flat, it means that both instruments are equivalent at a distance
Below we will look at the step-by-step process of how to build index using a simple example, as well as using mathematical functions that allow you to calculate complex trading index.
youtube
🤖 Let's see how to find Index from all 3 companies: Apple, Amazon and Google.
👉 After we downloaded Market Data of Instruments that we need to create the index in to S#.Data already.
👉 For example I downloaded Apple, Amazon and Google for creating index.
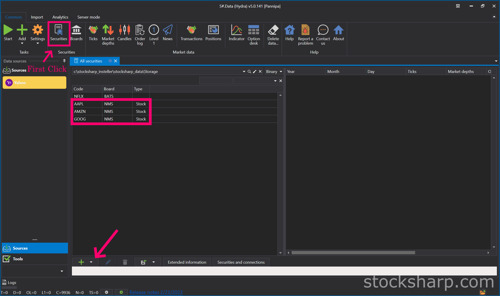
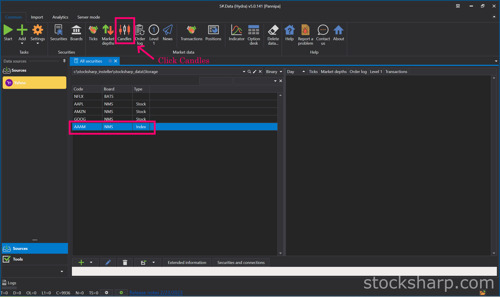
👉 Click on the Securities icon.
👉 On this page will show all Instruments we already downloaded Market Data.
👉 Including the Instruments we want to create INDEX are Apple, Amazon and Google.
👉 Click on Plus sign below.

👉 Select add INDEX.
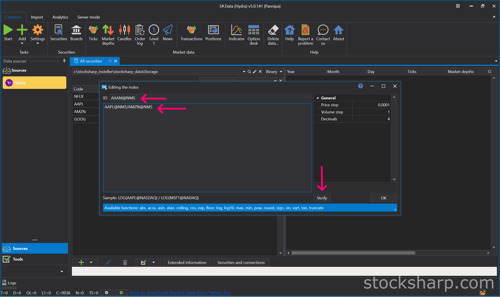
👉 Create the name of the INDEX and put it on the ID tab.
👉 Put the formula as an example AAPL@NMS/AMZN@NMS.
👉 From that formula is an Apple device from Amazon.
👉 And then Click verify formula.

👉 Click OK, and OK again.
👉 The INDEX we just created will show in all the Instruments Market Data downloaded but that INDEX still does not have Market Data because it is just an INDEX.
👉 Click on the Candle icon on the top.
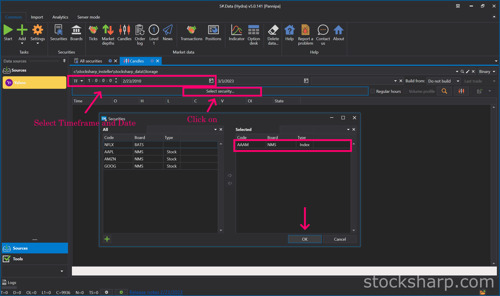
👉 Select Timeframe and Date.
👉 And then Click on the Securities tab.
👉 Select INDEX on the left side by Double Click.
👉 The INDEX Instruments will move to the right side.
👉 Click OK.

👉 On the Securities tab will change to INDEX we Selected.
👉 On the Build from tab Select Composite elements.

👉 Tip for that : We no need to Select Build from composite elements every time.
👉 We can Click save and Select save build.
We can save our collation of these Index data without having to recalculate each time. It saves us even more time. When we save the data that we have already calculated The information will be displayed on the Market Data page, which is the real information.
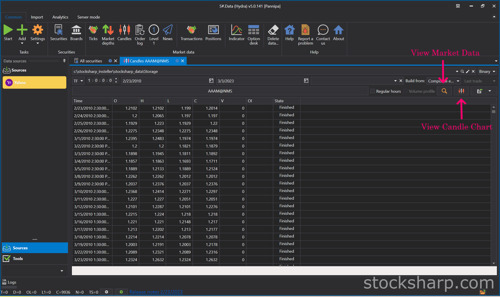
👉 Click View Market Data Information.
👉 Click View Candle Chart.

👉 This is the Candle Chart INDEX from Apple Vs Amazon by Timeframe we downloaded.
👉 We will do the same way to create another INDEX.
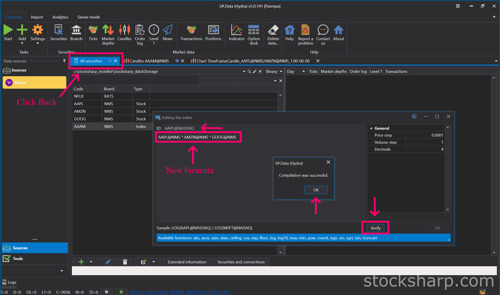
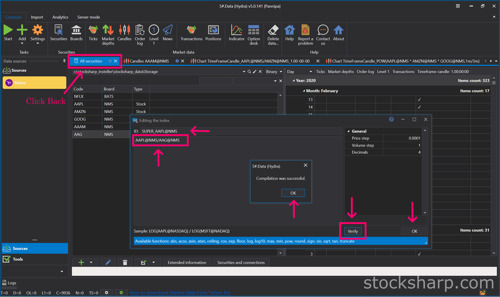
👉 Click Back to All Securities.
👉 Create the new name of the INDEX and put it on the ID tab.
👉 Put the new formula. Other an example AAPL@NMS * AMZN@NMS * GOOG@NMS
👉 And then Click verify formula.
👉 Click OK.

For example, finding an index using a simple equation Multiply all 3 instruments together. For function to find index in S#.Data, put POW(AAPL@NMS * AMZN@NMS * GOOG@NMS,1m/3m) which comes from the word Power in front.. If we Omitting m Hydra understands that it is an integer, not a fraction. So we have to insert m every time so Hydra understands it's a fraction and not an integer.
👉 And then Click verify formula.
👉 Click OK. And OK again.

👉 Select Timeframe and Date.
👉 And then Click on the Securities tab.
👉 Select INDEX on the left side by Double Click.
👉 The INDEX Instruments will move to the right side.
👉 Click OK.

👉 On the Securities tab will change to INDEX we Selected.
👉 On the Build from tab Select Composite elements.

👉 This is the Candle Chart INDEX from POW(AAPL@NMS * AMZN@NMS * GOOG@NMS,1m/3m) by Timeframe we downloaded.
Now we can create an index of all 3 instruments in the interval we choose. You can see that the chart shows the trend direction in the market for all 3 instruments. It was only going up for a while and then something happened that caused the chart to go down significantly. At the time when the chart changes direction, we can look back at the news, events, and changes about the 3 instruments from the past at that time. And quite different from the Chart Index from Apple and Amazon, which is in the direction of only an upward trend.
When we find the index of all 3 instruments that we have calculated. And we want to compare that from the index of these 3 Instruments, what kind of trend will Apple stocks be in the market? Now we just compare the Instruments Apple with the index of the 3 instruments that we have already calculated. and see in which direction the chart will be displayed.
👉 Create the name of the INDEX and put it on the ID tab.
👉 Put the formula as an example AAPL@NMS/AAG@NMS.
👉 From that formula is an Apple divide from INDEX of 3 Instruments.
👉 And then Click verify formula.
👉 Click OK, and OK again.

👉 Select Timeframe and Date.
👉 Click Change Instrument.
👉 Select INDEX instrument by Double Click on Instrument tab.
👉 Click OK.

👉 Click View Market Data Information.
👉 Click View Candle Chart.

👉This is the Candle Chart INDEX from Apple divided from INDEX of 3 Instruments by Timeframe we downloaded.
From the chart we can see that it is an uptrend. This shows us that Apple is stronger than the whole IT sector.
You can use indexes in your own trading or analysis (e.g., by exporting calculated data into other programs).
Hope this blog is interesting for you. Please comment us what you interesting to know more about S#.Data. We will try to write our next posts.
Source : StockSharp.com
0 notes
Text
How to Import Candle Charts from TradingView websites?
youtube
💥S#.Data provides functionality that supports automatic downloading of historical market data from many data sources. But sometimes websites do not provide an API to make the process automatically. Fortunately, in addition to downloading you can import market data from CSV files directly.
💥TradingView is a charting platform and social network used by many traders and investors worldwide to spot opportunities across global markets. The major feature of the website - various historical dataset - that you can download as a csv file for further usage (e.g. - backtesting, analyzing).
💥For the TradingView website, you need a premium subscription to be able to export candles. Let’s look at this process step-by-step to understand how we can import this market data into S#.Data.
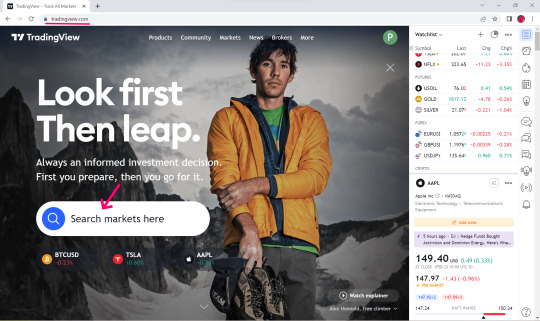
👉Visit TradingView Website.

👉Select Search Market for example NFLX.
👉Click Launch Chart for view.
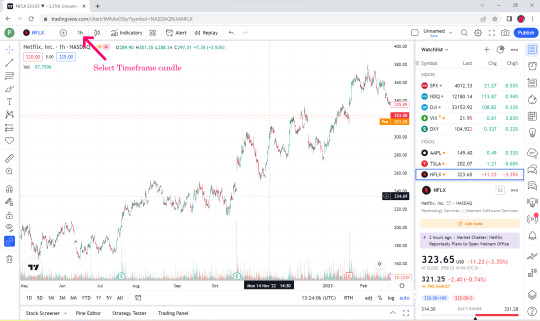

👉Select Time Flame Candle for example 1 hr.
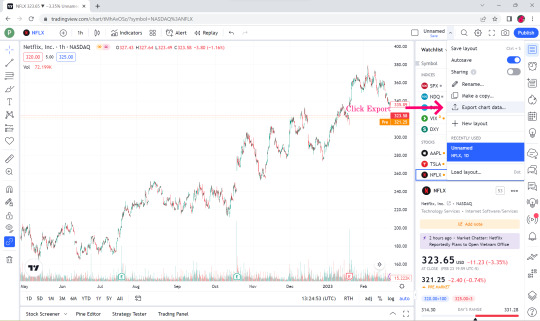
👉Select Export Chart Data.
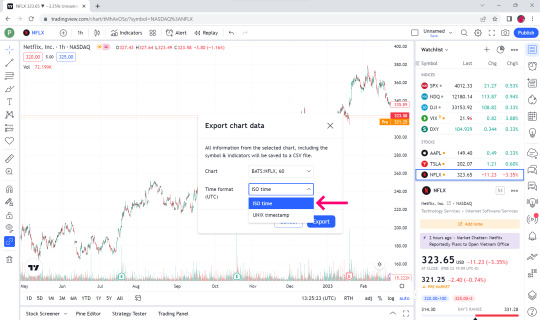
👉In the Time format box, select ISO time.

👉Click Export.

👉Open the downloaded Market data file. You can see that the top bar is date and time, open price, low price, close price, volume and volume MA.
👉S#.Data supports only the first 6 data, the last one volume MA we will not take.
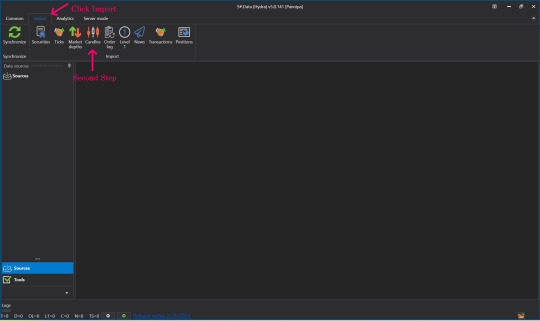
👉Open up your S#.Data Application.
👉Visit our instruction if you doesn't have S#.Data application.
👉How I can get S#.Data
👉Go to S#.Data application, click select import and Click candle.

👉Find the name of the file we just downloaded (btw, you can import by directories as well).
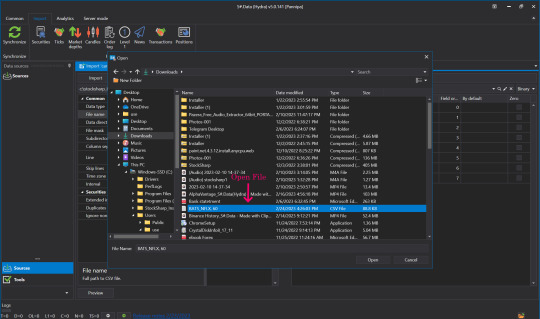
👉Click to select the file that we downloaded, click open.

👉Click to select the time frame to match the timeframe we selected in the file we downloaded initially in the data type field.

👉Setting S#.filed from the Security and Board fields.
👉By default put the Instruments Code that we downloaded. For example NFLX in the Security slot in the instrument board e.g. BATS by default.
👉Enter numbers 0-5 in the date box and so on. Remember - numeration started from 0, not from 1.

👉Skip lines Row 1 cause it contains data columns description.
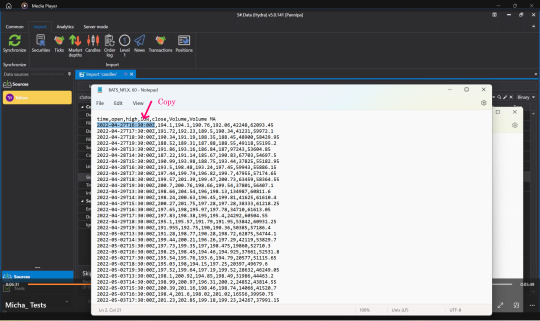
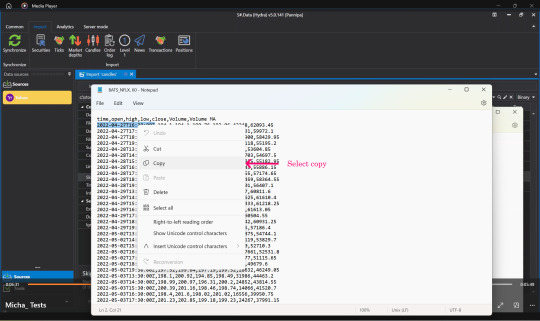
👉Open the file that we downloaded again, select Copy, time, date that we started downloading Market Data.
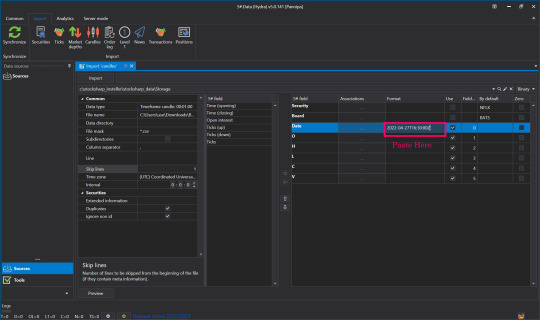
👉Press Paste in the Date Format field.
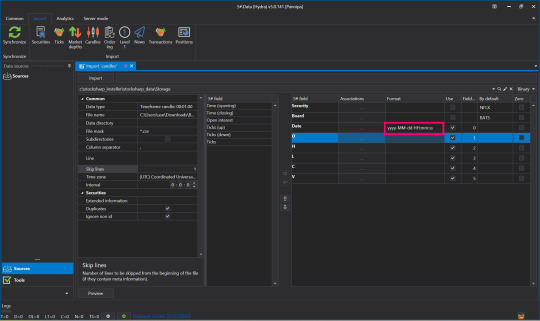
👉Change Numbers to Code Letters By yyyy-MM-dd HH:mm:ss You can read more about format on Microsoft website

👉Once everything is entered correctly, click Preview to double check before importing.
👉When the screen shows this page, there is no problem.
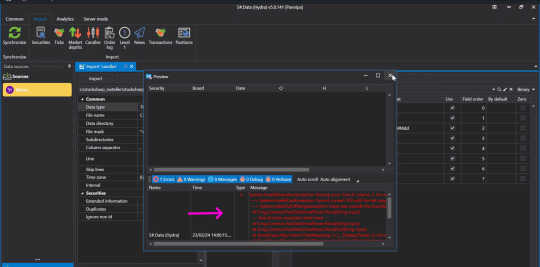
👉But if you press Preview and the screen appears like this, check the details that you have entered again to see if there is any mistake, correct it and press Preview again.
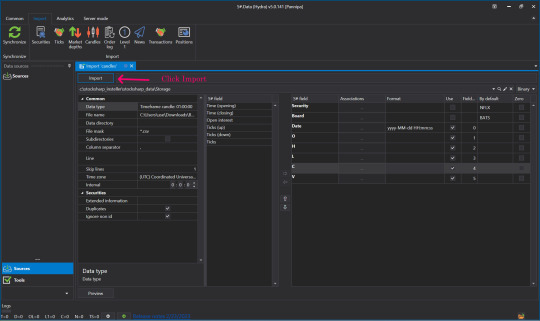
👉Once it's verified and there are no problems, press Import.
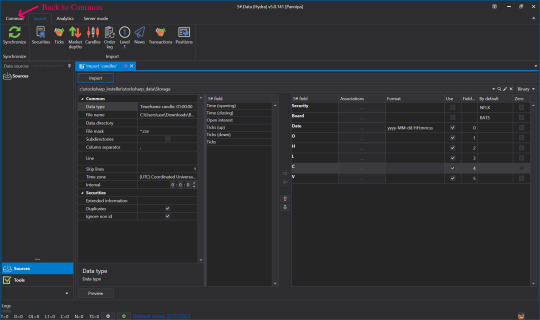
👉When done, click Back to go to Common.
👉Click on our Security.
👉Click on Instrument Tab to view market Data.

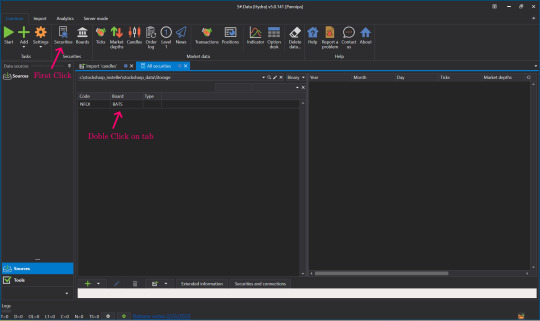
👉Now let's see what data was imported. Click Candles.
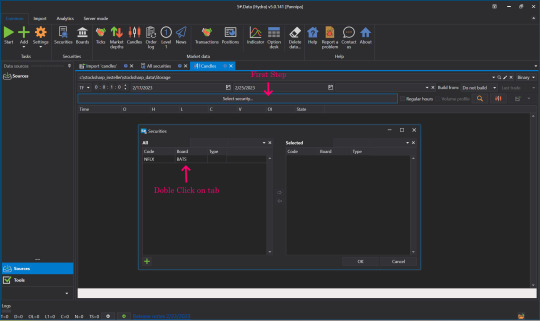
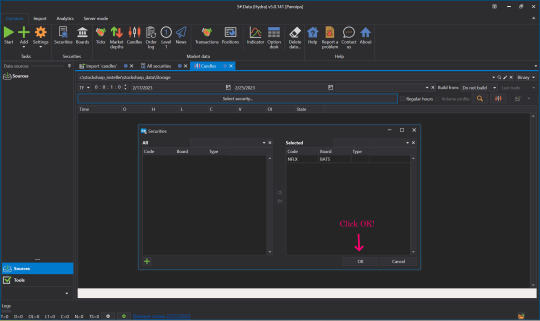
👉Select Security, select the Instrument to view by double-clicking the Instrument Tab, move it to the right side and click OK.

👉Select date and time frame.

👉Click View Market data.
👉Click View Candle Chart to see our candles as a chart.

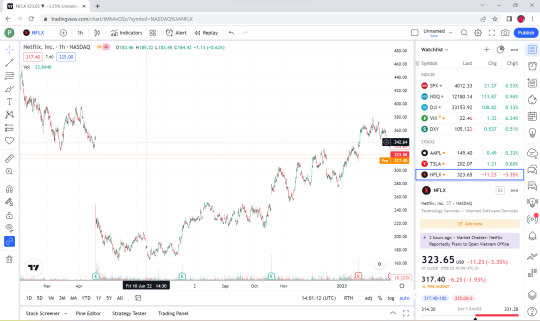
👉This is a Candle Chart comparison between the Chart that was in TradingView website before it was downloaded and the downloaded Chart rendered in S#.Data application.
💥💥Now you know how to import from a CSV file. To make this process you no need to use only limited websites like TradingView. S#.Data supports any format of CSV files that you can download from a variety of sources and websites.
💥Hope this blog is interesting for you. Please comment us what you interesting to know more about S#.Data. We will try to write our next posts.
Sources : StockSharp.com
#downloading of historical market data#import market data#charting platform#export candles#trading view#backtesting#Youtube
1 note
·
View note