
Don't wanna be here? Send us removal request.
Statistics
We looked inside some of the posts by stopsmoking666 and here's what we found interesting.
Average Info
Notes Per Post
3
Likes Per Post
3
Reblog Per Post
0
Reply Per Post
0
Time Between Posts
5 days
Number of Posts By Type
Text
4
Note
1
Last Seen Tumblr Blogs


Fun Fact
In February 2021, Tumblr had 518.6 million blog accounts.
Text
Making Data Management Decisions
Source Code:
import pandas
import numpy
# any additional libraries would be imported here
data = pandas.read_csv('nesarc_pds.csv', low_memory=False)
# bug fix for display formats to avoid run time errors
pandas.set_option('display.float_format', lambda x:'%f'%x)
#setting variables you will be working with to numeric (updated)
#removal of BLANKS to avoid recoding failure in the next step
data['S1Q2F']=data['S1Q2F'].replace(" ", numpy.nan)
data['S1Q2D']=data['S1Q2D'].replace(" ", numpy.nan)
data['S1Q2F'] = pandas.to_numeric(data['S1Q2F'])
data['S1Q2D'] = pandas.to_numeric(data['S1Q2D'])
data['AGE'] = pandas.to_numeric(data['AGE'])
#subset data to young adults age 18 to 25 who have smoked in the past 12 months
sub1=data[(data['AGE']>=17) & (data['AGE']<=34)]
#make a copy of my new subsetted data
sub2 = sub1.copy()
print ("_____________________________________________________________________")
print ('Counts for original S1Q2F')
c1 = sub2['S1Q2F'].value_counts(sort=False, dropna=False)
print(c1)
print ("_____________________________________________________________________")
# recode missing values to python missing (NaN)
sub2['S1Q2F']=sub2['S1Q2F'].replace(9, numpy.nan)
#Showing all data with 9=Unknown set to NaN
print ('Counts for S1Q2F with 9 set to NAN and number of missing requested')
c2 = sub2['S1Q2F'].value_counts(sort=True, dropna=False)
print(c2)
print ("_____________________________________________________________________")
#Hiding the NaN data entries
print ('Counts for S1Q2F with 9 set to NAN and hiding of missing requested')
c2 = sub2['S1Q2F'].value_counts(sort=True, dropna= True)
print(c2)
print ("_____________________________________________________________________")
#AGE quartiles grouping into 4
print ('AGE - 4 categories - quartiles')
sub2['AGEGROUP1']=pandas.qcut(sub2.AGE, 4, labels=["1=0%tile","2=25%tile","3=50%tile","4=75%tile"])
c3 = sub2['AGEGROUP1'].value_counts(sort=False, dropna=True)
print(c3)
# recode missing values to python missing (NaN)
sub2['S1Q2D']=sub2['S1Q2D'].replace(9, numpy.nan)
#Showing all data with 9=Unknown set to NaN
print ('Counts for S1Q2D with 9 set to NAN and number of missing requested')
c4 = sub2['S1Q2D'].value_counts(sort=True, dropna= True)
print(c4)
print ("_____________________________________________________________________")
Result:
Counts for original S1Q2F S1Q2F NaN 10629 1.000000 2429 2.000000 570 4.000000 70 3.000000 119 9.000000 2 Name: count, dtype: int64
The result is showing the familiy situation of the selected AGE group between 18 and 35. All aswers are included.
Counts for S1Q2F with 9 set to NAN and number of missing requested S1Q2F NaN 10631 1.000000 2429 2.000000 570 3.000000 119 4.000000 70 Name: count, dtype: int64
The result is showing the familiy situation of the selected AGE group between 18 and 35. All aswers for unknown are included as NaN
Counts for S1Q2F with 9 set to NAN and hiding of missing requested S1Q2F 1.000000 2429 2.000000 570 3.000000 119 4.000000 70 Name: count, dtype: int64
The result is showing the familiy situation of the selected AGE group between 18 and 35. All aswers for unknown are included as NaN but have been removed from the output for more clarity of the data.
AGE - 4 categories - quartiles AGEGROUP1 1=0%tile 3665 2=25%tile 3503 3=50%tile 3228 4=75%tile 3423 Name: count, dtype: int64
The result is showing the percentiles of the AGE grouped into 4 categories
Counts for S1Q2D with 9 set to NAN and number of missing requested S1Q2D 2.000000 7659 1.000000 3021 Name: count, dtype: int64
The result is showing the if the familiy got divorced (1=yes, 2=No) of the selected AGE group between 18 and 35. All aswers for unknown are included as NaN but have been removed from the output for more clarity of the data
1 note
·
View note
Text
Running My First Program
Code:
import pandas import numpy
Import complete dataset
data = pandas.read_csv('nesarc_pds.csv', low_memory=False) print(len(data)) print(len(data.columns))
Count if the parents had been divorced
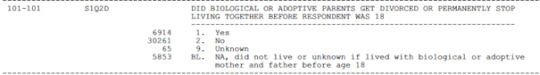
print("counts the numbers of S1Q2D for 1=parents get divorced, 2=Not divorced, 9=Unknown, empty=NA") c1=data["S1Q2D"].value_counts(sort=False) print(c1)
Count where the lived after the parents had been divorced
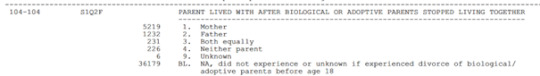
print("counts the numbers of S1Q2F for 1=mother, 2=father, 3=both equally, 4=neither parent, 9=Unknown, empty=NA") c2=data["S1Q2F"].value_counts(sort=False) print(c2)
Count if ever smoked 100+ cigarettes
print("counts the numbers of S3AQ1A for 1=yes, 2=No, 9=Unknown") c3=data["S3AQ1A"].value_counts(sort=False) print(c3)
___________________________________________________________
Output:
43093 3010 counts the numbers of S1Q2D for 1=parents get divorced, 2=Not divorced, 9=Unknown, empty=NA S1Q2D 2 30261 1 6914 5853 9 65 Name: count, dtype: int64 counts the numbers of S1Q2F for 1=mother, 2=father, 3=both equally, 4=neither parent, 9=Unknown, empty=NA S1Q2F 36179 1 5219 2 1232 4 226 3 231 9 6 Name: count, dtype: int64 counts the numbers of S3AQ1A for 1=yes, 2=No, 9=Unknown S3AQ1A 2 24636 1 18013 9 444 Name: count, dtype: int64
________________________________________________________
The first variable S1Q2D shows that most parents (30261) have not been divorced and 6914 have been divorced.
After the divorce most of the under 18 year olds where living with their mother (5219) and 1232 with their father.
There is not such a big difference in the number of persons who have smoked more than 100 cigarettes (18013) or those who have not (24636).
I am looking forward to see if there is a correlation between the variables.
1 note
·
View note
Text
Literature research
There is a clear connection between the family situation and the smoking addiction stated in various studies.
0 notes
Text
Study Design
Selected Dataset: NESARC
Research question: How does the family situation affect the likelihood of smoking?
Hypothesis 1 It is more likely that people start smoking when their parents are divorced or split.
Hypothesis 2 The lower the annual income, the higher the likelihood of smoking.
1 note
·
View note