
Last Seen Blogs

krelito
cute touch, krelito


realreulbbrband
Victeazer propaganda

seiimmerduselbst
MyBlog🧘🏼♀️

important-animal-images
Important Animals
Text
Data Management and Visualization: Assignment 4
PART 1
Before creating graphs of variables, I have exchanged the observations. These changes relate to variables:
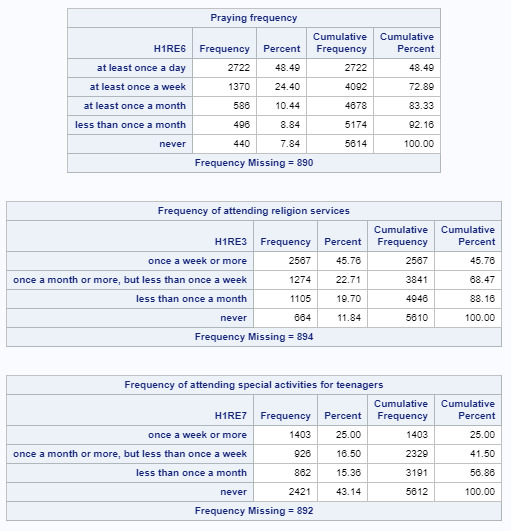
Praying frequency
Frequency of attending religion services
Frequency of attending special activities for teenagers
and make possible to indicate frequency of somethinf per month. It was done thanks to creating new variables. Next pictures show the main idea of this step.
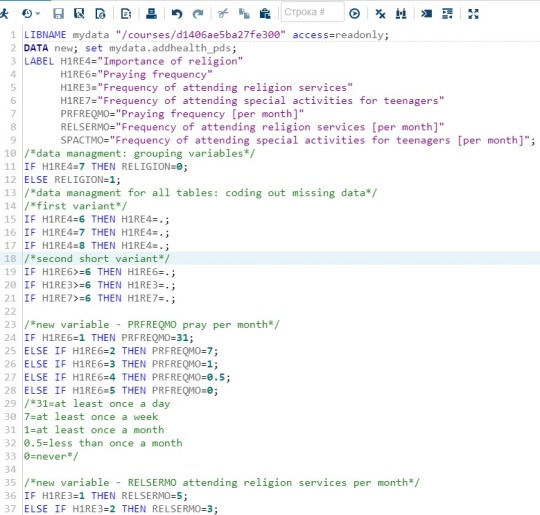
BEFORE
....the code...
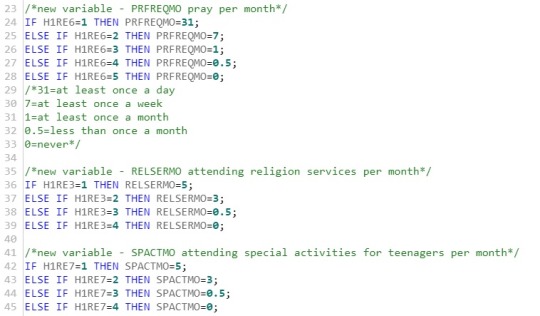
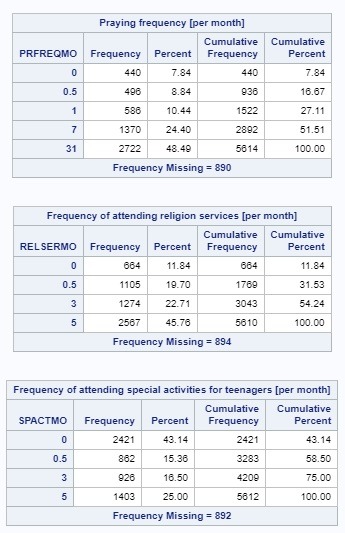
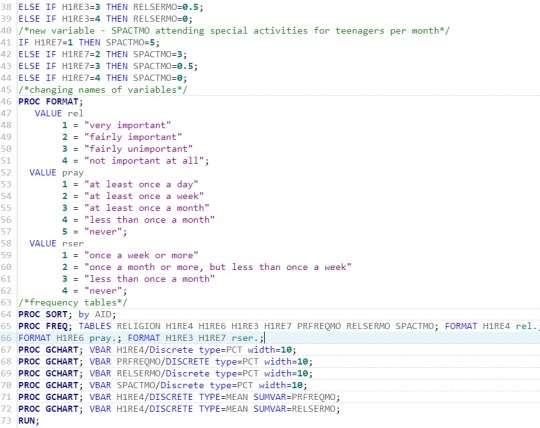
AFTER
GRAPHS
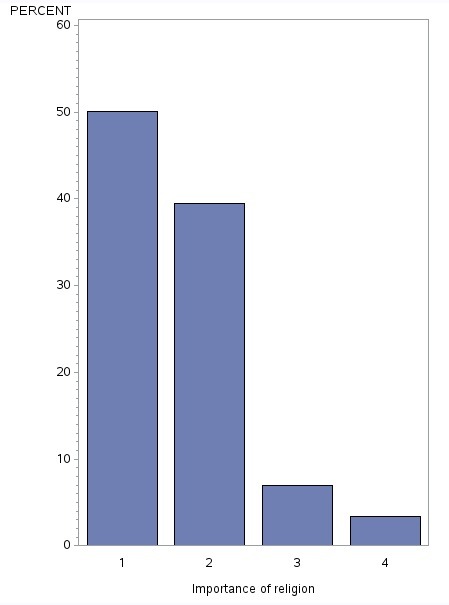
This graph is unimodal, with its highest peak at categorie „1“, what corresponds to “very important”. It seems to be skewed to the right as there are higher frequencies in the first categories.
Center – 2.5 Spread – 1.5
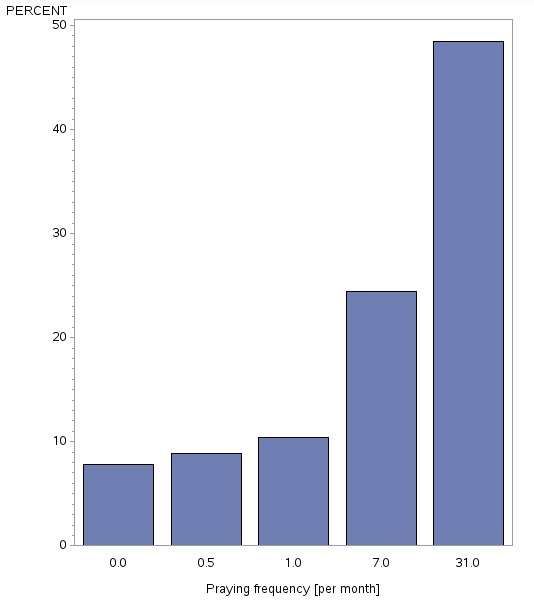
Unimodal, skewed-left distribution. There are higher frequencies in the groups of people, who pray more frequently.
Center – 15.5 Spread – 15.5
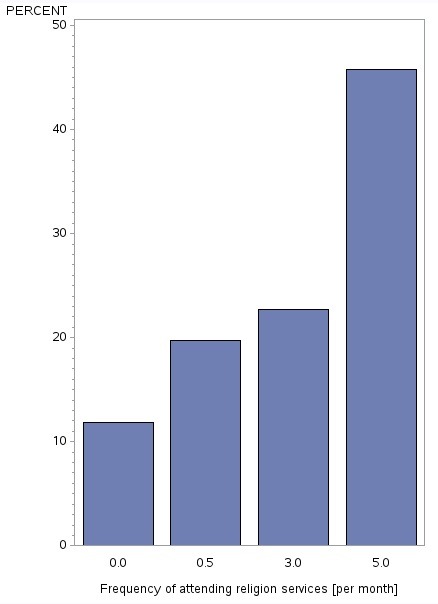
Unimodal, skewed-left distribution. There are higher frequencies in the groups of people, who attend religion services more frequently.
Center – 2.5 Spread – 2.5
PART 2
Relationship between importance of religion and 1) praying frequency 2) attending religion services.
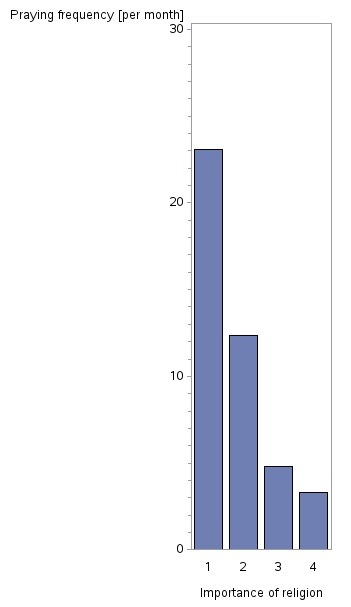
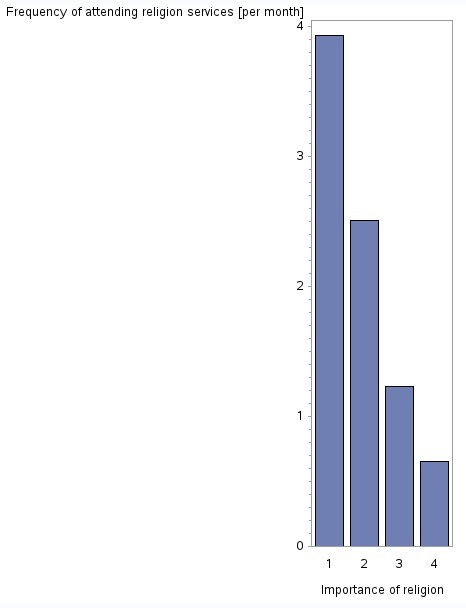
Both graphs are unimodal and tell us that exists positive association between importance religion and how much time person spends for different religious activities.
FULL CODE
0 notes
Text
Data Management and Visualization: Assignment 3
THE CODE
THE RESULT
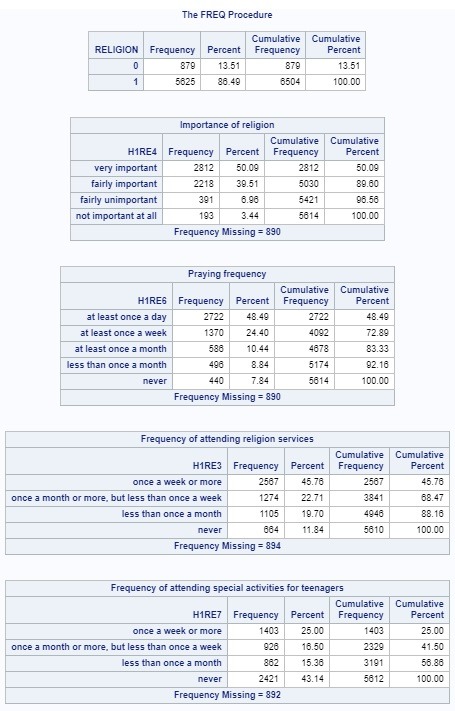
Data management first step was grouping variables: all respondents were distributed in 2 groups (believers and unbelievers). This step was applied to table “Importance of religion” (the original table you can see on the bottom of the post) and output is on the top of the RESULT. It shows, that only 13.51 % of respondents don’t believe in God. Another part (86.49%) is more interesting for my research.
Next goal was coding out missing data in each table. To these data relate values of variables 6 – “refused”, 7 – “no religion”, 8 – “don’t know”. For example, the table “Praying frequency” doesn’t yet include these 3 values and calculation of percent/cumulative percent doesn’t consider 890 missing data observations. This table also says the about half of believers (48.49%) prays at least once a day.
0 notes
Text
Data Management and Visualization: Assignment 2
First of all, tell SAS where to find the data. Then at DATA STEP I created labels and removed ‘’uninformative’ values of variables. It means that the tables don’t include answers like “don’t know”, the cases when respondent refused to answer and the cases when the respondent is atheist. To make output more interpretable at next part of the code were changed name of values, which take variables, from number format to logical statement. And finally displaying the result.
After removing “uninformative” answers I got group of respondents, which consist of 5595 people. I’m looking association between H1RE4 (first table of frequency distribution) and others (H1RE6, H1RE3, H1RE7). Analysis of first columns says that for the half of this group religion is very important and approximately half of them very often prays and attends religion services. Another situation we see in last variable (at the bottom): unlike other variables, frequency distribution of H1RE7 isn’t decreasing function. I think, it could be explained specificity of this kind of activity and dependence on age (“for teenagers”).
0 notes
Text
Data Management and Visualization: Assignment 1
So, after thinking what object of research would be, I have chosen the topic, which is related to religion. It means that I will use data set AddHealth to explore how religion influences human life. More precisely, I’m interested in association between importance of religion in believer’s life and their spiritual activities. For this study were chosen 4 questions, which compose my personal codebook (Section 37: Religion):
How important is religion to you? (H1RE4)
How often do you pray? (H1RE6)
In the past 12 months, how often did you attend religious services? (H1RE3)
Many churches, synagogues, and other places of worship have special activities for teenagers—such as youth groups, Bible classes, or choir. In the past 12 months, how often did you attend such youth activities? (H1RE7)
Research question: is religion associated with that how believer spends his free time?
Hypothesis: the more religion is important in believer’s life, the more believers make time to spiritual activities.
Literature review showed that really exists positive association between how religion important is to people and how often they take part in spiritual activities. It’s possible to describe this association by that way: human believes in God - depending on importance of religion in his life, he often (or not so often) analyses his life, his life’s priorities and asks himself what would God think about him and what would he might to change – to answer this questions he prays and attends religious services.
Literature:
The Psychology of Religious Behaviour, Belief and Experience Benjamin Beit-Hallahmi, Michael Argyle, Volume: 317, Published: 1997
0 notes