#3D_pie_chart
Explore tagged Tumblr posts
Visit Tumblr Blog
Explore Tumblr blogs with no restrictions, modern design and the best experience.
Last Seen Tumblr Blogs


Fun Fact
Users from the US are the majority of Tumblr visitors.
Link

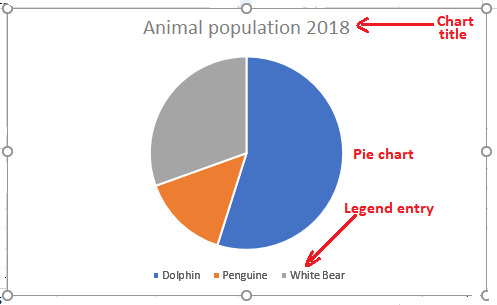
R programming language provides many numbers of libraries to create charts and graphs. A pie-chart is a representation of data as slices of a circle with different colors representing counts or proportions.
0 notes
Text
0 notes