#Best Trade Setup For This Week. Weekly Breakout Trading Chart
Explore tagged Tumblr posts
Visit Tumblr Blog
Explore Tumblr blogs with no restrictions, modern design and the best experience.
Last Seen Tumblr Blogs


Fun Fact
Tumblr has 4 main sources of revenue.
Text
🎯 Complete Guide to Cup and Handle Pattern: Spot, Trade, and Win
The Cup and Handle pattern is a powerful technical analysis tool that traders rely on to catch potential breakouts. Originally introduced by William O’Neil, this chart formation has stood the test of time—from traditional stock markets to modern-day crypto and forex.
If you're serious about identifying high-probability setups, this guide will help you master the Cup and Handle, using real examples from Indian markets, backed by data and insights, and tools like Strike Money.

☕ What Is the Cup and Handle Pattern? (Explained Without the Jargon)
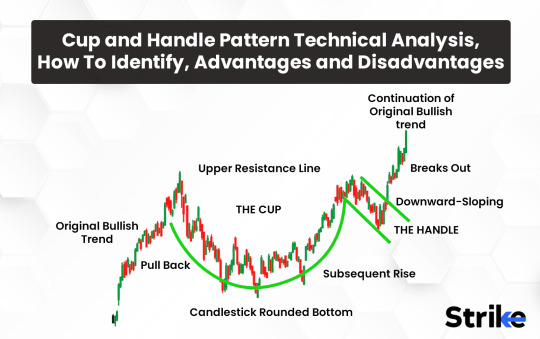
At its core, the Cup and Handle is a bullish continuation pattern that signals the stock is likely to break out and go higher.
Here’s the visual breakdown:
The “cup” looks like a rounded bowl—a smooth, U-shaped correction.
The “handle” is a small consolidation that drifts downward before the price surges upward.
This pattern reflects market psychology. Sellers dominate first (forming the cup), followed by consolidation (handle), and then buyers take control, triggering a breakout.
📌 First coined by William O’Neil in his book How to Make Money in Stocks, this pattern is now widely recognized on platforms like Investopedia, TradingView, and Strike Money.
👀 Spotting a Cup and Handle on the Chart (Even If You’re a Beginner)

Finding this pattern can feel tricky, especially in live markets. But once you know what to look for, it becomes second nature.
Look for these signs:
Timeframe: Typically forms over weeks or months (daily charts work best).
Cup shape: A clean U-shape, not a V.
Volume: Should decrease in the cup and rise during the breakout.
Handle: Small dip of 5-15%, ideally lasting 1–2 weeks.
Example: Tata Motors (NSE: TATAMOTORS)
In late 2023, Tata Motors formed a textbook cup and handle on the daily chart, with resistance near ₹680. After a brief dip, it broke out with volume and surged past ₹750 within weeks.
You can easily identify such setups using Strike Money’s charting filters and pattern recognition tool.
🧠 Why the Cup and Handle Pattern Works (Psychology Behind the Breakout)

This pattern isn’t just random chart art—it reflects investor behavior.
The cup forms as early buyers push the stock up, but it corrects due to profit-booking.
Gradually, it stabilizes as smart money accumulates again.
The handle forms due to hesitation—traders waiting for confirmation.
Once the breakout happens, sidelined buyers jump in, fueling momentum.
In essence, it's a bullish trap-and-release setup. Data from Investor’s Business Daily suggests stocks forming this pattern can rally 15-30% or more post-breakout, if supported by volume.
🧭 How to Trade the Cup and Handle Like a Pro (Even if You’re New)

Once you've spotted the pattern, trading it is all about timing, confirmation, and risk control.
Here’s a step-by-step play:
Wait for the breakout above the resistance (top of the cup).
Confirm with rising volume (at least 1.5x average).
Enter once the price closes above the resistance level.
Stop-loss: Just below the handle’s low.
Target: Measure the depth of the cup and project upward.
Example: ICICI Bank (NSE: ICICIBANK)
In early 2024, the stock formed a cup with resistance near ₹980. After breaking out in February, it zoomed to ₹1,090 in under a month—over a 10% move.
💡 Use Strike Money to set alerts for price crossing resistance levels—no need to monitor charts all day.
📊 Real-World Cup and Handle Examples From Indian Stock Market
Understanding is one thing, but seeing it in action is gold. Here are some solid examples from the Indian market:
✔️ HDFC Life Insurance (NSE: HDFCLIFE)
In Q4 2023, a clean cup and handle pattern emerged between ₹590 and ₹625. The breakout led to a swift move to ₹680—over 9% gain in two weeks.
✔️ Infosys (NSE: INFY)
On the weekly chart in mid-2022, INFY formed a multi-month cup and handle. Once it broke the ₹1,560 resistance, it climbed above ₹1,700 within a month.
✅ Use Strike Money’s historical chart replay feature to study these past setups.
⚠️ Watch Out! Common Mistakes with the Cup and Handle Pattern
Even seasoned traders mess this up. Here’s what to avoid:
❌ Entering Too Early
Wait for the actual breakout above the resistance. A premature entry often results in false moves.
❌ Ignoring Volume
Breakouts without volume confirmation are often traps. Ensure volume is spiking 1.5x or higher.
❌ Misidentifying Patterns
Not every U-shape is a cup. Avoid patterns that look like a V-bottom or head and shoulders.
📉 According to a study by Thomas Bulkowski, the failure rate for poorly formed cup and handle breakouts is over 30%.
Use tools like Strike Money’s pattern validation module to reduce such risks.
🔍 Cup and Handle vs Other Patterns – Which One’s Better?
When compared with other popular patterns, the Cup and Handle often offers a cleaner breakout and higher reward-to-risk. Let’s see how it stacks up:
Cup and Handle: Predicts a breakout after consolidation. Reliable with volume.
Double Bottom: Indicates reversal, but lacks the momentum buildup.
Head and Shoulders: Bearish reversal, opposite in nature.
In trend continuation trades, cup and handle beats the rest due to its smooth structure and predictable breakout zones.
🔄 Is the Cup and Handle Pattern Still Reliable in 2025?
Short answer: Yes—but context matters.
With algo trading and AI tools shaping markets, patterns are evolving. But human psychology? That stays the same.
Recent Data:
A 2024 backtest by a SEBI-registered advisory firm on NSE 200 stocks showed that cup and handle breakouts with volume outperformed other patterns by 11% on average.
In crypto markets like BTC/USDT, this pattern continues to deliver strong gains, especially on 4H and Daily charts.
Use Strike Money’s AI-enhanced pattern scanner to filter for high-confidence setups in real time.
🛠️ Tools and Resources to Master This Pattern (Don’t Trade Blindly)
If you’re serious about trading the Cup and Handle effectively, don’t rely on guesswork.
Best Tools:
Strike Money: Advanced charting, breakout alerts, pattern screeners
TradingView: Community-verified patterns and ideas
Investopedia: Learning basics and definitions
ChartMill / Finviz: Screeners for international stocks
📈 Pro tip: Set filters on Strike Money for:
RSI above 50
Breakout with >1.5x volume
Handle depth <15%
💭 Final Thoughts: Should You Trust the Cup and Handle?
When used right, the Cup and Handle is one of the most reliable patterns in technical analysis. But like any strategy, it’s not magic.
Here's the key:
Wait for confirmation
Control your risk
Combine with indicators like RSI, MACD
Use tools like Strike Money for edge
Markets are noisy. But patterns like this give structure to chaos.
🙋♂️ Quick FAQs About Cup and Handle
Q: Is the Cup and Handle bullish or bearish? A: It’s a bullish continuation pattern.
Q: What’s the ideal timeframe for this pattern? A: Daily charts work best. Weekly charts for long-term investors.
Q: Can I use this in crypto or forex? A: Yes! It works across all liquid markets including Bitcoin, Ethereum, USD/INR.
Q: Where can I practice this pattern? A: Use Strike Money’s paper trading mode and replay feature.
📌 Ready to Spot the Cup and Handle Pattern?
The next time you open your chart, look for the cup. Wait for the handle. Watch the volume. And when it breaks—strike with confidence.
Want an edge? 👉 Try Strike Money to scan, track, and alert you to real-time Cup and Handle setups—across stocks, crypto, and forex.
0 notes
Text
Forex Trading Strategies For Beginners Free PDF Download
I know that it can be incredibly time-consuming, frustrating and just annoying researching Forex trading strategies and different trading styles.
The huge problem is that it is often hard to know if you should use a strategy, if that strategy suits you and your lifestyle, and if it is worth your precious time learning and trading with it.
These are all pretty important to know before you begin devoting your time to learning, trading and mastering them.
In today’s lesson I go through four Forex trading strategies you can learn and use in your trading now.
Download Forex Trading Strategies PDF
A quick note before you go through them; I highly recommend you find one strategy that you like, suits you best and your lifestyle and personality. Master the heck out of that one strategy first and become profitable with it.
It is far faster to learn, master and become profitable with one strategy, than trying to learn a whole bunch at the same time. You can always add more and more strategies when you are profitable, but profits are the key.
This is an in-depth guide, so I have added a table of contents for ease of use below;
Forex Trading Strategies Table of Contents
Forex Trading Strategies For Beginners Free PDF Download
Swing Trading
Why You Should Swing Trade
Why You Shouldn’t Swing Trade
False Breakout Trading Strategy
Why You Should Use False Breakout Trading
Why You Shouldn’t Use False Breakout Trading
Scalping
Why You Should be a Scalper
Why You Shouldn’t be a Scalper
Longer Term Position Trading
Why You Should be a Position Trader
Why You Shouldn’t be a Position Trader
What Forex Trading Strategies Should You Use?
How Much Time do You Have?
What Personality Style do You Have?
What Are You Trying to Achieve?
Lastly
Swing Trading
Swing trading is looking to profit from the next swing the markets make.
As a swing trader you will often be using the higher time frames such as the 4 hour and daily charts and looking to capture large market swings and moves.
As a swing trader you don’t just have to use higher time frames, but you are not breakout trading, false breakout trading or scalping. You are looking to profit from larger swings.
When breakout trading you are looking for really fast price movement and to profit from explosive breaks of important support and resistance levels. If you miss crucial moments, it will often mean you miss the trading opportunity you were waiting for.
Swing trading is not as stressful and you will often have the levels you want to find and then enter your trades at pre-marked so you know when price moves into a level to look for a trade setup.
Because price is not breaking out and making explosive breakout moves, and is often moving over longer periods, you have more time to make your trading decisions and is a less stressful way to trade.
I have attached an example swing trade on the chart below. If price is in an uptrend you would look to identify where the next swing low is going to occur and where you would like to hunt for long trades.
If price moved into this level you would be watching for bullish price action trigger signals to get long and for price to make its next swing higher for you to make profits.
See chart example of this below;
Why You Should Swing Trade
– You have to study full-time or have a job, but still want to trade
– You want to trade higher time frames like 4hr, daily and weekly charts
– You don’t want to use the smaller paced time frames
– You are happy to make less trades that are higher in quality
Why You Shouldn't Swing Trade
– It does not involve entering fast-paced intraday breakout trades hunting for quick wins
– Whether on the smaller or higher time frames it can take time to play out
– You are not moving in and out of your trades quickly
Swing trading can suit a wide variety of traders who are looking to make quality trades and enter into the next swing in the market.
If however, you are looking for a strategy that is fast paced, you are in and out of your trades quickly and you can make many trades in a short period, you may want to use another strategy.
I have an in-depth guide you can use to learn more about swing trading at; Swing Trading Price Action Quick Guide
False Breakout Trading Strategy
A false break can be a very high probability trading setup when you have mastered it and play it at the best areas.
The false break occurs when price looks to breakout of a support or resistance level, but then quickly snaps back in the other direction, false breaking a large portion of the market out.
When the first breakout begins price is looking to breakout and through a support or resistance. In this example we will say price is looking to breakout and through a resistance level.
When price begins to breakout higher a large portion of the market begin to look for the resistance to break and will enter long trades, often setting their stop loss just on the other side of the resistance.
When price begins to move back lower, the market participants who were long and looking for the resistance to break begin to get stopped out of their long trades. As price gains momentum back lower more and more stops are eaten and price completes the false break.
The false break trading strategy opens a lot of potential high probability trading opportunities for you because it can be used on many different markets, many time frames and can be used at the major support and resistance levels.
I have attached an example Bearish Engulfing Bar = BEEB false break of a major level below;
Why You Should Use False Breakout Trading
– Can be traded on many time frames
– Can be used in many markets and pairs
– Can be traded with many triggers as the major entry
– Often entering when the majority of the market has been stopped out entering in the wrong direction
Why You Shouldn’t Use False Breakout Trading
– Can be stopped out quickly if you get it wrong
– Moves can be explosive and quickly lead to a loss
Once you have mastered false break trading it can be incredibly high probability. You will be looking to enter the market when the majority have been false broken in the wrong direction and you can often enter into explosive moves.
You can also use this strategy on many markets and time frames with many triggers for entry.
You can read an introduction guide to using the false break at; False Break Forex Trading Quick Guide
Scalping
As a scalper you are looking to get in and out of your trades quickly and profit from smaller moves in the price action.
Whilst you are looking to make far smaller pip targets, you are looking to do it in far shorter amounts of time than other strategies.
As a scalper you are capitalizing on the bigger markets volatility and quick price movements to make your profits.
A swing trader is looking to enter trades on the 4 hour or daily charts and then hold those trades for hours or days. When scalping you are generally holding your trades for minutes at a time, depending on how small the time frame.
Some traders love scalping as it offers them more potential trading opportunities, they do not have to hold for extended periods and they can close their trades and finish for the session.
Below I have included an example 5 minute chart showing price testing a key level and then forming a huge false break pin bar reversal to get short.
You can learn how to scalp the market with price action and two simple strategies at; Price Action Scalping: Quick Guide
Why You Should be a Scalper
– Fast-paced movements firing off more trading opportunities
– In and out of the markets quickly with little trade hold time
Why You Shouldn’t be a Scalper
– A lot less time to make good trading decisions
– Often leads to more trader errors
– Things can blow out and go wrong very quickly
– Trade costs such as spreads will affect bottom line more heavily
Scalping is not for everyone and is not for the faint of heart.
Whilst most traders start out on the smaller time frames and looking for as many trades as they can humanly find, this does NOT mean it suits them or that it is what they should be doing.
If you are going to scalp trade you need to have every part of your trading style locked down and be ready for all market circumstances that will come your way.
Longer Term Position Trading
Position trading is a trading style where you are looking to hold trades over much longer periods and take a ‘position’ in the market.
This style of trading is normally carried out on the daily, weekly and monthly charts.
As a position trader, you will often be trying to use the overall larger trend to gain the best positions and capture long running trades.
The key to position trading is knowing how to cut your losses relatively soon, whilst maximizing the times you make large running winners. This will often involve pyramiding into your winning positions adding further positions as price moves in your favor.
The best markets for position traders are the clearly trending markets where price is making a clear move in one direction. The weekly chart example I have added below shows an obvious trend higher that is perfect for a position trader.
This is the type of market that is making regular higher highs and higher lows. This gives the position trader a chance to not only add to their position, but use the swing points as areas to move their stop as a trail to lock in profits as the market moves.
Why You Should be a Position Trader
– Requires far less time because not always watching charts
– Less stress because not always watching the markets and the short-term moves don’t affect your outcome as much
Why You Shouldn’t be a Position Trader
– Long trade hold times
– Large stop sizes to hold trades
– Using portion of account for days and weeks on end whilst other opportunities are happening
– Far less trading opportunities
If you don’t have the time to monitor the markets as frequently and are happy to let your trades ride for longer periods of time, then position trading may be for you.
If however; you don’t want to wait long periods for your trades to play out, use huge stops or make smaller amounts of trades, then I would suggest another strategy.
What Forex Trading Strategies Should You Use?
Each trading strategy and style comes with its pros and cons. Some strategies you simply will not be able to use either because they don't suit your time frame and lifestyle or because they are not suited to your personality.
To see what Forex trading strategies suit you best, answer these three questions;
How Much Time do You Have?
This is probably the most crucial question you need to consider.
You need to think about how much time you have to first learn the strategy and then implement it.
If you only have a few minutes each day to monitor the markets, then scalping is not going to be suitable for you at all as you simply will not have the time to make the trades. You could look at position trading or swing trading.
You also need to think about how much time you are willing or able to invest in learning your chosen strategy.
What Personality Style do You Have?
Different personalities are suited to different trading strategies.
You may be a trader who wants to be in the markets, making trades and who is happy to stare at your screen for hours on end.
Or, you may want to use trading to make money, but not spend all of your time watching screens and monitoring every pip movement.
Every trader is different and this is something you need to take into account when you choose your strategy. Don't choose a strategy that will have you watching every pip movement if you are far more suited to making a trade, setting your stop and profit orders and then coming back later.
What Are You Trying to Achieve?
Are you trying to create a lifestyle with more free time, possibly more time with your family and choosing what you do and when?
Or, are you trying to make as much money as possible and are happy to spend all of your time in the markets day in and day out?
Most traders come to trading for money and lifestyle. When choosing your strategy, think about what you are trying to set up and achieve with your trading.
Lastly
Yes, there is a lot to learn, and there are a lot of other Forex trading strategies such as breakout trading, price flip trading and trend or momentum trading, but you only need to start with one strategy.
Find the one strategy that suits you the best, practice the heck out of it on your demo and then become profitable with it.
Once you have become profitable with your first strategy you can add more and more. After becoming profitable and successful learning the first strategy, adding the second, third and fourth becomes a lot quicker as you are using the same base methods.
I hope this in-depth lesson helps you find a strategy to find success with
1 note
·
View note
Text
Technical Analysis on Stocks
Stock Trading Using Technical Analysis – 4 tips for high profits The world of stock trading in unpredictable. To earn profit, you should learn the art of technical analysis. It can help traders earn profits. Using technical analysis correctly can make a world of difference to your investment portfolio. Here we bring to you a few tips to make your equity technical analysis successful. Trade Valid Data When done properly, it can help you get the odds in your favour, and to trade the odds, you need to have access to the meaningful data. Don’t day trade because day traders usually do not win and encountering the problem of short-term volatility is random. Either follow the long-term trend or swing trade while looking for trades that last a week. Understand the concept of breakout methodology While support and resistance can hold, there is always a possibility that it can break. It is an undeniable fact that many of the leading trends in equity trading happen from new market highs NOT market lows. Most equity traders hate purchasing new highs because they feel they have missed some of the other move – while this is true that these trends often accelerate away and you should grit your teeth before entering. Gain better understanding of support and resistance If you want to be a successful equity trader, you need to understand support and resistance in a much better way. Look for valid levels and these levels have been tested many times and in two different time frames. Try and trade these tested valid levels and once again start with the weekly chart and carefully observe whether they line up with the daily levels. These are often counted as the best setups. Use daily and weekly charts The best way to spot the major trends is to the weekly charts as well as daily charts. Remember, in stock trading, profits are typically made over the long run and these are apparent on the weekly trading chart. You can then rely on the daily chart to time your trading signals and exit and entry points. Keep it simple It is always good to keep things simple and so is the case with your trading system. Simple systems work best because they have elements to break and perform robustly in real time trading. Well, technical analysis, when done correctly can help you earn a lot of money in equity trading. By basing your system on the tools discussed above, you can surely start stock trading in a better way.
1 note
·
View note
Text
TRADE MAKER
1. Market View Analysis 2. Stocks Selection 3. Stocks One Side View 4. Global Market Sentiment 5. Index Market Sentiment 6. Setup Check
1. Market view analysis
I. Psychology concept
i. Investing hedging.
( i. Market up Trend. future buy and OTM PE buy. ii. Market town Trend future sell and OTM CE buy)
ii. Option selling
( i. Market continue higher hai ban ke upar ja raha hai, bahut upar ja chuka hai ab lag raha hai market niche a sakta hai ya FIR hold kar sakta hai, ham OTM CE short karenge. Or kuchh trader ko lag raha hai market aur bhi upar ja sakta hai to ham OTM PE short karenge)
iii. Breakout fail scenario
(i. Market Breakout stage mein hai, Breakout stage main buyer apna position hold karta hai,next day market flat khule to sideways Ho ke upar jaega, ya FIR small Gapps up mein khule to feel karne ke bad FIR high break kartehi ham aggressively buy karenge. but market bahut bada gap-down khulata hai tu buyer apna position chhor denge aur price action dekhne ke bad fresh saller a jaega market ko niche laane ke liye.)
iv. First pullback
(i. Market jab bhi trending hota hai upside ya FIR downside, trending market ke andar market opposite side aaye to buyer aur saller fir se buy or sell kare market ko bhej dega. ii. Big player footprint. iii. Support and resistance)
v. Trending
(i. Upside trending market mein, bahut bara gapps up market open ho jata hai to first time profit booking, fir price action dekhne ke bad fress seller a jaega market ko niche laane ke liye. Or ii. Downside trending market ke andar, market bahut bara gapps down mein open ho jata hai to, first time thoda sa profit booking FIR uske bad negative sentiment kam Karega.)
vi. Pol&flag
(i. Market thoda sa upside trending tha next day market gapps mei open Khul ke Pol banaake flag pattern ban raha tha. Profit booking thoda aane ke bad market hold kar raha tha resistance level per aur 12:30pm ke bad FIR Breakout de Diya)
vii. Weekly expiry
(Weekly expiry mein OTM CE or PE 0 ho jata hai. OTM CE or PE short and Hold.)
viii. Range breakout
(i. Market jab bhi range mein rahata hai, vah kisi bhi side Breakout de sakta hai. ii. Trend reversal iii. Resistance breakout)
ix. Trending but small time frame
(i. Market hamesa trending uske bad volatile uske bad sideways uske bad fir se traind decide hota hai upside ya fir downside. ii. Jab bhi market trending hota hai small time frame mai, multiple time support and resistance banta hai aur Market jab reverse aata hai usi support and resistance per time spent karta hai aur sideways market banta hai. iii. Best move hota hai traind ki sath chalna.)
x. Sideways market (short straddle)
(i. Market hamesha trending uske bad volatile uske bad sideways uske bad fir se traind decide hota hai upside ya fir downside. ii. Market trending hone ke bad market jab reverse aata hai buyer aur seller fight karta hai aur sideways market banta hai. iii. Short straddle)
xi. Short strangle
(i. Market continue higher high ban ke upar ja raha hai aur weekly expiry bhi najdeek hai ab lag raha hai market aur upar nahin ja sakte ham out-of-the-money call short karenge, market niche aaega to humko profit milega market sideways bhi chala jata hai to bhi humko loss nahin hone wala kyunki timing ki vajah se ya fir greeks ki vajah se humko profit milega. ii. Aur kuchh trader ko lag raha hai market aur bhi upar ja sakta hai to ham out of the money put short karenge, market upar jayega tabhi humko profit milega market sideways bhi chala jata hai to tabhi humko profit milega.)
xii. Sideways to trending
(i. First pull back Or ii. CE>PE)
II. Chart reading concept
I. How to sale in uptrend market
(i. Upside tending market ke andar first negative candle dekhte hi ham galti se bhi short nahin karenge jab tak double top pattern banata nahin aur last niche ka swing break nahin karte ham aggressively sell nahin karenge. ii. Downside tending market ke andar first positive candle dekhte hi ham galti se bhi bye nahin karenge jab tak market double bottom pattern banata nahin aur last high swing break nahin karte ham aggressively by nahin karenge.)
II. How to identify crash market
(i. Monthly chart pe market kabhi bhi 90° angle mein move nahin karta, sustainable muve hota hai 45°. ii. Weekly chat pe market higher high price action ban raha tha abhi niche raha hai. iii. Daily chat pe market trend line break down first and price action create next trend change.)
III. How to identify invest market
(i. Monthly chart pe market poll& flag pattern banaya tha. Poll ka 50% rivers hke abhi hold karne ke bad ek positive moment dikh raha hai. ii. Weekly chart pe market hold karne ke bad first time upside trending ho raha hai, downside tending market ke andar market Job first time upside momentum Karega seller resistance mein hit Karega seller fir se try Karega market ko niche bhejne ke liye. But buyer strong hoga to support pe FIR upside momentum Karega o confirmation hoga buying ke liye. iii. Daily chart per market continuously hold karne ke bad first time Breakout Diya uske bad jab pull back dega ham buy karenge.)
IV. Mean and reversal
(i. Weekly chart pe market downside tending dikh raha hai, or monthly chart pe upside. ii. Moving average indicator dekhne se pata chal raha hai market already bahut bara stratech ho chuka hai,so market Ko mean hone a sakta hai. ya fir market hold kar jaaye aur moving average slow and study upside momentum Karega. ii. Top mein strong negative candle iii. Trendline break down and price action create. iv. 15 minute range, negative pattern, daily negative scenario.)
V. Hidden price on point
(i. Weekly chart pe market downside tending or negative candle ha, negative candle ka low break hote hii hum aggressively sale kar sakte hain. ii. Next day market gap up open hke negative candle ka high break karke, uske next week positive candle ka high break karte hii hum aggressively buy kar sakte hain. iii. Stretch ho chuka hai, main hone aana padega. iv. Top mein strong negative candle v. Trendline breakdown and price action create. vi. 15 minute range, negative pattern, daily negative scenario.)
VI. Market crash next invest
(i. Daily and weekly chart per market ko hold karne ke bad higher hai price action Banna padega uske bad ham investing ke liye sochenge.)
VII. Trendline
(i. 1 hour chat support and resistance identify ii. strong candle identify. iii. First trendline break and price action create next traind change.)
VIII. Range breakout
(i. Weekly chart per body to body breakout. ii. Small stop loss. iii. Re Entry.)
IX. Trending market big gapps for global sentiment
(i. Upside tending market, big gapps up open first profit booking, 2nd price action. ii. Downside tending market, big apps down open first profit booking, 2nd negative sentiment.)
2. Stock selection I. Breakout trading strategy
(i. Ascending triangle pattern. ii. Descending triangle pattern. iii. Range breakout. iv. Pole and flag pattern.
II. Trendline swing (top & bottom)
III. Big player footprint
(i. Jaha se sarf buy hota hai o support level. Or jaha se sarf sell hota hai o resistance level ii. Usi support and resistance paint Pe market job first time ate ha,buyer fir se buy or seller fir se sell karte ha .2nd time ate hato half quantity pe trade lesakte ho.)
IV. Support and resistance
(i. Current market price se left side high swing resistance Or low swing support hota hai. Support and resistance ko market hamesha respect karta hai.
ii. Buy Or sell karne ke bad market teji se jakar kisi support and resistance per hold kare to best time for profit booking.
iii. Market price support and resistance ko multiple time test karta hato o weak and break hota hai.
iv. Market jab open hota hai, ek High point hota hai aur ek low point hota hai aur market price action create karta hai.
v. Trade hamesha first pull back.
vi. Market price action create but still support and resistance hare, wait for trade.
vii. Market consolidation Jone mein chal raha hai, upside Breakout kya hai jaane do 1st time retest Kare, tab trade lenge.
viii. ISI ke alava, 2nd time yah, 3rd time trade nehi lenge. Kyunki market head and shoulder pattern banaa sakta hai. ix. Suddenly market up and down for reverse.
V. Gapps
VI. Inside candle
VIII. Best time exit
(i. Market view analysis. ii. Global market sentiment (psy + news) iii. Trade buy or sell.... setup + chart 1. Setup identify. 2. 1 & 5 minute chart pe confirmation fast, then trade. 3. Maximum higher high time freme mein shift. 4. Find support and resistance (big+tgt) 5. Position sizing 6. Risk and reward (profit space 1: 2) 7. Upside tending slowly & downside trending fast. 8. 90° not & 45° substandard 9. Upside tending 1st negative candle never sell & Down side trading 1st positive candle never buy. 10. Trend reversal. iv. Stop loss always train for profit booking. v. Find support and resistance ( big + tgt) vi. Weekly expiry otm PE+CE 0 and hold.
VIII. RSI
3. Buyer stock only buy. Seller stock only sell.
4. Global market sentiment i. (psychology+ news)
5. Index market sentiment i. Sentiment positive Buying breakout stock hold and wait. Or selling Breakout stock exit. ii. Sentiment negative Buying Breakout stock exit. or selling Breakout stock hold and wait.
6. Setup check
I. Advanced setup:- i. Breakout identify. ii. Market flat open. iii. Morning breakout.
II. Price action setup:- i. Trending market. ii. Gapps open.
III. Gapps setup:- i. Trending market. ii. Price action working.
IV. Top and bottom setup:- i. Morning mein trending. ii. 90° move . iii. Double top & double bottom.
V. Inside candle setup:- i. Morning mein trending. ii. Inside candle create.
VI. Resistance Breakout setup:- i. Time (morning / 12:30 p.m.) ii. Upside trending slowly, downside trending fast move. iii. Market 90° Not / 45° substandard. iv. Resistance pe time spend. v. Setup.
VII. Positional trade setup:- i. Minimum time frame 15 minut. ii. Correction (stocks 5-10%index 400pt) iii. Support pe 1st time test Respect. ( i. Big players ii. Trendline iii. w pattern iv. Consideration ) iv. Resistance 1st time test Respect. v. Find support and resistance. vi. Position sizing vii. Risk and reward (prophets place 1:2)
0 notes
Text
Cannabis Stocks: Is It Worth Investing Right Now?
If you're a beginner and don't shrewdness securities market work then you may find yourself with large losses. If the level is below than this then you run the risk of being stuck in a position simply because there are no traders on the other side. I entered the trade at the price of 66.44. In next 4 days it went up by around 1%. I sold half my position around 74. 26 and moved stop on rest to 73.75 to lock in profit and got stopped out. My point is this, when something is not right, get out first. I would be a buyer on pullbacks to the low $20's if you get another chance. Buyers are continuously supporting such the boutique s and this constant demand results in a very smooth uptrend with shallow pullbacks. Many are very uncomfortable buying breakouts. We had a big debate on buying breakout sometime back on a member's site. I would not be buying FAZ right now at all.
Small Cap Bull 3x (TNA) - TNA is now nearing $60 per share. A stock that would make 6% move in few days now makes 10% plus move in same time period. I do not trade ETFs and my logic regarding this is clear - stocks make bigger moves than ETFs. Perhaps a trade that didn't work the way you planned. Even the best looking breakout with catalyst does not work in bearish phases. Exhaustion setups are best setups in this market currently. Yes there are complexities involved in trading stocks and you are exposed to news risk in stocks, but the big opportunity in the market is in stocks. They like pullbacks. One of the members made a very good observation - a good stock should never offer you a pullback opportunity. Kirk: Care to share another one? Kirk: That's an interesting observation and confirms something I'm seeing as well.
Kirk: Well said and I see the same issues. SGX just doesn't understand the capital market and stock trading exchange well enough. This is more a pullback or exhaustion setup kind of market. Episodic Pivots is a news or catalyst based setup. A breakout on high momentum stock and the second setup I trade is Episodic Pivots. These kinds of stocks have very orderly corrections and trade very logically. I trade primarily two kinds of setups. They are good vehicle for many kinds of investors and short term traders. “Vaccine execution risk, delayed fiscal stimulus and longer lockdowns are risks. He said his plan “includes money for state and local governments and robust liability protections for businesses, schools and universities.” Last week, a bipartisan group of lawmakers had unveiled a stimulus outline worth about $908 billion, which diverged from Mnuchin’s plan on some key issues, including offering $300 per week in augmented unemployment benefits absent from Mnuchin’s proposal.
Each of the three major indices ended the week slightly higher, however, with the Nasdaq leading with an about 3% weekly advance. Everything I do is based on daily or weekly charts. Quest sends morguefile creatives on a daily photo challenge to capture the world around you. It is a good time to be old because they are going to print a lot of money. A relatively young market with promising companies that are still at the very beginning. A familiar trifecta of headwinds is still facing the market, Smith said in an interview: election uncertainty, questions about fiscal aid, and logistics for rolling out a vaccine. If you are looking for more ideas, check out my stocks to buy 2017 page to see my latest stocks picks. Below is a list of stocks that are worth watching for July 6, 2009. Also, check out the Biggest stock Gainers of the Day. Be sure to check out the Top 2009 Penny stock Gainers on the NYSE, Nasdaq, and AMEX.
0 notes
Text
XRP Rally Risks Strong Retracement in Pivotal Battle With Bitcoin
After years of underperformance compared to the rest of the crypto market, XRP has been pumping from bear market lows. But just as the altcoin reaches a key level on its Bitcoin trading pair, an ominous sell signal has triggered.
Will the recent rally in Ripple fully retrace as pumps have in the past? Or will the cryptocurrency finally recover in its ongoing battle against BTC?
David Versus Goliath, Ripple Versus Bitcoin
XRP has been in a brutal downtrend on the BTC trading pair and remains over 90% down from its peak.
Making any sort of recovery against Bitcoin has proven unsuccessful for XRP over the last three years. It’s cemented the altcoin’s status as the worst performer in the crypto market.
It was even “flippened” by Tether for the third spot in the top ten crypto assets by market cap.
Over the last few weeks, however, XRP may have finally found its bottom. Multiple signals potentially confirm a breakout from nearly three years of downtrend resistance and bullish momentum is building.
Related Reading | The Price Trend of XRP Stunningly Reflects That of Sheep Manure Stock
This week alone the now fourth-ranked cryptocurrency is up over 12% against USD. At the high, the asset was up 20% on the dollar-based pair.
The native token to the Ripple protocol also gained 10% against Bitcoin during this time. The gain represents the largest outperformance against BTC since before Black Thursday.
But the rally could be over or at least see a strong retracement due to a “9” sell setup on the TD Sequential indicator.

Ripple XRPBTC TD Sequential Daily | Source: TradingView
Conflicting Signals Leave XRP Rally Against BTC In Jeopardy
XRP can’t seem to catch a break against Bitcoin. Just as the asset stages its best chance at a sustained recovery in months, the TD Sequential indicator issues a 9 sell setup.
The last time the signal triggered, the altcoin dropped 35% against BTC.
As of the time of this writing, the sell setup hasn’t yet perfected. Doing so would require a new higher high set today beyond Thursday’s high of 2250 sats.
There are also conflicting signals on the indicator. On the quarterly XRPBTC chart, there’s also a 9 buy setup.

Ripple XRPBTC TD Sequential 3-Month | Source: TradingView
Higher timeframes are given more weight in terms of signals. A buy signal across 27 months of price action versus just 9 days, is bound to be more significant.
Related Reading | Ready For Liftoff: Two-Year Downtrend Breakout Could Lead to $14 Ripple
There are also several other potential signs that XRP has bottomed and even the latest 9 sell setup won’t stop the asset’s explosive momentum.

Ripple XRPBTC Weekly | Source: TradingView
During 2017 there were two distinct pumps against BTC. Each time, Ripple rocketed by over 1000% in less than two months.
If the cryptocurrency is ready for another similar surge, this latest sell setup could be a fakeout or a false signal. Or perhaps any resulting downside is extremely short-lived.
from CryptoCracken SMFeed https://ift.tt/2OiDa6u via IFTTT
0 notes
Text
XRP Rally Risks Retracement, Faces Pivotal Battle With Bitcoin
After years of underperformance compared to the rest of the crypto market, XRP has been pumping from bear market lows. But just as the altcoin reaches a key level on its Bitcoin trading pair, an ominous sell signal has triggered.
Will the recent rally in Ripple fully retrace as pumps have in the past? Or will the cryptocurrency finally recover in its ongoing battle against BTC?
David Versus Goliath, Ripple Versus Bitcoin
XRP has been in a brutal downtrend on the BTC trading pair and remains over 90% down from its peak.
Making any sort of recovery against Bitcoin has proven unsuccessful for XRP over the last three years. It’s cemented the altcoin’s status as the worst performer in the crypto market.
It was even “flippened” by Tether for the third spot in the top ten crypto assets by market cap.
Over the last few weeks, however, XRP may have finally found its bottom. Multiple signals potentially confirm a breakout from nearly three years of downtrend resistance and bullish momentum is building.
Related Reading | The Price Trend of XRP Stunningly Reflects That of Sheep Manure Stock
This week alone the now fourth-ranked cryptocurrency is up over 12% against USD. At the high, the asset was up 20% on the dollar-based pair.
The native token to the Ripple protocol also gained 10% against Bitcoin during this time. The gain represents the largest outperformance against BTC since before Black Thursday.
But the rally could be over or at least see a strong retracement due to a “9” sell setup on the TD Sequential indicator.

Ripple XRPBTC TD Sequential Daily | Source: TradingView
Conflicting Signals Leave XRP Rally Against BTC In Jeopardy
XRP can’t seem to catch a break against Bitcoin. Just as the asset stages its best chance at a sustained recovery in months, the TD Sequential indicator issues a 9 sell setup.
The last time the signal triggered, the altcoin dropped 35% against BTC.
As of the time of this writing, the sell setup hasn’t yet perfected. Doing so would require a new higher high set today beyond Thursday’s high of 2250 sats.
There are also conflicting signals on the indicator. On the quarterly XRPBTC chart, there’s also a 9 buy setup.

Ripple XRPBTC TD Sequential 3-Month | Source: TradingView
Higher timeframes are given more weight in terms of signals. A buy signal across 27 months of price action versus just 9 days, is bound to be more significant.
Related Reading | Ready For Liftoff: Two-Year Downtrend Breakout Could Lead to $14 Ripple
There are also several other potential signs that XRP has bottomed and even the latest 9 sell setup won’t stop the asset’s explosive momentum.

Ripple XRPBTC Weekly | Source: TradingView
During 2017 there were two distinct pumps against BTC. Each time, Ripple rocketed by over 1000% in less than two months.
If the cryptocurrency is ready for another similar surge, this latest sell setup could be a fakeout or a false signal. Or perhaps any resulting downside is extremely short-lived.
from Cryptocracken WP https://ift.tt/2OiDa6u via IFTTT
0 notes
Text
5 Big Myths of Technical Analysis
By: Kevin Cook June 11, 2019
Tease: Charts can boost your profits with better entries and exits—if you avoid these pitfalls
Is there one system of technical analysis that makes all the others crumble in defeat?
If there were, giant quantitative trading houses like Citadel and Renaissance Technologies would not be employing hundreds of PhDs in mathematics, engineering, and computer science to develop hundreds of new algorithmic programs for exploiting market opportunities.
But does that mean we should abandon technical indicators as a bunch of inconsistent noise that we can't use to compete against the quants' mega firepower?
No way! There are plenty of terrific technical tools and methods that can enhance your stock selection and swing trading. But first, you need to clear away five big myths and pitfalls that get in the way of seeing how to use them.
1) Everything Is Reflected in Price
Even though over $8 trillion is indexed to the S&P 500 for fundamental reasons by mutual, pension, insurance, and hedge funds, the pure technician believes that the chart holds all the information you need about supply and demand for a stock. They say you don't need to pay attention to fundamentals because "price tells you what the institutional investors think of the fundamentals."
But using a simple indicator that measures earnings momentum — the Zacks Rank — I can show you how thousands of stocks were first discovered to have potential fundamental greatness that led to tremendous returns.
Consider The Trade Desk (TTD), the automated exchange for digital, omnichannel advertising. The Zacks Rank spotted this one as a winner at $50 in early 2018 and every quarter of positive earnings surprises and upward estimate revisions kept TTD a Zacks #1 Strong Buy as shares climbed above $250 this month.
Another terrific example has been Veeva Systems (VEEV), the specialty software platform provider to pharma and biotech companies. VEEV became a Zack #1 Rank Strong Buy in early 2017 near $40 and the stock vaulted 85% this year to $166 as it consistently earned that rating for 5 straight quarters of beat-and-raise goodness.
Traders who only look at the charts questioned me every time I recommended buying these stocks many had never heard of. Their charts told them to sell, while the Zacks Rank and my trend indicators, plus institutional "behavioral" sentiment, told me to buy.
If markets were completely rational and efficient, smart investors who combine "technicals" and fundamentals would not have doubled or even tripled their money swing trading TTD and VEEV shares the past two years.
2) Trend Lines Are Meaningful and Predictive
Markets are the most complex and dynamic systems on the planet. Indeed, they are social cauldrons with nearly infinite variables and geometric drivers. So why do "old school" traders still draw straight lines connecting price highs and lows — over months or even years of economic events and data — and expect a non-linear system to obey them?
Because they are simply stuck in the sacred rituals of the past. I predict that one day very soon the venerable leaders of technical analysis societies will abandon trend lines as mathematically absurd.
More importantly, I am busy forecasting which highly-Ranked stocks are lining up with my preferred technical indicators to signal great buying opportunities.
Since 1988, it has more than doubled the market, averaging +25% per year.
Now a research development is adding pinpoint technical analysis to strong Zacks Rank stocks for even more timeliness, accuracy, and profit potential. Recently this approach has closed timely gains of +30.8%, +25.5%, and even +81.5%.
The key is screening down the best 880 Zacks Rank stocks to a small selection poised to make big, quick moves.
3) The Algos Have Taken Over the Game
As I mentioned in my intro, the quant houses and their computer "algos" have changed the game a little bit. Since they can move large amounts of money very quickly, in and out of stocks with completely-automated risk control, they have no fear... and lots of profits to count.
And they also exploit lots of traditional technical analysis with their hammer-blow strikes, forcing false breakouts and breakdowns, toying with trend-line traders, and manipulating volume and price with off-exchange "dark pool" trades.
But they do not own the game because stocks and trillions in investment dollars still follow one eternal trend force that supersedes the daily chop and weekly volatility: long-term earnings momentum. And that means your job as a trader is to use technical analysis to spot killer entry and exit opportunities in fundamentally-strong stocks.
4) Magic Numbers Exist for Moving Averages
I traded currencies at the institutional interbank level for a decade. As an FX market maker providing liquidity to the biggest banks and hedge funds in the world, I traded an average of $100 million per day.
During that time, I ran back-tests with years of price data to find the "optimal" moving average combination for any time frame. Guess what? No combination was consistently better than any other. No magic numbers or Fibonacci sequences made any more difference than simply using multiples of 5 or 10 and bands of support and resistance.
In most cases, keeping it simple and consistent with technical indicators really works because the critical skills involve your research process, execution, discipline and risk management.
5) Trading is Simple and Requires Only a Few Chart Setups
Simplicity works to manage the info-overload of markets. But, there is a big misconception that anyone can walk into the trading arena with a few simple chart setups or indicators and cash in.
The truth is that building expertise in trading can take many years of mistakes, losses, and frustration before you cross over into a realm where you know how to balance all the macro noise and news with your own solid research and discipline — and a probability-based mindset that knows how to beat the emotional demons with math, logic, and calculated risk.
For instance, did you know that your brain is emotionally hard-wired to break the "golden rule" of trading? Cut thy losses short and let thy winners run is so hard because human behavior is predisposed to emotionally overreact to fast-moving green and red bars as your account value fluctuates and greed, fear, worry and regret take over.
You Break the Golden Rule, You Break Your Portfolio
In short, most traders hate to take losses and they grab most gains far too quickly, which is the recipe for a busted trading account.
So even if someone hands you a top trading system or set of rules, you still have to learn the mental and emotional game, and sort through the jungle of technical indicators, patterns, and advice-givers. I'm grateful I did all that work over the past 2+ decades.
But I wouldn't want to start there again without a guide to show me the way. I hope my myth-busting helped you a little — or a lot — on your journey as a trader.
More Help for Your Profit Potential
Meanwhile, if you're looking for better trading entries and exits, I have some good news:
We've combined our powerful Zacks Rank fundamental system with pinpoint technical analysis to achieve the best of both worlds in our portfolio service, TAZR (Tactical Analysis + Zacks Rank).
Of course, you can uncover some of these enhanced trades on your own if you start with the 880 Zacks Rank #1 and #2 stocks. There isn't a better fundamental indicator of what and when to buy. Then reduce the list down to an investable few by adding technical signals for even greater accuracy and timeliness.
That may sound simple, but as I suggested earlier, it takes more than a few chart setups to catch the right trades at the right times - and it can take years of learning through trial and error to get good at it.
That's where TAZR comes in.
Our goal is to land double-digit wins in a matter of weeks and you're welcome to follow along. During the past year we've closed timely gains of up to +81.5%.
Just Released: Get started today and you can also download our brand-new Special Report, 5 Stocks Set to Double. One of them is my personal choice for explosive long-term gain potential.
But don't wait as this opportunity ends Sunday, June 16.
Look Into TAZR and 5 Stocks Set to Double now »
Good Investing,
Kevin Cook Senior Stock Strategist
Kevin Cook, Senior Stock Strategist at Zacks, is a leading expert in technical analysis and what makes markets move. He provides commentary and recommendations for the Zacks TAZR portfolio.
0 notes
Photo

$POT - 8.2.2017 entry analysis
Setup: Botomming base Flip
Or maybe not... In order we all being able to learn from my mistakes, I will definitely be posting my bad trades as well. Even though I believe in learning from our best trades (how we can imitate and execute them again), we must learn from our bad trades too (what NOT to do next time).
That “or maybe not” at the beginning is there because it’s probably not a proper bottoming base Flip. In the hindsight I see, price has never broke out of the consolidation. That’s because the resistance is a bit higher around 19. And those two breakouts are just failed breakouts, forming a double top.
Not only that, but I also didn’t follow my rule of price breaking the weekly upper band to show the strength of the trend. Even though I don’t need violation of the WEEKLY upper band when entering at the Bottoming base Flip, I still need it on the DAILY. Yes, it happend, but it wasn’t nothing major. Looking at the chart more and more, I don’t see any strength, just a continuous sideways action. Also, daily EMA20 flat for a couple of weeks already and the weekly is rising by just a little.
This trade may have worked or it may have not. The more price fluctuated around my entry level, the less I liked it. Therefore, I was trailing my SL quite aggressively, getting hit at -0.5R at the end. I’m satisfied with the outcome. I took a very small loss which I paid for a new lesson in my personal strategy development course :-) That’s how you should observe your losses too. Take screenshots, learn and write about them. It really helps a lot!
Lessons reiterated and learned
1. In order to be continuation of a pullback more probable, there needs to be strength during the trend first. 2. Always be cautious of these double tops before my entry. 3. When trading Bottoming base Flip, be aware of all the levels because most of the time, it’s not that clear on the first sight which level is the major one.
And now a screenshot of where the resistance of the bottoming base might be drawn, and where it probably really is.
(Right click the image and select “Open image in new tab”)

These levels can make a HUGE difference in your trading. I’m still learning but constantly drawing them on wrong places can cost you a lot of money.
4 notes
·
View notes
Text
New Post has been published on Forex Blog | Free Forex Tips | Forex News
!!! CLICK HERE TO READ MORE !!! http://www.forextutor.net/how-to-use-price-action-to-trade-new-trends/
How to Use Price Action to Trade New Trends

Talking Points:
– The trending market condition is one of the more attractive given the potential for strong risk-reward outlays.
– While ‘the trend is your friend’, timing entries into that trend is what often differentiates success from failure. In this article, we look at how traders can use a combination of multiple time frame analysis and price action in the effort of timing trend-side entries.
– If you’re looking for trading ideas, check out our Trading Guides. And if you’re looking for ideas that are more short-term in nature, please check out our IG Client Sentiment Indicator.
To receive James Stanley’s analysis directly via email, please SIGN UP HERE
‘The trend is your friend’. We’ve all heard it, and it makes perfectly logical sense; but in practice, this advice is so opaque that it’s practically worthless. Because even if you’re on the ‘right’ side of whatever trend is showing at the moment, the timing and entry into that setup is likely what’s going to determine one’s success or failure on that individual trade. So, it’s not enough to just find the direction of the trend and then ‘hope’ that we’re right; we also have to find support (or resistance for down-trends), we need to be patient and exercise discipline while waiting for the setup to build, and then we have to identify risk levels so that if/when we’re ‘wrong’, we have a line in the sand with which to bail in order to save the rest of our equity. In this article, we’re going to share a five-step process for traders looking to trade into new or ‘fresh’ trends using price action.
Know Your Time Frames
New traders often wonder ‘which time frame is ‘best’’? This is very similar to asking ‘what is the best temperature’. Well, it’s relative. Some like it colder, others like it warmer; but by and large most people are in the same ballpark range of comfort. Chart time frames work like this, as well. If you’re a scalper looking to hold positions no longer than 20 or 30 minutes, the setup on the monthly or weekly chart is probably going to be so divorced from the dynamics that you’re following that you might as well be looking at another market altogether. And if you’re trading a monthly setup, what’s taking place on the one or three minute chart is probably going to be pretty inconsequential to your ‘big picture’ setup.
There is no ‘best’ time frame. Time frames are merely different looks at the same picture; with the shorter or tighter time frames offering a more granular, detailed look at near-term price action. The downside to this greater detail is noise; as those shorter time frames are, in general, considerably noisier than longer-term charts. But the longer-term charts are significantly slower and not nearly as actionable; so the prerogative here should be one of balance.
Multiple time frame analysis is the process of using a variety of chart time frames to plot strategy for a market. This has the benefit of getting the consistency of the longer-term charts along with the granularity and detail of the shorter-term charts. The downside is that an element of subjectivity is introduced as we’re now analyzing two different charts; but provided that the trader can find ‘balance’ between the utilization of these charts, the benefit should far outweigh the additional subjectivity that’s introduced.
Trader ‘Style’
~ Holding Period
Trend Chart
Entry Chart
Long-Term
1 Week +
Weekly
Daily
Swing-Trader
few days – few weeks
Daily
4 hour
Short-Term
few hours – few days
4 hour
1 hour
Day-Trader/Scalper
< few hours
1 hour
15 minute
Created by James Stanley, originally published in The Time Frames of Trading
Don’t Chase the Breakout
The period that is often most dangerous to trade a new move is also when it happens to be the most attractive, and that’s when prices are breaking out of previous support or resistance. Breakouts can be difficult to trade, even for experienced traders, because by nature it’s the process of something ‘new’ happening and thereby there’s no recent data or observations from which we might be able to derive strategy.
Chasing breakouts, or buying after price has already run through resistance or selling after price has dropped through support, can often lead to challenging trades. Even if you’re right on the direction, you’ll often have to let the position retrace against you before the ‘trend-side’ move continues. So, rather than chasing a new breakout – wait. Let price action run-higher or lower, and chalk away the potential for a trend-side entry in the not-too-distant future.
Use the breakout merely as a signal: The fact that buyers were able to power-thru resistance can be a positive indication of further top-side potential. But rarely is a market one-sided; after that new-high comes-in, we’ll often see traders taking profit; and even some trying to fade the move. Combine this with the fact that buyer demand is likely diminished by the fact that prices are now-higher; and we have a recipe for a pullback. This is the exact time that you do not want to be chasing a move higher.
Chart prepared by James Stanley
Wait for Support to Show-Up Around Prior Resistance (for up-trends)
Watching a fresh breakout can be trying for a trader’s patience, and for the new trader that can be a challenging exercise as their only real option whilst watching a breakout take place is to either chase it, or fade it (go short after a bullish breakout). Given that a breakout is, by definition, a ‘new’ observation of higher or lower prices, this is an inopportune time to open positions.
Instead, that prior level of resistance that had previously capped price action can now be re-assigned as potential support. Traders can let the breakout develop, and let the market set a new short-term ‘higher-high’. After that new high is set, traders can then wait for the next ‘higher-low’, and this will often show-up at or around a prior resistance level.
We discussed this concept in the article, A Simple but Effective Price Action Tell, and on the chart below, we can see multiple iterations of this taking place in the recent move in EUR/USD.

Chart prepared by James Stanley
Use the Shorter Time Frame to Confirm Support & Early Stage of Directional Move
Once the breakout has been found, and once the pullback has gotten under-way, traders can begin to plot their trend-side entries. This is where the greater detail and granularity of that shorter-term chart can be helpful from the additional perspective that’s provided.
To attempt at timing the entry, the trader can wait for the pullback to begin to slow. So if we’re looking at a bullish move, we’d want to have already seen the breakout produce the higher-high, followed by a pullback bringing price closer to prior resistance; at which point we can look for support to begin to show on the shorter time frame.
If buyers are responding to falling prices, wicks will show-up on the under-side of the shorter-term candles as demand begins to out-strip supply. And as buyers begin to take-over, prices will begin to edge higher on that shorter-term chart as sellers succumb to even greater demand. And it’s as this is taking place that traders want to investigate the top-side entry, because the point of support that was just established, as highlighted by those under-side wicks, is where the trader can look to place their stop. For a more in-depth explanation behind using price action to plot supply and demand, please check out our article, Using Support and Resistance to Trade Supply and Demand.

Chart prepared by James Stanley
Setting Risk and Bailing When Proper
After the trade has been identified, traders are going to want to add a stop as they trigger or shortly after they open the position. That way, if matters reverse, the trader has some element of down-side protection. But key here is one of expectations: Price action is rarely perfect, and perhaps more to the point, price action swings are blatantly obvious and most market makers can visibly see where prices had previously reversed. Most market makers also know these points are often used for stop or limit placement, so these price action swings can be like a red beacon for ‘free liquidity’ for market makers executing on sitting orders.
So, rather than placing the stop at the exact low (for up-trends), look to ‘nest’ the stop a bit-lower so that your exit isn’t at a blatantly obvious point in the market. If there’s any element of support or resistance confluent nearby, incorporate that as well.
So, for instance, if USD/JPY just put in a swing-low at 112.03, you probably don’t want your stop right at 112.03; but rather below the ‘psychological level’ of 112.00. So, giving the entry an extra 10 pips of ‘wiggle room’ can afford you a bit of distance should that prior swing, or the psychological level at 112.00 face a retest.
If the stop does look like it would be hit, traders should avoid giving it even more room in the hope that they can stay in the trade. This is considered ‘throwing good money after bad’ because, at that point, your idea is almost proven incorrect and, given that you’re already in the trade and somewhat invested, it can be difficult to temper one’s own bias whilst in a trade that’s already eating your equity.
One ‘bad’ trade can wipe away the gains from numerous winners, and throwing good money after bad is one of the common ways that trader’s sink into this pitfall. So, set your risk at the outset of the trade, and place stops at a level that you’ll be able to walk away from the trade without any remorse. And if the stop gets hit, simply look for a new trend elsewhere.
— Written by James Stanley, Strategist for DailyFX.com
To receive James Stanley’s analysis directly via email, please SIGN UP HERE
Contact and follow James on Twitter: @JStanleyFX
How to Use Price Action to Trade New Trends How to Use Price Action to Trade New Trends https://rss.dailyfx.com/feeds/all $inline_image
0 notes
Text
Bitcoin Technical Analysis: BTC Bears May Be About To Strike (May 2020)
VIDEO TRANSCRIPT
The price of Bitcoin, once again, Shortbus, nine thousand today. And they’ve got a lot of people thinking, what, this is going to be the beginning of a new uptrend or not or what Bitcoin was up to now at this point. It is very clear, and I think it is important for all of us to realize that this is the end of it. This is just going to be now a sideways movement for a while. I’m not discounting the possibility of a retest of nine thousand five hundred. It went something like nine thousand six hundred or seven hundred. It could still happen short term. It is possible because Bitcoin is going to be trading within this tight range for now. And that, I think, is going to last for at least a couple of weeks before we see that big move to the downside. Now, here’s the thing. This is the nine that I sketched before on this chart. I did this yesterday and as you can see here, it has declined down to this important support here. And this has to hold for Bitcoin to remain in this sideways region if it declines here. I think it would be difficult for Bitcoin to just climb back above it and then it would start trading sideways here in this region. So ultimately, what we want to see here on the daily timeframe is for Bitcoin to find some sort of, you know, short term support above this 200 moving average. So what is it? I mean, it has happened before and what it has done before, it could do it again. It kept on doing this again at this point, and it kept on trading sideways for a long while above this 200 moving average before it crashed. So the same thing could happen again. We could see trade sideways here for quite a while before it crashes. No, I’m saying this is possible. We could also see a decline below this twin and moving very straight away in one or two sharp Qantas. That is also possible. But at this point, what makes a lot of sense is for Bitcoin to trade sideways, to trap in more traders who are thinking that having run-up to the moon is still possible. And this would give them the reason to go along with the market. They are going to be thinking that Bitcoin is still in a position where it could be safe. Let me talk about the bears. A lot of bears were shaken out by this move, and many of them are too scared to get back into the market because there’s Chop’s who are run and they were shaken out. And I noticed there a lot of people who were getting very bearish on the market just saw seven thousand seven hundred. And these loans are of people who were getting very bearish because they were expecting a sharp decline from there. But that did not happen. Instead, we had this pump to the upside and now it has a broken bias. This tool in moving coverage, as well as shaken out a lot of stops here. So for this reason out of people, I was scared to be short on the market. And I think for them, the best thing to do would be for wait for a decline below this trend line support before it happens. There is no reason to be bearish on the market, only bearish in the market because this could easily see another week to the upside or some sort of movement before it declines. I mean, I keep saying that this would be sideways, but this kind of a week to the upside is still possible. It happened before and it could still happen again. So we could see a sideways movement here for a while. So let it be let the true decide this for a while. And then when it declines here, I mean, there is no need to be greedy here thinking that you are going to be making this extra few percent of gains and you be risking all of this for another potential upside here, which would shake you out again. So this is not a good time to be doing that. This is a time to wait for this to play out. And soon as we have a break, a clear break below this trend line support as we have previously seen here. Then there is a point where you would want to be bearish on the market. Let’s talk about it from here on the one-hour time frame, we can see that it has declined below this 50 moving average, but we still need to see further continuation here. We need to see it decline. And more importantly, we need to see this trend line break. The district line has not broken and we need to see this break before we decide that this is likely to be the local top. And it is going to take. But short term, I would not be surprised if it rates further to test this top again before it declines. But at the same time, I’m not going to be looking for bullish entries on the team at this point because this is too risky. This could easily retrace very sharply from here. And this is not a time to belong on the cryptocurrency market. This is not the time to be longer. And the stock market as well, because most of these things happen together. So the stock market is also at a point where we can expect a sharp decline because you can see that stock futures have started in the red for today and they have already declined much more aggressively from the sixty-one point eight percent retracement level. So we could definitely see further downside in the stock market. Now, just as I said about the cryptocurrency market, we could also see some sort of up and down movement short term. It could just do days. It could go up, down, up, down for a while before it kind of decides who breaks it down as it happens. But this is going to be the zone. This is going to be the resistance zone that I think the price is unlikely to break, boss. And it is going to keep on trading him here for a while before we see that decisive break to the downside. As I mentioned, in the case of Bitcoin, this decline is also going to be much more aggressive compared to what happened here. So by a September or October of 2020, I definitely expect a sharp decline in the stock market and the cryptocurrency market for cryptocurrency. I think Bitcoin is going to be trading below three thousand dollars by October of 2020. But for the stock market, it is also going to be brutal. But for Bitcoin, I don’t think two thousand five hundred or something like that is going to the bottom. I still believe that it is going to bottom at 1000 dollars or slightly lower. I don’t think Bitcoin is going to bottom at two thousand five hundred. So this is now one of the most important changes that we could be looking at at this point. And this is the charge for Bitcoin dominance. Let’s zoom out here and let me explain what is going on here. So since twenty fourteen or, you know, is like since the previous cycle, you can see that Bitcoin dominance has declined aggressively. And there was a time where, you know, a lot of Ahlquist started to rally and we saw this Alkon boom. And a lot of any kind of Alcorn’s or rally. And it didn’t make a difference what kind of a token it was. If it was on quite market cap, it was rallying with the rest of the market. So that trend is now going to be worse because Bitcoin dominance is now at a point of a breakout. If we just look at this chart, we can see that we are so close to this breakout here. And this could take like as I mentioned before, it could be a few weeks of sideways movement. It could take like, you know, thirty-five days. Forty-two days, like in the I mean, if it takes that long, if it does do that alone, there could be these much days. But if that doesn’t happen and we see a quick break to the upside, I mean which is more likely, I mean we have already seen Bitcoin dominance break positive two 200 moving average at this point. So if it continues to trade higher from there, then that decline could happen a lot sooner than we anticipate. And that is going to be game-changing for the cryptocurrency market. This is going to be the beginning of a new uptrend in Bitcoin dominance and a downtrend in the cryptocurrency market, which is going to be far more brutal this time. And you can see why. You can see why for yourself because this time Bitcoin dominance would be rising, posta to a new move, encouraged to begin a new uptrend to enter, you know, a bullish cycle, which has not happened before. It has been trading in a parish trend for a very long time. And now this is a time where it is about to flip bullish. So if Bitcoin dominance flips bullish, that is going to be extremely bearish for the cryptocurrency market. And that is something that we need to keep into account. And that is why, if you think about it, my target of 1000 dollars per bitcoin does not seem so far fetched. If we just think about what is happening here. So let’s talk about Alkan dominance now, and we haven’t looked at this chart in a while. And as you can see here, this is now extremely bearish. This is like a very bearish setup here. You can see that this is part of a large descending triangle. And soon as it breaks below this 200 moving average on the weekly time frame, this is going to be it. It is going to be the end for eloquence. And you can see if you zoom out here, you can see that this line has not been breached since the beginning of this data that we have here for Alkan Dominant. So if we were to draw this to a moving average like this, you can see that would probably be something like this. So we have previously seen that this has not been bridged before. This hasn’t happened before, since the inception of, I think, most eloquent. So for the first time in our history, we are likely to be seeing a bear market. And that is going to be extremely devastating, I think, for a lot of Falcons. Most projects would just go belly up and there would be probably investigations and prosecutions and I mean lawsuits and all that is going to happen. And that is going to push Bitcoin easily down to 1000 dollars, if not lower than that. And for all kinds that you can just imagine, it is going to be a whole different scenario. It’s going to be something extremely devastating. So this is why I keep saying that this. I mean, before it happened, well, before it happened, I said that Bitcoin halving is going to be one of the biggest bull traps in Bitcoin history. And I still stand by that. I think Bitcoin having is going to be this time, it is going to be one of the biggest bull traps because we are going to be seeing such a major decline from here. That is going to be I mean, for for a lot of traders that enter bullish positions around 9000 or still trying to enter police positions around these towers for these people. It is going to be extremely devastating because these people would be the first to be shaken out here by these Gang of four more so it would decline down to here. A lot of people would be shaken out. And then those top holders would trigger this major decline to the downside. Now, this time, as I previously mentioned, it’s going to be a lot more aggressive, this decline. It’s going to be very brutal. And we will see this happen a lot quicker. And I would not be surprised if, by July of 2020, you will see three thousand eight hundred again and then potentially some sort of short term upside before a decline down to two thousand five hundred or something by September or October of 2020. But after that, I think we are going to see another upside, which would lead a lot of traders into thinking that this was the bottom. And then we will see the final decline down to one thousand dollars. Now, it’s not clear to me yet whether that one thousand dollars could happen this year or in the first few months of next year, but below three thousand dollars are definitely expected this year. I think Bitcoin could definitely be trading below three thousand dollars by the end of this year. So let us talk about the euro for spirit, which I think has been trading in a range for a long time and is now at a point where it could break to the downside from here. And this has now reached the top of this range here. You can see that previously when it did that, this was an average of twenty 20. This was just this month and this was on the 14th of February 2020. And as you can see here, this is now likely to begin a short term downtrend from here. And we don’t know for sure if this is going to break to the downside. That is going to be a major breakdown that we are waiting for. But there certainly seems to be the case because this was a false breakout. We just draw a line here. You can see that this was a forced breakout here. This was a fast break. Because the descending triangle is most of the time they end up doing this. And this could be now interpreted in different ways. This could now be called a symmetrical triangle because of what it did here, because of a decline below down to this level here. So it could be a short, short term fake-out. But I definitely see this declining below this line here. And to begin a sharp downturn from here. So for the eurodollar, for espere, this most likely would coincide. This decline would most likely coincide with a decline in the stock market and which has not happened so far. But when that happens, we’re going to be seeing a major decline in despair. And therefore, for this reason, I think this is a time to be extremely cautious. And this is not a time to be thinking about being long on despair or to think about being long when the stock market or the currency market. So BTC, how longs to be with you as he shorts ratio. This is not something that I’ve talked about for a long time. And now I think the reason I’m talking about this at this point is that you know, one of you commented in the video and said that I should talk about this and I decided to talk about this because I see something different this time. You can see that this was an uptrend that started in BEATTIES, who as he longs to be BTC with these shorts. And it is an uptrend, had been there for a really long time. And this was till January of 2020 when we saw a lot of bullish periods in which in between. But now this uptrend has been broken and we have entered a downtrend here. And as you can see here, this would potentially be the beginning of further downside from here in BDC as your lungs, obviously with the shorts. And this to me is going to be the time where we are going to be seeing a downtrend in despair for the first time since we have the data available here on trading with. So on the weekly time frame, you can see here that it is this is like a, you know, some sort of this like a double top here. This is one shoulder. This is another shoulder. So this could be like a head and shoulders break down from here. For all we know. But at the same time, I mean, this could trade sideways for a while before the breakdown happens. But this is now a point where I’m definitely expecting a downtrend in BTC with Zilong, stability with these shorts. Because you think about this, a lot of these charges are lining up together to paint the same picture to fit into the same budget. And you can see the Bitcoin dominance is now at a point of a breakout. It could begin a new uptrend. And condoms are now at a point of a breakdown where it could begin a new downtrend. And Bitcoin, for that same reason, risks a major decline. This time, it is going to be much more aggressive because of these very same reasons. And I think this is a time where we need to think about what could happen to a lot of these old coins. If Bitcoin were to decline down to 1000 dollars or even to two thousand five hundred there, there’s going to be extremely brutal for a lot of ARQUIT projects. So this is a time to be extremely conservative and to be thinking about what’s happening in the world and what is happening in major financial markets and how that could impact Bitcoin rather than thinking about something so insignificant as Bitcoin, having to think that they’re just going to push Bitcoin to the moon. So that’s all for today. And thank you for watching.
Via https://www.cryptosharks.net/bitcoin-technical-analysis-btc-bears-strike-may/
source https://cryptosharks.weebly.com/blog/bitcoin-technical-analysis-btc-bears-may-be-about-to-strike-may-2020
0 notes
Text
Forex Buy and Sell Signals [Simple & Profitable]
Just about everything I do in the Forex market revolves around six buy and sell signals.
Three are candlestick patterns while the other three are chart patterns such as the head and shoulders.
You probably know I like to keep things simple.
But simple doesn’t mean unreliable or unprofitable.
In fact, the simple buy and sell setups below are some of the most profitable patterns I’ve come across after more than a decade of trading.
Interested to learn more?
Let’s get started!
Candlestick Buy & Sell Signals
There are three types of candlestick patterns I look for during a trading week. They are the pin bar, engulfing bar and inside bar.
Get Instant Access to the Same “New York Close” Forex Charts Used by Justin Bennett!
While the pin bar can be traded on the 4-hour and daily time frames, both the engulfing and inside bars are most effective on the daily time frame and higher. If you use them on any time frame lower than the daily you open yourself up to false positives.
Let’s take a look at each one in greater detail.
Pin bar
For those who have followed me for a while now, it will come as no surprise to hear that my favorite candlestick pattern is the pin bar. These candles are characterized by long upper or lower wicks and represent a rejection of support or resistance.
That last sentence is paramount to the effectiveness of the pin bar pattern. Without having a key support or resistance area near the candlestick, the formation is rather meaningless.
Here’s an example of a bearish pin bar on the AUDUSD daily chart:
Notice how after closing below a key level, the pair formed a bearish pin bar after retesting the area as new resistance. A short entry on a 50% pullback would have yielded a tidy profit in less than 48 hours.
To learn more about the pin bar including how to trade it, see this post.
Engulfing bar
The engulfing bar is a reversal pattern that can often signal exhaustion from buyers or sellers. As the name implies, it’s a candle that completely engulfs the previous one.
One critical rule of using this signal is only to pay attention to the engulfing patterns that develop on the daily chart and above. Any signal on the intraday charts is unreliable in the sense that it could be a false positive.
Another important point is that the candlestick pattern must form at a swing high or low. Otherwise, it won’t signal the necessary exhaustion from bulls or bears that make it an effective reversal signal.
Below is an example of an engulfing candle on the AUDUSD daily chart.
Note that the candle formed at a swing high and at a resistance level that had been in place for several months.
See the two links below to learn more.
Bullish engulfing bar
Bearish engulfing bar
Inside bar
When I began trading with price action in 2010, I started with the pin bar and inside bar candlestick patterns. I figured I would learn the two signals inside and out before considering other more advanced patterns.
It was a good move. I always advocate sticking with one or two price patterns in the beginning before expanding your options. The fewer things you have to learn the easier it is to become proficient by honing in on the subject at hand.
But over the years I’ve moved away from trading the inside bar, at least to some degree. I still find one here and there that catches my attention, but for the most part, I don’t trade it.
That doesn’t mean it isn’t a profitable signal. It just means that it doesn’t suit my style as much as the other signals in this post.
With that said, for someone searching for a good trend trading signal, the inside bar is one of the best in my opinion. The key, however, is to make sure you stick to the daily time frame. Anything lower than that and you’ll end up with too many false positives.
Below are three bullish inside bars that formed on the USDJPY daily chart during an aggressive rally.
The key here is to find a pair that is trending. You should also pay close attention to the location of support and resistance before deciding to execute a trade.
See this post on the inside bar trading strategy to learn more.
Chart Pattern Buy & Sell Signals
Now that we’ve looked at the three candlestick patterns I use, let’s dive into the three chart patterns. These include the head and shoulders, channels and wedges.
As the name implies, these are patterns that form over an extended period on a chart and involve multiple candlesticks. In fact, most of the technical structures I utilize take weeks, months or even years to materialize.
The good news is that we don’t have to wait months or years to trade. With dozens of currency pairs at our disposal, there’s almost always something to do.
Head and shoulders (and inverse)
When it comes to profitability, the head and shoulders pattern is at the top of the list. It typically forms after an extended move up and signals exhaustion from buyers.
The inverse head and shoulders pattern also represents a potential reversal but does so after an extended move down and signals exhaustion from sellers.
The reason I say these formations can be highly profitable is that they often provide several hundred pips of profit if traded successfully.
Here’s a head and shoulders pattern that formed on the NZDJPY weekly chart over several months. This was a formation that I traded and also commented on several times on this site as things unfolded.
In the case of this NZDJPY reversal, the selloff totaled more than 1,200 pips.
Note that the head and shoulders also comes with what’s called a measured objective. This is a potential profit target that’s found using the height of the structure.
Learn everything there is to know about the head and shoulders pattern in this detailed guide.
You can learn more about how to use measured objectives in this post.
Channels (ascending and descending)
Channels occur more often than most traders probably realize. They are particularly plentiful after an impulsive move up or down. The channels that form in this manner are known as bull and bear flags.
If you’ve followed me for a while, you’ve no doubt seen me comment on either an ascending or descending channel. In fact, I bet not a single week goes by where I don’t use a channel to outline the price action on a given chart.
They offer an excellent way to identify and outline periods of consolidation which can provide an opportunity to play the subsequent breakout.
Here’s a recent example of an ascending channel on the NZDUSD daily chart:
Notice how the ascending channel above began forming after an extended move lower. As such, we could also call this a bear flag, which most often represents a continuation of the prevailing trend.
Check out the detailed guide on how to trade equidistant channels for more information.
While usually the result of consolidation, channels can sometimes outline a broader trend or cycle. Such is the case with the ascending channel on the NZDJPY monthly chart below.
Instead of using the channel above to catch a breakout (which would take decades), I would use a formation like this to form a longer-term outlook for the pair.
See this post for more details on how I utilize multi-year channels such as the one above.
Wedges (narrowing and broadening)
Like channels, wedges usually represent consolidation. However, what sets them apart is their terminal nature. In other words, a narrowing wedge has a definitive end point whereas a channel does not.
The two charts below show the difference between a narrowing wedge and a broadening wedge.
First up is a narrowing wedge on the GBPJPY 4-hour chart.
As the name implies, a narrowing wedge occurs when price action gets “squeezed” by support and resistance. Because the pair has no choice but to eventually break out, we call this a terminal pattern.
Visit the post on how to trade rising and falling wedge patterns for more.
Now, here’s an example of a broadening wedge on the GBPJPY 4-hour chart:
Notice how unlike the narrowing wedge in the first chart, the price action in a broadening formation “fans out” as time passes. The broadening wedge is not considered a terminal pattern because the pair could theoretically never break support or resistance.
Of course, reality says that the formation will eventually break down as was the case in the chart above.
Want to know more about the broadening wedge? Check out this post.
Final Words
If you’re new to price action or just looking to add an extra signal or two to your already established arsenal, the list above is a great place to start. Each one is simple yet highly profitable if you follow the lessons on this site (see links throughout this post).
My advice is to pick one or two signals, learn the characteristics, entry and exit methods, etc. before moving on. Trying to learn all six at the same time would make things harder than they have to be in my opinion.
Also, the more material you try to digest at one time, the longer it will take to become proficient. By selecting just one or two patterns, you’ll be able to master them in much less time than if you took on all six at the same time.
Last but certainly not least, stick to the 4-hour and daily time frames, take notes and just keep piling on the experience. Before you know it, you’ll be seeing pin bars and channels without even thinking.
Frequently Asked Questions
How do you know when to buy or sell in Forex?
If you’re a price action trader like me, you can use various candlestick and chart signals like those in this post. Something as simple as a pin bar candlestick or a channel breakout can be incredibly profitable if traded correctly.
What are the best Forex buy signals?
I prefer to keep things simple. Candlestick patterns such as the pin bar, engulfing bar, and inside bar are my go-to signals. As for chart patterns, I prefer the head and shoulders, channels, and wedges.
What are the best Forex sell signals
I prefer to keep things simple. Candlestick patterns such as the pin bar, engulfing bar, and inside bar are my go-to signals. As for chart patterns, I prefer the head and shoulders, channels, and wedges.
Your Turn: Ask Justin Anything
I’d love for this new weekly Q&A to be successful and provide an invaluable repository of answers to common Forex questions.
To do that, I need your help.
Here’s what you can do to get involved and have your question answered in next week’s post:
Ask questions. Post them in the comments below or Tweet them to me @JustinBennettFX
Help me answer questions. If I missed something or if you have something to add, don’t hesitate to leave a comment below.
The post Forex Buy and Sell Signals [Simple & Profitable] appeared first on Forex Trader Post.
from WordPress https://ift.tt/30cwSvJ via IFTTT
0 notes
Text
Bitcoin Technical Analysis: BTC Bears May Be About To Strike (May 2020)
VIDEO TRANSCRIPT
The price of Bitcoin, once again, Shortbus, nine thousand today. And they’ve got a lot of people thinking, what, this is going to be the beginning of a new uptrend or not or what Bitcoin was up to now at this point. It is very clear, and I think it is important for all of us to realize that this is the end of it. This is just going to be now a sideways movement for a while. I’m not discounting the possibility of a retest of nine thousand five hundred. It went something like nine thousand six hundred or seven hundred. It could still happen short term. It is possible because Bitcoin is going to be trading within this tight range for now. And that, I think, is going to last for at least a couple of weeks before we see that big move to the downside. Now, here’s the thing. This is the nine that I sketched before on this chart. I did this yesterday and as you can see here, it has declined down to this important support here. And this has to hold for Bitcoin to remain in this sideways region if it declines here. I think it would be difficult for Bitcoin to just climb back above it and then it would start trading sideways here in this region. So ultimately, what we want to see here on the daily timeframe is for Bitcoin to find some sort of, you know, short term support above this 200 moving average. So what is it? I mean, it has happened before and what it has done before, it could do it again. It kept on doing this again at this point, and it kept on trading sideways for a long while above this 200 moving average before it crashed. So the same thing could happen again. We could see trade sideways here for quite a while before it crashes. No, I’m saying this is possible. We could also see a decline below this twin and moving very straight away in one or two sharp Qantas. That is also possible. But at this point, what makes a lot of sense is for Bitcoin to trade sideways, to trap in more traders who are thinking that having run-up to the moon is still possible. And this would give them the reason to go along with the market. They are going to be thinking that Bitcoin is still in a position where it could be safe. Let me talk about the bears. A lot of bears were shaken out by this move, and many of them are too scared to get back into the market because there’s Chop’s who are run and they were shaken out. And I noticed there a lot of people who were getting very bearish on the market just saw seven thousand seven hundred. And these loans are of people who were getting very bearish because they were expecting a sharp decline from there. But that did not happen. Instead, we had this pump to the upside and now it has a broken bias. This tool in moving coverage, as well as shaken out a lot of stops here. So for this reason out of people, I was scared to be short on the market. And I think for them, the best thing to do would be for wait for a decline below this trend line support before it happens. There is no reason to be bearish on the market, only bearish in the market because this could easily see another week to the upside or some sort of movement before it declines. I mean, I keep saying that this would be sideways, but this kind of a week to the upside is still possible. It happened before and it could still happen again. So we could see a sideways movement here for a while. So let it be let the true decide this for a while. And then when it declines here, I mean, there is no need to be greedy here thinking that you are going to be making this extra few percent of gains and you be risking all of this for another potential upside here, which would shake you out again. So this is not a good time to be doing that. This is a time to wait for this to play out. And soon as we have a break, a clear break below this trend line support as we have previously seen here. Then there is a point where you would want to be bearish on the market. Let’s talk about it from here on the one-hour time frame, we can see that it has declined below this 50 moving average, but we still need to see further continuation here. We need to see it decline. And more importantly, we need to see this trend line break. The district line has not broken and we need to see this break before we decide that this is likely to be the local top. And it is going to take. But short term, I would not be surprised if it rates further to test this top again before it declines. But at the same time, I’m not going to be looking for bullish entries on the team at this point because this is too risky. This could easily retrace very sharply from here. And this is not a time to belong on the cryptocurrency market. This is not the time to be longer. And the stock market as well, because most of these things happen together. So the stock market is also at a point where we can expect a sharp decline because you can see that stock futures have started in the red for today and they have already declined much more aggressively from the sixty-one point eight percent retracement level. So we could definitely see further downside in the stock market. Now, just as I said about the cryptocurrency market, we could also see some sort of up and down movement short term. It could just do days. It could go up, down, up, down for a while before it kind of decides who breaks it down as it happens. But this is going to be the zone. This is going to be the resistance zone that I think the price is unlikely to break, boss. And it is going to keep on trading him here for a while before we see that decisive break to the downside. As I mentioned, in the case of Bitcoin, this decline is also going to be much more aggressive compared to what happened here. So by a September or October of 2020, I definitely expect a sharp decline in the stock market and the cryptocurrency market for cryptocurrency. I think Bitcoin is going to be trading below three thousand dollars by October of 2020. But for the stock market, it is also going to be brutal. But for Bitcoin, I don’t think two thousand five hundred or something like that is going to the bottom. I still believe that it is going to bottom at 1000 dollars or slightly lower. I don’t think Bitcoin is going to bottom at two thousand five hundred. So this is now one of the most important changes that we could be looking at at this point. And this is the charge for Bitcoin dominance. Let’s zoom out here and let me explain what is going on here. So since twenty fourteen or, you know, is like since the previous cycle, you can see that Bitcoin dominance has declined aggressively. And there was a time where, you know, a lot of Ahlquist started to rally and we saw this Alkon boom. And a lot of any kind of Alcorn’s or rally. And it didn’t make a difference what kind of a token it was. If it was on quite market cap, it was rallying with the rest of the market. So that trend is now going to be worse because Bitcoin dominance is now at a point of a breakout. If we just look at this chart, we can see that we are so close to this breakout here. And this could take like as I mentioned before, it could be a few weeks of sideways movement. It could take like, you know, thirty-five days. Forty-two days, like in the I mean, if it takes that long, if it does do that alone, there could be these much days. But if that doesn’t happen and we see a quick break to the upside, I mean which is more likely, I mean we have already seen Bitcoin dominance break positive two 200 moving average at this point. So if it continues to trade higher from there, then that decline could happen a lot sooner than we anticipate. And that is going to be game-changing for the cryptocurrency market. This is going to be the beginning of a new uptrend in Bitcoin dominance and a downtrend in the cryptocurrency market, which is going to be far more brutal this time. And you can see why. You can see why for yourself because this time Bitcoin dominance would be rising, posta to a new move, encouraged to begin a new uptrend to enter, you know, a bullish cycle, which has not happened before. It has been trading in a parish trend for a very long time. And now this is a time where it is about to flip bullish. So if Bitcoin dominance flips bullish, that is going to be extremely bearish for the cryptocurrency market. And that is something that we need to keep into account. And that is why, if you think about it, my target of 1000 dollars per bitcoin does not seem so far fetched. If we just think about what is happening here. So let’s talk about Alkan dominance now, and we haven’t looked at this chart in a while. And as you can see here, this is now extremely bearish. This is like a very bearish setup here. You can see that this is part of a large descending triangle. And soon as it breaks below this 200 moving average on the weekly time frame, this is going to be it. It is going to be the end for eloquence. And you can see if you zoom out here, you can see that this line has not been breached since the beginning of this data that we have here for Alkan Dominant. So if we were to draw this to a moving average like this, you can see that would probably be something like this. So we have previously seen that this has not been bridged before. This hasn’t happened before, since the inception of, I think, most eloquent. So for the first time in our history, we are likely to be seeing a bear market. And that is going to be extremely devastating, I think, for a lot of Falcons. Most projects would just go belly up and there would be probably investigations and prosecutions and I mean lawsuits and all that is going to happen. And that is going to push Bitcoin easily down to 1000 dollars, if not lower than that. And for all kinds that you can just imagine, it is going to be a whole different scenario. It’s going to be something extremely devastating. So this is why I keep saying that this. I mean, before it happened, well, before it happened, I said that Bitcoin halving is going to be one of the biggest bull traps in Bitcoin history. And I still stand by that. I think Bitcoin having is going to be this time, it is going to be one of the biggest bull traps because we are going to be seeing such a major decline from here. That is going to be I mean, for for a lot of traders that enter bullish positions around 9000 or still trying to enter police positions around these towers for these people. It is going to be extremely devastating because these people would be the first to be shaken out here by these Gang of four more so it would decline down to here. A lot of people would be shaken out. And then those top holders would trigger this major decline to the downside. Now, this time, as I previously mentioned, it’s going to be a lot more aggressive, this decline. It’s going to be very brutal. And we will see this happen a lot quicker. And I would not be surprised if, by July of 2020, you will see three thousand eight hundred again and then potentially some sort of short term upside before a decline down to two thousand five hundred or something by September or October of 2020. But after that, I think we are going to see another upside, which would lead a lot of traders into thinking that this was the bottom. And then we will see the final decline down to one thousand dollars. Now, it’s not clear to me yet whether that one thousand dollars could happen this year or in the first few months of next year, but below three thousand dollars are definitely expected this year. I think Bitcoin could definitely be trading below three thousand dollars by the end of this year. So let us talk about the euro for spirit, which I think has been trading in a range for a long time and is now at a point where it could break to the downside from here. And this has now reached the top of this range here. You can see that previously when it did that, this was an average of twenty 20. This was just this month and this was on the 14th of February 2020. And as you can see here, this is now likely to begin a short term downtrend from here. And we don’t know for sure if this is going to break to the downside. That is going to be a major breakdown that we are waiting for. But there certainly seems to be the case because this was a false breakout. We just draw a line here. You can see that this was a forced breakout here. This was a fast break. Because the descending triangle is most of the time they end up doing this. And this could be now interpreted in different ways. This could now be called a symmetrical triangle because of what it did here, because of a decline below down to this level here. So it could be a short, short term fake-out. But I definitely see this declining below this line here. And to begin a sharp downturn from here. So for the eurodollar, for espere, this most likely would coincide. This decline would most likely coincide with a decline in the stock market and which has not happened so far. But when that happens, we’re going to be seeing a major decline in despair. And therefore, for this reason, I think this is a time to be extremely cautious. And this is not a time to be thinking about being long on despair or to think about being long when the stock market or the currency market. So BTC, how longs to be with you as he shorts ratio. This is not something that I’ve talked about for a long time. And now I think the reason I’m talking about this at this point is that you know, one of you commented in the video and said that I should talk about this and I decided to talk about this because I see something different this time. You can see that this was an uptrend that started in BEATTIES, who as he longs to be BTC with these shorts. And it is an uptrend, had been there for a really long time. And this was till January of 2020 when we saw a lot of bullish periods in which in between. But now this uptrend has been broken and we have entered a downtrend here. And as you can see here, this would potentially be the beginning of further downside from here in BDC as your lungs, obviously with the shorts. And this to me is going to be the time where we are going to be seeing a downtrend in despair for the first time since we have the data available here on trading with. So on the weekly time frame, you can see here that it is this is like a, you know, some sort of this like a double top here. This is one shoulder. This is another shoulder. So this could be like a head and shoulders break down from here. For all we know. But at the same time, I mean, this could trade sideways for a while before the breakdown happens. But this is now a point where I’m definitely expecting a downtrend in BTC with Zilong, stability with these shorts. Because you think about this, a lot of these charges are lining up together to paint the same picture to fit into the same budget. And you can see the Bitcoin dominance is now at a point of a breakout. It could begin a new uptrend. And condoms are now at a point of a breakdown where it could begin a new downtrend. And Bitcoin, for that same reason, risks a major decline. This time, it is going to be much more aggressive because of these very same reasons. And I think this is a time where we need to think about what could happen to a lot of these old coins. If Bitcoin were to decline down to 1000 dollars or even to two thousand five hundred there, there’s going to be extremely brutal for a lot of ARQUIT projects. So this is a time to be extremely conservative and to be thinking about what’s happening in the world and what is happening in major financial markets and how that could impact Bitcoin rather than thinking about something so insignificant as Bitcoin, having to think that they’re just going to push Bitcoin to the moon. So that’s all for today. And thank you for watching.
source https://www.cryptosharks.net/bitcoin-technical-analysis-btc-bears-strike-may/ source https://cryptosharks1.blogspot.com/2020/05/bitcoin-technical-analysis-btc-bears.html
0 notes
Text
XRP Rally Risks Retracement, Faces Pivotal Battle With Bitcoin
After years of underperformance compared to the rest of the crypto market, XRP has been pumping from bear market lows. But just as the altcoin reaches a key level on its Bitcoin trading pair, an ominous sell signal has triggered.
Will the recent rally in Ripple fully retrace as pumps have in the past? Or will the cryptocurrency finally recover in its ongoing battle against BTC?
David Versus Goliath, Ripple Versus Bitcoin
XRP has been in a brutal downtrend on the BTC trading pair and remains over 90% down from its peak.
Making any sort of recovery against Bitcoin has proven unsuccessful for XRP over the last three years. It’s cemented the altcoin’s status as the worst performer in the crypto market.
It was even “flippened” by Tether for the third spot in the top ten crypto assets by market cap.
Over the last few weeks, however, XRP may have finally found its bottom. Multiple signals potentially confirm a breakout from nearly three years of downtrend resistance and bullish momentum is building.
Related Reading | The Price Trend of XRP Stunningly Reflects That of Sheep Manure Stock
This week alone the now fourth-ranked cryptocurrency is up over 12% against USD. At the high, the asset was up 20% on the dollar-based pair.
The native token to the Ripple protocol also gained 10% against Bitcoin during this time. The gain represents the largest outperformance against BTC since before Black Thursday.
But the rally could be over or at least see a strong retracement due to a “9” sell setup on the TD Sequential indicator.

Ripple XRPBTC TD Sequential Daily | Source: TradingView
Conflicting Signals Leave XRP Rally Against BTC In Jeopardy
XRP can’t seem to catch a break against Bitcoin. Just as the asset stages its best chance at a sustained recovery in months, the TD Sequential indicator issues a 9 sell setup.
The last time the signal triggered, the altcoin dropped 35% against BTC.
As of the time of this writing, the sell setup hasn’t yet perfected. Doing so would require a new higher high set today beyond Thursday’s high of 2250 sats.
There are also conflicting signals on the indicator. On the quarterly XRPBTC chart, there’s also a 9 buy setup.

Ripple XRPBTC TD Sequential 3-Month | Source: TradingView
Higher timeframes are given more weight in terms of signals. A buy signal across 27 months of price action versus just 9 days, is bound to be more significant.
Related Reading | Ready For Liftoff: Two-Year Downtrend Breakout Could Lead to $14 Ripple
There are also several other potential signs that XRP has bottomed and even the latest 9 sell setup won’t stop the asset’s explosive momentum.

Ripple XRPBTC Weekly | Source: TradingView
During 2017 there were two distinct pumps against BTC. Each time, Ripple rocketed by over 1000% in less than two months.
If the cryptocurrency is ready for another similar surge, this latest sell setup could be a fakeout or a false signal. Or perhaps any resulting downside is extremely short-lived.
from CryptoCracken SMFeed https://ift.tt/2OiDa6u via IFTTT
0 notes
Text
XRP Rally Risks Strong Retracement in Pivotal Battle With Bitcoin
After years of underperformance compared to the rest of the crypto market, XRP has been pumping from bear market lows. But just as the altcoin reaches a key level on its Bitcoin trading pair, an ominous sell signal has triggered.
Will the recent rally in Ripple fully retrace as pumps have in the past? Or will the cryptocurrency finally recover in its ongoing battle against BTC?
David Versus Goliath, Ripple Versus Bitcoin
XRP has been in a brutal downtrend on the BTC trading pair and remains over 90% down from its peak.
Making any sort of recovery against Bitcoin has proven unsuccessful for XRP over the last three years. It’s cemented the altcoin’s status as the worst performer in the crypto market.
It was even “flippened” by Tether for the third spot in the top ten crypto assets by market cap.
Over the last few weeks, however, XRP may have finally found its bottom. Multiple signals potentially confirm a breakout from nearly three years of downtrend resistance and bullish momentum is building.
Related Reading | The Price Trend of XRP Stunningly Reflects That of Sheep Manure Stock
This week alone the now fourth-ranked cryptocurrency is up over 12% against USD. At the high, the asset was up 20% on the dollar-based pair.
The native token to the Ripple protocol also gained 10% against Bitcoin during this time. The gain represents the largest outperformance against BTC since before Black Thursday.
But the rally could be over or at least see a strong retracement due to a “9” sell setup on the TD Sequential indicator.

Ripple XRPBTC TD Sequential Daily | Source: TradingView
Conflicting Signals Leave XRP Rally Against BTC In Jeopardy
XRP can’t seem to catch a break against Bitcoin. Just as the asset stages its best chance at a sustained recovery in months, the TD Sequential indicator issues a 9 sell setup.
The last time the signal triggered, the altcoin dropped 35% against BTC.
As of the time of this writing, the sell setup hasn’t yet perfected. Doing so would require a new higher high set today beyond Thursday’s high of 2250 sats.
There are also conflicting signals on the indicator. On the quarterly XRPBTC chart, there’s also a 9 buy setup.

Ripple XRPBTC TD Sequential 3-Month | Source: TradingView
Higher timeframes are given more weight in terms of signals. A buy signal across 27 months of price action versus just 9 days, is bound to be more significant.
Related Reading | Ready For Liftoff: Two-Year Downtrend Breakout Could Lead to $14 Ripple
There are also several other potential signs that XRP has bottomed and even the latest 9 sell setup won’t stop the asset’s explosive momentum.

Ripple XRPBTC Weekly | Source: TradingView
During 2017 there were two distinct pumps against BTC. Each time, Ripple rocketed by over 1000% in less than two months.
If the cryptocurrency is ready for another similar surge, this latest sell setup could be a fakeout or a false signal. Or perhaps any resulting downside is extremely short-lived.
from Cryptocracken WP https://ift.tt/2OiDa6u via IFTTT
0 notes
Text
Bitcoin Technical Analysis: BTC Bears May Be About To Strike (May 2020)
VIDEO TRANSCRIPT
The price of Bitcoin, once again, Shortbus, nine thousand today. And they’ve got a lot of people thinking, what, this is going to be the beginning of a new uptrend or not or what Bitcoin was up to now at this point. It is very clear, and I think it is important for all of us to realize that this is the end of it. This is just going to be now a sideways movement for a while. I’m not discounting the possibility of a retest of nine thousand five hundred. It went something like nine thousand six hundred or seven hundred. It could still happen short term. It is possible because Bitcoin is going to be trading within this tight range for now. And that, I think, is going to last for at least a couple of weeks before we see that big move to the downside. Now, here’s the thing. This is the nine that I sketched before on this chart. I did this yesterday and as you can see here, it has declined down to this important support here. And this has to hold for Bitcoin to remain in this sideways region if it declines here. I think it would be difficult for Bitcoin to just climb back above it and then it would start trading sideways here in this region. So ultimately, what we want to see here on the daily timeframe is for Bitcoin to find some sort of, you know, short term support above this 200 moving average. So what is it? I mean, it has happened before and what it has done before, it could do it again. It kept on doing this again at this point, and it kept on trading sideways for a long while above this 200 moving average before it crashed. So the same thing could happen again. We could see trade sideways here for quite a while before it crashes. No, I’m saying this is possible. We could also see a decline below this twin and moving very straight away in one or two sharp Qantas. That is also possible. But at this point, what makes a lot of sense is for Bitcoin to trade sideways, to trap in more traders who are thinking that having run-up to the moon is still possible. And this would give them the reason to go along with the market. They are going to be thinking that Bitcoin is still in a position where it could be safe. Let me talk about the bears. A lot of bears were shaken out by this move, and many of them are too scared to get back into the market because there’s Chop’s who are run and they were shaken out. And I noticed there a lot of people who were getting very bearish on the market just saw seven thousand seven hundred. And these loans are of people who were getting very bearish because they were expecting a sharp decline from there. But that did not happen. Instead, we had this pump to the upside and now it has a broken bias. This tool in moving coverage, as well as shaken out a lot of stops here. So for this reason out of people, I was scared to be short on the market. And I think for them, the best thing to do would be for wait for a decline below this trend line support before it happens. There is no reason to be bearish on the market, only bearish in the market because this could easily see another week to the upside or some sort of movement before it declines. I mean, I keep saying that this would be sideways, but this kind of a week to the upside is still possible. It happened before and it could still happen again. So we could see a sideways movement here for a while. So let it be let the true decide this for a while. And then when it declines here, I mean, there is no need to be greedy here thinking that you are going to be making this extra few percent of gains and you be risking all of this for another potential upside here, which would shake you out again. So this is not a good time to be doing that. This is a time to wait for this to play out. And soon as we have a break, a clear break below this trend line support as we have previously seen here. Then there is a point where you would want to be bearish on the market. Let’s talk about it from here on the one-hour time frame, we can see that it has declined below this 50 moving average, but we still need to see further continuation here. We need to see it decline. And more importantly, we need to see this trend line break. The district line has not broken and we need to see this break before we decide that this is likely to be the local top. And it is going to take. But short term, I would not be surprised if it rates further to test this top again before it declines. But at the same time, I’m not going to be looking for bullish entries on the team at this point because this is too risky. This could easily retrace very sharply from here. And this is not a time to belong on the cryptocurrency market. This is not the time to be longer. And the stock market as well, because most of these things happen together. So the stock market is also at a point where we can expect a sharp decline because you can see that stock futures have started in the red for today and they have already declined much more aggressively from the sixty-one point eight percent retracement level. So we could definitely see further downside in the stock market. Now, just as I said about the cryptocurrency market, we could also see some sort of up and down movement short term. It could just do days. It could go up, down, up, down for a while before it kind of decides who breaks it down as it happens. But this is going to be the zone. This is going to be the resistance zone that I think the price is unlikely to break, boss. And it is going to keep on trading him here for a while before we see that decisive break to the downside. As I mentioned, in the case of Bitcoin, this decline is also going to be much more aggressive compared to what happened here. So by a September or October of 2020, I definitely expect a sharp decline in the stock market and the cryptocurrency market for cryptocurrency. I think Bitcoin is going to be trading below three thousand dollars by October of 2020. But for the stock market, it is also going to be brutal. But for Bitcoin, I don’t think two thousand five hundred or something like that is going to the bottom. I still believe that it is going to bottom at 1000 dollars or slightly lower. I don’t think Bitcoin is going to bottom at two thousand five hundred. So this is now one of the most important changes that we could be looking at at this point. And this is the charge for Bitcoin dominance. Let’s zoom out here and let me explain what is going on here. So since twenty fourteen or, you know, is like since the previous cycle, you can see that Bitcoin dominance has declined aggressively. And there was a time where, you know, a lot of Ahlquist started to rally and we saw this Alkon boom. And a lot of any kind of Alcorn’s or rally. And it didn’t make a difference what kind of a token it was. If it was on quite market cap, it was rallying with the rest of the market. So that trend is now going to be worse because Bitcoin dominance is now at a point of a breakout. If we just look at this chart, we can see that we are so close to this breakout here. And this could take like as I mentioned before, it could be a few weeks of sideways movement. It could take like, you know, thirty-five days. Forty-two days, like in the I mean, if it takes that long, if it does do that alone, there could be these much days. But if that doesn’t happen and we see a quick break to the upside, I mean which is more likely, I mean we have already seen Bitcoin dominance break positive two 200 moving average at this point. So if it continues to trade higher from there, then that decline could happen a lot sooner than we anticipate. And that is going to be game-changing for the cryptocurrency market. This is going to be the beginning of a new uptrend in Bitcoin dominance and a downtrend in the cryptocurrency market, which is going to be far more brutal this time. And you can see why. You can see why for yourself because this time Bitcoin dominance would be rising, posta to a new move, encouraged to begin a new uptrend to enter, you know, a bullish cycle, which has not happened before. It has been trading in a parish trend for a very long time. And now this is a time where it is about to flip bullish. So if Bitcoin dominance flips bullish, that is going to be extremely bearish for the cryptocurrency market. And that is something that we need to keep into account. And that is why, if you think about it, my target of 1000 dollars per bitcoin does not seem so far fetched. If we just think about what is happening here. So let’s talk about Alkan dominance now, and we haven’t looked at this chart in a while. And as you can see here, this is now extremely bearish. This is like a very bearish setup here. You can see that this is part of a large descending triangle. And soon as it breaks below this 200 moving average on the weekly time frame, this is going to be it. It is going to be the end for eloquence. And you can see if you zoom out here, you can see that this line has not been breached since the beginning of this data that we have here for Alkan Dominant. So if we were to draw this to a moving average like this, you can see that would probably be something like this. So we have previously seen that this has not been bridged before. This hasn’t happened before, since the inception of, I think, most eloquent. So for the first time in our history, we are likely to be seeing a bear market. And that is going to be extremely devastating, I think, for a lot of Falcons. Most projects would just go belly up and there would be probably investigations and prosecutions and I mean lawsuits and all that is going to happen. And that is going to push Bitcoin easily down to 1000 dollars, if not lower than that. And for all kinds that you can just imagine, it is going to be a whole different scenario. It’s going to be something extremely devastating. So this is why I keep saying that this. I mean, before it happened, well, before it happened, I said that Bitcoin halving is going to be one of the biggest bull traps in Bitcoin history. And I still stand by that. I think Bitcoin having is going to be this time, it is going to be one of the biggest bull traps because we are going to be seeing such a major decline from here. That is going to be I mean, for for a lot of traders that enter bullish positions around 9000 or still trying to enter police positions around these towers for these people. It is going to be extremely devastating because these people would be the first to be shaken out here by these Gang of four more so it would decline down to here. A lot of people would be shaken out. And then those top holders would trigger this major decline to the downside. Now, this time, as I previously mentioned, it’s going to be a lot more aggressive, this decline. It’s going to be very brutal. And we will see this happen a lot quicker. And I would not be surprised if, by July of 2020, you will see three thousand eight hundred again and then potentially some sort of short term upside before a decline down to two thousand five hundred or something by September or October of 2020. But after that, I think we are going to see another upside, which would lead a lot of traders into thinking that this was the bottom. And then we will see the final decline down to one thousand dollars. Now, it’s not clear to me yet whether that one thousand dollars could happen this year or in the first few months of next year, but below three thousand dollars are definitely expected this year. I think Bitcoin could definitely be trading below three thousand dollars by the end of this year. So let us talk about the euro for spirit, which I think has been trading in a range for a long time and is now at a point where it could break to the downside from here. And this has now reached the top of this range here. You can see that previously when it did that, this was an average of twenty 20. This was just this month and this was on the 14th of February 2020. And as you can see here, this is now likely to begin a short term downtrend from here. And we don’t know for sure if this is going to break to the downside. That is going to be a major breakdown that we are waiting for. But there certainly seems to be the case because this was a false breakout. We just draw a line here. You can see that this was a forced breakout here. This was a fast break. Because the descending triangle is most of the time they end up doing this. And this could be now interpreted in different ways. This could now be called a symmetrical triangle because of what it did here, because of a decline below down to this level here. So it could be a short, short term fake-out. But I definitely see this declining below this line here. And to begin a sharp downturn from here. So for the eurodollar, for espere, this most likely would coincide. This decline would most likely coincide with a decline in the stock market and which has not happened so far. But when that happens, we’re going to be seeing a major decline in despair. And therefore, for this reason, I think this is a time to be extremely cautious. And this is not a time to be thinking about being long on despair or to think about being long when the stock market or the currency market. So BTC, how longs to be with you as he shorts ratio. This is not something that I’ve talked about for a long time. And now I think the reason I’m talking about this at this point is that you know, one of you commented in the video and said that I should talk about this and I decided to talk about this because I see something different this time. You can see that this was an uptrend that started in BEATTIES, who as he longs to be BTC with these shorts. And it is an uptrend, had been there for a really long time. And this was till January of 2020 when we saw a lot of bullish periods in which in between. But now this uptrend has been broken and we have entered a downtrend here. And as you can see here, this would potentially be the beginning of further downside from here in BDC as your lungs, obviously with the shorts. And this to me is going to be the time where we are going to be seeing a downtrend in despair for the first time since we have the data available here on trading with. So on the weekly time frame, you can see here that it is this is like a, you know, some sort of this like a double top here. This is one shoulder. This is another shoulder. So this could be like a head and shoulders break down from here. For all we know. But at the same time, I mean, this could trade sideways for a while before the breakdown happens. But this is now a point where I’m definitely expecting a downtrend in BTC with Zilong, stability with these shorts. Because you think about this, a lot of these charges are lining up together to paint the same picture to fit into the same budget. And you can see the Bitcoin dominance is now at a point of a breakout. It could begin a new uptrend. And condoms are now at a point of a breakdown where it could begin a new downtrend. And Bitcoin, for that same reason, risks a major decline. This time, it is going to be much more aggressive because of these very same reasons. And I think this is a time where we need to think about what could happen to a lot of these old coins. If Bitcoin were to decline down to 1000 dollars or even to two thousand five hundred there, there’s going to be extremely brutal for a lot of ARQUIT projects. So this is a time to be extremely conservative and to be thinking about what’s happening in the world and what is happening in major financial markets and how that could impact Bitcoin rather than thinking about something so insignificant as Bitcoin, having to think that they’re just going to push Bitcoin to the moon. So that’s all for today. And thank you for watching.
source https://www.cryptosharks.net/bitcoin-technical-analysis-btc-bears-strike-may/ source https://cryptosharks1.tumblr.com/post/617083273207824384
0 notes