#Chart.js
Explore tagged Tumblr posts
Visit Tumblr Blog
Explore Tumblr blogs with no restrictions, modern design and the best experience.
Last Seen Tumblr Blogs


Fun Fact
Tumblr was the first site to host the blog for President Barack Obama in 2011.

Text
Chart.js, a JavaScript library, stands out for its robust features and numerous advantages, making data visualisation an effortless masterpiece. Designed for simplicity and power, it seamlessly balances elegance and functionality, ensuring a transformative experience.
0 notes
Text
1.11.2024
the time has come, frens.
we just presented our demo for the project we've been working on! i'm proud of my team for wrestling through the struggles yet still delivering a working web app on time.
however, i wish we had more time to develop it because the time crunch was, imo, what lead to a lot of chatgpt usage :/ one of our project's requirements was the use of a new technology we hadn't used before, and i decided on using chart.js for data visualization. i had integrated it to our html files pretty quickly, and was soooo close to figuring out how to retrieve our user's data from the database we created. unfortunately we were running a bit short on time, so *that one* groupmate literally prompted gpt to give us the entiiiiire code for it. 🥲
i lowkey died but whatever. i tried my best 🥴
unrelated but texas is boutta feel a cold front next week, so i'm prepping for no power and no water. yeehaw 🤠❄️
4 notes
·
View notes
Text
Exploring the Powerhouse: 30 Must-Know JavaScript Libraries and Frameworks for Web Development
React.js: A declarative, efficient, and flexible JavaScript library for building user interfaces.
Angular.js (Angular): A web application framework maintained by Google, used for building dynamic, single-page web applications.
Vue.js: A progressive JavaScript framework for building user interfaces. It is incrementally adaptable and can be integrated into other projects.
Node.js: A JavaScript runtime built on Chrome's V8 JavaScript engine that enables server-side JavaScript development.
Express.js: A web application framework for Node.js that simplifies the process of building web applications.
jQuery: A fast, small, and feature-rich JavaScript library that simplifies HTML document traversal and manipulation, event handling, and animation.
D3.js: A powerful library for creating data visualizations using HTML, SVG, and CSS.
Three.js: A cross-browser JavaScript library and application programming interface (API) used to create and display animated 3D computer graphics in a web browser.
Redux: A predictable state container for JavaScript apps, often used with React for managing the state of the application.
Next.js: A React framework for building server-side rendered and statically generated web applications.
Svelte: A radical new approach to building user interfaces. It shifts the work from the browser to the build step, resulting in smaller, faster applications.
Electron: A framework for building cross-platform desktop applications using web technologies such as HTML, CSS, and JavaScript.
RxJS: A library for reactive programming using Observables, making it easier to compose asynchronous or callback-based code.
Webpack: A module bundler for JavaScript applications. It takes modules with dependencies and generates static assets representing those modules.
Babel: A JavaScript compiler that allows developers to use the latest ECMAScript features by transforming them into browser-compatible JavaScript.
Jest: A JavaScript testing framework designed to ensure the correctness of your code.
Mocha: A feature-rich JavaScript test framework running on Node.js and in the browser.
Chai: A BDD/TDD assertion library for Node.js and the browser that can be paired with any testing framework.
Lodash: A modern JavaScript utility library delivering modularity, performance, and extras.
Socket.io: A library that enables real-time, bidirectional, and event-based communication between web clients and servers.
GraphQL: A query language for APIs and a runtime for executing those queries with your existing data.
Axios: A promise-based HTTP client for the browser and Node.js, making it easy to send asynchronous HTTP requests.
Jasmine: A behavior-driven development framework for testing JavaScript code.
Meteor.js: A full-stack JavaScript platform for developing modern web and mobile applications.
Gatsby.js: A modern website framework that builds performance into every website by leveraging the latest web technologies.
Chart.js: A simple yet flexible JavaScript charting library for designers and developers.
Ember.js: A JavaScript framework for building web applications, with a focus on productivity and convention over configuration.
Nuxt.js: A framework for creating Vue.js applications with server-side rendering and routing.
Grunt: A JavaScript task runner that automates common tasks in the development process.
Sass (Syntactically Awesome Stylesheets): A CSS preprocessor that helps you write maintainable, scalable, and modular styles.
Remember to check each library or framework's documentation and community support for the latest information and updates.
4 notes
·
View notes
Text
AI in the Fertilizer Industry: Revolutionizing Agriculture with Smart Technology
Artificial Intelligence (AI) is transforming industries worldwide, and the fertilizer sector is no exception. As global populations grow and arable land becomes scarcer, optimizing fertilizer use has become critical for sustainable agriculture. AI technologies are helping fertilizer companies and farmers make smarter decisions, reduce environmental impact, and increase crop yields.
How AI Benefits the Fertilizer Industry
AI brings numerous advantages to the fertilizer sector:

Key AI Applications Explained:
Precision Formulation: AI algorithms optimize nutrient combinations based on soil data and crop requirements
Smart Manufacturing: Machine learning improves production efficiency and predictive maintenance
Supply Chain Optimization: AI models forecast demand and optimize logistics
Quality Control: Computer vision systems detect product inconsistencies
Field Application: AI-powered equipment enables precision fertilization
Source: Fertilizer Industry AI Adoption Report 2023

Emerging Trends in AI for Fertilizers
The fertilizer industry is witnessing several exciting AI developments:

Key Findings:
Overall AI adoption in fertilizer industry projected to reach 78% by 2030 (up from 32% in 2023)
Precision Formulation will maintain leadership with 85% adoption expected by 2030
Field Application will be the fastest growing segment at 28% CAGR
2026 will be the tipping point with over 50% of fertilizer companies deploying AI solutions
AI-driven yield optimization could increase fertilizer efficiency by 30-40% by 2030
Hyper-localized Recommendations: AI systems combining satellite imagery, soil sensors, and weather data to provide field-specific fertilizer advice
Autonomous Application Systems: Self-driving equipment that applies precisely the right amount of fertilizer at the optimal time
Carbon Footprint Reduction: AI models helping reduce nitrogen losses and greenhouse gas emissions from fertilizer use
Biological Fertilizer Development: Machine learning accelerating the discovery of new microbial-based fertilizers
The Future of AI in Fertilizers
As AI technologies mature, we can expect even more transformative changes:
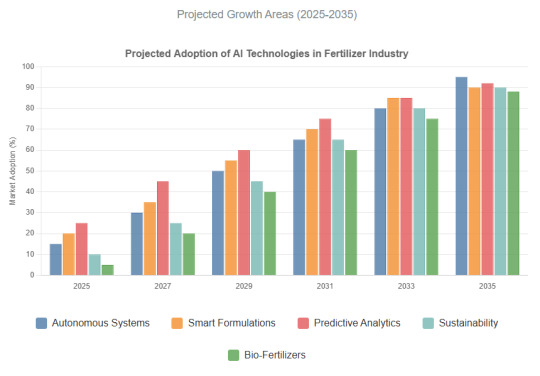
Data Source: Market Research & Industry Projections (2023) | Visualization: Chart.js
Key Emerging Trends
1. Autonomous Fertilization Systems
AI-powered robotic systems that autonomously monitor fields and apply precise amounts of fertilizer based on real-time plant needs, reducing waste by 30-40%.
2. Dynamic Nutrient Formulations
Machine learning algorithms that create customized fertilizer blends adapting to changing soil conditions and crop growth stages throughout the season.
3. Predictive Nutrient Management
Advanced analytics predicting soil nutrient depletion weeks in advance, enabling proactive fertilization strategies.
4. Emission-Reducing Solutions
AI models that optimize application methods to minimize nitrogen losses and greenhouse gas emissions by 25-35%.
5. Next-Gen Bio-Fertilizers
AI-assisted discovery of novel microbial combinations that enhance nutrient absorption while improving soil health.
Industry experts predict that by 2030, AI could help reduce global fertilizer overuse by 40%, significantly decreasing environmental pollution while maintaining food production levels. The integration of AI with other emerging technologies like blockchain for supply chain transparency and CRISPR for crop optimization will create a new era of precision agriculture.
References:
1. Smith, J. (2023). "AI Applications in Modern Agriculture". Journal of Agricultural Technology.
2. FAO Report (2022). "Digital Transformation in the Fertilizer Sector". United Nations.
3. Market Research Future (2023). "AI in Agriculture Market Forecast 2023-2030".
0 notes
Text
Interactive Guide to OEE https://cdn.tailwindcss.com https://cdn.jsdelivr.net/npm/chart.js body { font-family: ‘Inter’, sans-serif; } .chart-container { position: relative; width: 100%; max-width: 600px; margin-left: auto; margin-right: auto; height: 300px; max-height: 400px; } @media (min-width: 768px) { .chart-container { height: 350px; } } .nav-link { transition: color 0.3s, border-color…
0 notes
Text
インフォグラフィック:岐路に立つ日本の製薬業界
<!DOCTYPE html> <html lang=”ja”> <head> <meta charset=”UTF-8″> <meta name=”viewport” content=”width=device-width, initial-scale=1.0″> <title>インフォグラフィック:岐路に立つ日本の製薬業界</title> <script src=”https://cdn.tailwindcss.com”></script> <script src=”https://cdn.jsdelivr.net/npm/chart.js”></script> <link rel=”preconnect” href=”https://fonts.googleapis.com”> <link…
0 notes
Text
Services in Web Development – NextGen2AI
Empowering Digital Innovation with Intelligent Web Solutions
At NextGen2AI, we don’t just build websites—we engineer intelligent digital experiences that shape the future. Our web development services combine cutting-edge design with AI-powered functionality to help businesses grow, adapt, and thrive online.
Here’s a closer look at the wide range of web development services we offer:
1. Custom Website Development
We build responsive, scalable websites tailored to your brand and goals. Whether it's a corporate site, landing page, or portfolio, our custom designs ensure top-notch performance and user experience.
Features:
Mobile-first, responsive design
SEO-ready structure
Fast loading & optimized performance
2. AI-Integrated Web Applications
Harness the power of machine learning, natural language processing, and predictive analytics to create smart web applications that learn, adapt, and respond.
Use Cases:
Smart chatbots
Personalized content delivery
Intelligent recommendations
3. Frontend Development
Our frontend team creates sleek, interactive user interfaces using the latest technologies like React, Angular, and Vue.js.
Key Benefits:
Enhanced UX/UI
Real-time interactivity
Clean, modern design
4. Backend Development & APIs
We build powerful backend systems that ensure seamless operations, data processing, and secure integrations.
Technologies:
Node.js, Python, PHP
REST & GraphQL APIs
Secure authentication systems
5. E-Commerce Development
Boost your online business with scalable, user-friendly e-commerce solutions powered by AI for product suggestions, smart search, and personalized shopping experiences.
Platforms:
Shopify
WooCommerce
Custom-built e-commerce platforms
6. CMS Solutions
We deliver flexible, easy-to-manage websites using content management systems like WordPress, Webflow, or custom CMS tools.
Highlights:
No-code or low-code editing
Role-based content control
Blog, news, and media management
7. Data Visualization Dashboards
Our web dashboards bring data to life—helping businesses make decisions based on real-time insights through interactive graphs and AI analytics.
Tools We Use:
Chart.js, D3.js
Power BI integration
Custom dashboards with Python/JS
8. Progressive Web Apps (PWAs)
We develop web apps that work offline, load instantly, and feel like native mobile apps—perfect for improving reach and performance.
Why Choose NextGen2AI?
AI-First Approach Customized Development Scalable & Secure Systems End-to-End Support
Ready to Elevate Your Digital Presence?
Let NextGen2AI help you build future-proof web experiences. Whether you're a startup or an enterprise, our web development services will transform your ideas into intelligent, engaging platforms.
🔗 Visit us: Next Gen2AI
0 notes
Text
Explorador da Sabedoria: Vedanta e Outras Vias
Explorador da Sabedoria: Vedanta e Outras Vias https://cdn.tailwindcss.com https://cdn.jsdelivr.net/npm/chart.js Conceitos”. Cada cartão com título, breve descrição e um botão “Saiba Mais” para expandir/mostrar detalhes completos do relatório. Interaction: Clique para expandir/recolher. Justification: Apresentação concisa com opção de aprofundamento, evitando sobrecarga de informação.…
0 notes
Text
Supercharge your Odoo18 Dashboard OWL skills! Master reactive sales dashboards with OWL, Chart.js, and ORM data. Step-by-step guide includes templates, JS component, and CSS. #Odoo #OWL #Dashboard #ChartJS #WebDev
0 notes
Photo

New Post has been published on https://codebriefly.com/real-world-projects-and-use-cases-with-angular-19/
Real-World Projects and Use Cases with Angular 19
Angular 19 is a powerful framework that continues to be a popular choice for building dynamic, scalable, and responsive web applications. Whether you are working on an enterprise-grade platform or a personal project, Angular 19 offers the tools and features needed to build high-performance applications. In this blog, we will explore some real-world projects and use cases to understand how Angular 19 can be utilized effectively.
Table of Contents
Toggle
Why Choose Angular 19 for Real-World Projects?
Popular Real-World Projects Built with Angular
Use Case 1: Real-Time Data Dashboards
Key Features:
Example Code:
Use Case 2: E-Commerce Applications
Key Features:
Example Library:
Use Case 3: Progressive Web Applications (PWAs)
Key Features:
How to Set Up PWA Support:
Best Practices for Real-World Angular Projects
Final Thoughts
Why Choose Angular 19 for Real-World Projects?
Angular 19 comes with several improvements that make it ideal for real-world applications. These include enhanced performance, robust state management, and a modular architecture. Choosing Angular 19 ensures scalability, maintainability, and optimal performance, making it the go-to framework for large-scale and enterprise applications.
Popular Real-World Projects Built with Angular
Enterprise Dashboards and Admin Panels
Angular 19’s modular structure and built-in RxJS support make it perfect for dashboards.
Real-time data handling with WebSockets and reactive programming.
Example: Google Analytics Dashboard
E-Commerce Platforms
Dynamic UI/UX with Angular Material and seamless state management with NgRx.
Real-time inventory updates and interactive checkout experiences.
Example: IKEA’s in-store digital catalog, internal dashboards at Deutsche Bank and Forbes
Content Management Systems (CMS)
Powerful routing and navigation for dynamic content loading.
Example: Contentful CMS with Angular Frontend
Single Page Applications (SPAs)
Enhanced routing and state management.
High performance with Ahead-of-Time (AOT) compilation.
Example: Weather Applications and Task Managers
Use Case 1: Real-Time Data Dashboards
Real-time dashboards are essential for monitoring business metrics and system performance. Angular 19 is ideal for creating interactive and dynamic dashboards due to its robust data binding and component-based architecture.
Key Features:
Live Data Feeds: Integrate WebSocket for live updates.
Charts and Graphs: Use libraries like Chart.js and D3.js.
Responsive Layout: Angular Material ensures mobile compatibility.
Example Code:
import Component, OnInit from '@angular/core'; import WebSocketService from './web-socket.service'; @Component( selector: 'app-dashboard', templateUrl: './dashboard.component.html' ) export class DashboardComponent implements OnInit data: any[] = []; constructor(private wsService: WebSocketService) ngOnInit(): void this.wsService.getData().subscribe((message) => this.data.push(message); );
Use Case 2: E-Commerce Applications
Angular 19’s ability to manage complex states makes it a prime choice for e-commerce apps. Using NgRx for state management allows for predictable and efficient handling of data, while Angular Universal enables server-side rendering for better SEO.
Key Features:
Product Catalog and Search Functionality
Cart and Checkout with Secure Payment Integration
User Authentication and Profile Management
Example Library:
NgRx Store: Efficient state management
Angular Universal: Improves SEO and page load speed
Use Case 3: Progressive Web Applications (PWAs)
PWAs provide a native app-like experience directly from the browser. Angular 19’s PWA support includes offline functionality and responsive layouts.
Key Features:
Offline Access: Uses Service Workers
Push Notifications: Engages users even when the app is not active
Fast Load Times: Optimized for speed
How to Set Up PWA Support:
ng add @angular/pwa
Best Practices for Real-World Angular Projects
Use Lazy Loading: Reduces initial load time by loading modules as needed.
Optimize Change Detection: Use OnPush strategy where applicable.
Implement State Management: Use NgRx for predictable state handling.
Enable Ahead-of-Time (AOT) Compilation: Reduces load time and boosts performance.
Utilize Angular Universal for SEO: Improve page speed and visibility on search engines.
Final Thoughts
Angular 19’s advanced features and robust architecture make it an ideal choice for building large-scale and performance-oriented applications. Whether it’s an e-commerce platform, real-time dashboard, or PWA, leveraging Angular 19 ensures scalability and maintainability.
Keep learning & stay safe 😉
You may like:
Testing and Debugging Angular 19 Apps
Building and Deploying Angular 19 Apps
UI/UX with Angular Material in Angular 19
Performance Optimization and Best Practices in Angular 19
0 notes
Text
Monitoring and Tracking System Development

Monitoring and tracking systems are essential tools for businesses and organizations to oversee operations, manage resources, and improve efficiency. Whether it's tracking inventory, monitoring network performance, or overseeing employee productivity, effective systems help in making informed decisions. In this post, we will explore the key components of monitoring and tracking system development, popular technologies, and best practices.
What is a Monitoring and Tracking System?
A monitoring and tracking system is software designed to collect, analyze, and display data related to specific processes, assets, or activities. These systems help organizations keep tabs on critical metrics in real-time, identify trends, and respond proactively to issues.
Key Features of Monitoring and Tracking Systems
Data Collection: Gather data from various sources, including sensors, APIs, or user inputs.
Real-Time Monitoring: Provide live data updates and alerts for immediate response.
Reporting and Analytics: Generate reports and visualizations to analyze historical data and trends.
Notifications and Alerts: Notify users of significant events, thresholds, or anomalies.
User Management: Manage user roles, permissions, and access levels.
Common Applications of Monitoring and Tracking Systems
Inventory Management: Track stock levels and manage supply chains.
Network Monitoring: Monitor network performance, bandwidth usage, and downtime.
Employee Productivity: Track work hours, task completion, and performance metrics.
Environmental Monitoring: Collect data on air quality, temperature, and other environmental factors.
Asset Tracking: Monitor the location and status of equipment or vehicles.
Technology Stack Suggestions
Frontend: React.js, Angular, or Vue.js for creating interactive user interfaces.
Backend: Node.js, Django, or Flask for handling server-side logic and data processing.
Database: PostgreSQL, MySQL, or MongoDB for storing data.
APIs: Use RESTful or GraphQL APIs for data exchange between frontend and backend.
Data Visualization: Libraries like Chart.js, D3.js, or Plotly for graphical representation of data.
Sample API Endpoint for Monitoring Data (Node.js Example)
const express = require('express'); const bodyParser = require('body-parser'); const app = express(); app.use(bodyParser.json()); let monitoringData = []; // Mock database for monitoring data // Endpoint to receive monitoring data app.post('/api/data', (req, res) => { const data = req.body; monitoringData.push(data); res.status(201).send({ message: 'Data received successfully!' }); }); // Endpoint to retrieve monitoring data app.get('/api/data', (req, res) => { res.send(monitoringData); }); app.listen(3000, () => { console.log('Server is running on port 3000'); });
Best Practices for Developing Monitoring and Tracking Systems
Define clear objectives and requirements before starting development.
Ensure data accuracy and reliability by implementing validation checks.
Design an intuitive user interface to simplify data interpretation.
Incorporate scalability in your architecture to handle growing amounts of data.
Implement security measures to protect sensitive data and ensure user privacy.
Challenges in Monitoring and Tracking System Development
Handling large volumes of data and ensuring efficient processing.
Integrating with existing systems and ensuring compatibility.
Maintaining data accuracy amidst changes in the environment or processes.
Ensuring real-time performance and responsiveness.
Conclusion
Monitoring and tracking systems are vital for organizations to enhance efficiency, make informed decisions, and respond quickly to issues. By leveraging the right technologies and adhering to best practices, you can build robust systems that provide real-time insights and drive operational excellence. Start small, focus on user needs, and iterate to create impactful solutions in monitoring and tracking.
0 notes
Text
蜘蛛池购买有哪些图表工具?TG@yuantou2048
在选择蜘蛛池(通常指的是用于自动化抓取网页数据的工具或服务)时,了解可用的图表工具对于数据分析和可视化非常重要。这些工具可以帮助用户更好地理解和展示抓取到的数据。以下是一些常用的图表工具:
1. Tableau:Tableau 是一个强大的数据可视化工具,可以将复杂的数据转换为易于理解的图表和仪表板。它支持多种数据源,并且提供了丰富的图表类型,适合进行深度的数据分析。
2. Power BI:微软的 Power BI 提供了灵活的数据可视化功能,能够帮助用户创建交互式的报告和仪表板。它支持实时数据连接,非常适合处理大规模数据集。
3. Google Charts:Google 提供的免费在线图表生成器,适用于快速创建各种类型的图表,包括折线图、柱状图、饼图等。它易于使用,且与 Google Sheets 等平台集成良好。
4. Matplotlib:这是一个 Python 的绘图库,广泛应用于科学计算领域。通过编程方式,你可以自定义图表样式和布局,非常适合需要定制化图表需求的场景。
5. ECharts:ECharts 是一个基于 JavaScript 的开源图表库,特别适合用于 Web 应用程序中的数据可视化。它支持多种图表类型,并且可以通过简单的 API 调用来生成图表。
6. Plotly:Plotly 是一个交互式图表库,支持多种编程语言如 Python 和 R,非常适合动态数据展示。
7. Highcharts:Highcharts 是一个轻量级的图表库,支持 HTML5 技术,适用于 Web 开发者,能够生成美观且可交互的图表。
8. D3.js:D3.js 是一个 JavaScript 图表库,允许开发者创建复杂的统计图形和信息图。它非常灵活,能够满足从简单到复杂的可视化需求。
9. Chart.js:这是一个简单易用的 JavaScript 图表库,适用于 Web 开发者,能够生成响应式图表,适用于 Web 应用程序中的数据可视化,支持多种图表类型,包括地图、散点图、柱状图等,非常适合用于 Web 项目中的数据可视化。
8. Excel:虽然 Excel 主要用于日常办公,但其图表工具的选择应根据具体需求来定。
加飞机@yuantou2048

負面刪除
蜘蛛池出租
0 notes
Text
Build a Custom Dashboard with Vue.js & Chart.js
A Hands-On Tutorial to Creating a Personalized Dashboard with Vue.js and Chart.js Table of Contents Introduction Technical Background Implementation Guide Code Examples Best Practices and Optimization Testing and Debugging Conclusion 1. Introduction What is This Tutorial About? This tutorial is a step-by-step guide to creating a personalized dashboard using Vue.js and Chart.js. By the end,…
0 notes
Text
Пет проекты для frontend разработчиков — это отличная возможность прокачать свои навыки и расширить портфолио. Они позволяют экспериментировать с новыми технологиями и подходами, а также демонстрировать свои умения потенциальным работодателям. Одной из самых популярных идей для пет проекта является создание личного портфолио. Вы можете использовать HTML, CSS и JavaScript для разработки адаптивного и привлекательного сайта, который покажет ваши работы и достижения. Это хорошая возможность попрактиковаться в верстке, анимациях и в работе с конструктором. Ещё одна идея — разработка приложения для прогноза погоды. Оно требует интеграции с внешними API, таких как OpenWeatherMap, для получения актуальных данных. Этот проект не только научит вас работать с API, но и позволит отточить навыки работы с асинхронными запросами и обработкой данных. Для более продвинутых разработчиков будет интересен проект интернет-магазина. Это может быть простой магазин с функционалом корзины, фильтрации товаров и оформления заказов. Вы можете использовать React или Vue для фронтенда, а также изучить управление состоянием через Redux или Vuex. Интерактивный дашборд с визуализацией данных — ещё одна захватывающая идея. С помощью библиотек, таких как Chart.js или D3.js, вы сможете создать проект, который отображает статистику и аналитику в виде графиков и диаграмм. Этот проект поможет вам улучшить навыки работы с большими объемами данных и их визуализацией. Пет проекты полезны не только для начинающих, но и для опытных разработчиков. Они помогают постоянно развиваться и оставаться в курсе новых тенденций в мире frontend разработки. Узнайте больше идей и полезной информации по ссылке #пет_проекты_для_frontend_разработчика https://frontendbase.ru/voprosy-i-otvety/pet-proekty-dlya-frontend-razrabotchika/
0 notes
Text
Understanding the Differences Between Pie Charts and Doughnut Charts for Data Visualization
Data Visualization: Frequently Asked Questions Explained
1. What is the main difference between pie chart and doughnut chart?
The main difference between a pie chart and a doughnut chart is that a pie chart displays data as a circular graph with slices representing parts of a whole, while a doughnut chart has a central hole, allowing for additional labeling or data presentation in the center. Both are used for comparing proportions, but the doughnut chart offers more flexibility.
2. How to show percentage in doughnut chart?
To show percentage in a doughnut chart, label each segment with the corresponding percentage value. You can use charting tools or libraries (like Chart.js or Google Charts) that allow for data labels. Additionally, consider adding a legend or tooltip for clarity. Ensure the total of all segments equals 100% to accurately represent the distribution.
3. How do I add text in a doughnut chart?
To add text in a doughnut chart, you can use charting software like Excel or Google Sheets. After creating the chart, click on the chart area to select it, then choose "Add Data Labels" or "Format Data Labels." You can customize the text, position, and appearance in the options available. Alternatively, use charting libraries like Chart for more customization through coding.
4. How to reduce the thickness of a doughnut chart?
To reduce the thickness of a doughnut chart, adjust the "hole size" or "inner radius" settings in your charting software. Increasing the inner radius will make the doughnut thinner. Additionally, you can modify the chart’s overall size, but ensure it maintains readability. Check the software's documentation for specific options related to doughnut chart customization.
5. How to create a donut chart in PPT?
To create a donut chart in PowerPoint, go to the "Insert" tab, select "Chart," and choose "Doughnut." Enter your data in the Excel sheet that appears, then customize the chart's design and colors as needed. Close the Excel sheet, and your donut chart will be displayed on your slide. Adjust size and position as desired.

Visit: VS Website See: VS Portfolio
0 notes