#DataInsights
Explore tagged Tumblr posts
Visit Tumblr Blog
Explore Tumblr blogs with no restrictions, modern design and the best experience.
Last Seen Tumblr Blogs


Fun Fact
Tumblr has been providing a Korean-language service since 2013.
Text
The Automation Revolution: How Embedded Analytics is Leading the Way

Embedded analytics tools have emerged as game-changers, seamlessly integrating data-driven insights into business applications and enabling automation across various industries. By providing real-time analytics within existing workflows, these tools empower organizations to make informed decisions without switching between multiple platforms.
The Role of Embedded Analytics in Automation
Embedded analytics refers to the integration of analytical capabilities directly into business applications, eliminating the need for separate business intelligence (BI) tools. This integration enhances automation by:
Reducing Manual Data Analysis: Automated dashboards and real-time reporting eliminate the need for manual data extraction and processing.
Improving Decision-Making: AI-powered analytics provide predictive insights, helping businesses anticipate trends and make proactive decisions.
Enhancing Operational Efficiency: Automated alerts and anomaly detection streamline workflow management, reducing bottlenecks and inefficiencies.
Increasing User Accessibility: Non-technical users can easily access and interpret data within familiar applications, enabling data-driven culture across organizations.
Industry-Wide Impact of Embedded Analytics
1. Manufacturing: Predictive Maintenance & Process Optimization
By analyzing real-time sensor data, predictive maintenance reduces downtime, enhances production efficiency, and minimizes repair costs.
2. Healthcare: Enhancing Patient Outcomes & Resource Management
Healthcare providers use embedded analytics to track patient records, optimize treatment plans, and manage hospital resources effectively.
3. Retail: Personalized Customer Experiences & Inventory Optimization
Retailers integrate embedded analytics into e-commerce platforms to analyze customer preferences, optimize pricing, and manage inventory.
4. Finance: Fraud Detection & Risk Management
Financial institutions use embedded analytics to detect fraudulent activities, assess credit risks, and automate compliance monitoring.
5. Logistics: Supply Chain Optimization & Route Planning
Supply chain managers use embedded analytics to track shipments, optimize delivery routes, and manage inventory levels.
6. Education: Student Performance Analysis & Learning Personalization
Educational institutions utilize embedded analytics to track student performance, identify learning gaps, and personalize educational experiences.
The Future of Embedded Analytics in Automation
As AI and machine learning continue to evolve, embedded analytics will play an even greater role in automation. Future advancements may include:
Self-Service BI: Empowering users with more intuitive, AI-driven analytics tools that require minimal technical expertise.
Hyperautomation: Combining embedded analytics with robotic process automation (RPA) for end-to-end business process automation.
Advanced Predictive & Prescriptive Analytics: Leveraging AI for more accurate forecasting and decision-making support.
Greater Integration with IoT & Edge Computing: Enhancing real-time analytics capabilities for industries reliant on IoT sensors and connected devices.
Conclusion
By integrating analytics within existing workflows, businesses can improve efficiency, reduce operational costs, and enhance customer experiences. As technology continues to advance, the synergy between embedded analytics and automation will drive innovation and reshape the future of various industries.
To know more: data collection and insights
data analytics services
2 notes
·
View notes
Text
Why do online surveys produce bad data? Learn about common pitfalls, their impact on research, and actionable solutions for cleaner, more reliable data.
To know more: data analytics services
fraud prevention solution
2 notes
·
View notes
Text
The Ultimate Data Collection Handbook: Exploring Methods, Types, and Advantages

Data collection is a fundamental part of any research, business strategy, or decision-making process. Whether you're a student, a professional, or just curious about how data is gathered and used, understanding the basics of data collection can be incredibly useful. In this guide, we'll explore the methods, types, and benefits of data collection in a way that’s easy to understand.
What is Data Collection?
Data collection is the process of gathering information to answer specific questions or to support decision-making. This information, or data, can come from various sources and can be used to make informed decisions, conduct research, or solve problems.
Methods of Data Collection
Surveys and Questionnaires
What Are They? Surveys and questionnaires are tools used to gather information from people. They can be distributed in person, by mail, or online.
How Do They Work? Respondents answer a series of questions that provide insights into their opinions, behaviors, or experiences.
When to Use Them? Use surveys and questionnaires when you need to gather opinions or experiences from a large group of people.
Interviews
What Are They? Interviews involve asking questions to individuals in a one-on-one setting or in a group discussion.
How Do They Work? The interviewer asks questions and records the responses, which can be either structured (with set questions) or unstructured (more conversational).
When to Use Them? Use interviews when you need detailed, qualitative insights or when you want to explore a topic in depth.
Observations
What Are They? Observations involve watching and recording behaviors or events as they happen.
How Do They Work? The observer notes what is happening without interfering or influencing the situation.
When to Use Them? Use observations when you need to see actual behavior or events in their natural setting.
Experiments
What Are They? Experiments involve manipulating variables to see how changes affect outcomes.
How Do They Work? Researchers control certain variables and observe the effects on other variables to establish cause-and-effect relationships.
When to Use Them? Use experiments when you need to test hypotheses and understand the relationships between variables.
Secondary Data Analysis
What Is It? This method involves analyzing data that has already been collected by someone else.
How Does It Work? Researchers use existing data from sources like government reports, research studies, or company records.
When to Use It? Use secondary data analysis when you need historical data or when primary data collection is not feasible.
Types of Data
Quantitative Data
What Is It? Quantitative data is numerical and can be measured or counted.
Examples: Age, income, number of products sold.
Use It When: You need to quantify information and perform statistical analysis.
Qualitative Data
What Is It? Qualitative data is descriptive and involves characteristics that can be observed but not measured numerically.
Examples: Customer feedback, interview responses, descriptions of behavior.
Use It When: You need to understand concepts, opinions, or experiences.
Benefits of Data Collection
Informed Decision-Making
Data provides insights that help individuals and organizations make informed decisions based on evidence rather than guesswork.
Identifying Trends and Patterns
Collecting data allows you to identify trends and patterns that can inform future actions or strategies.
Improving Services and Products
By understanding customer needs and preferences through data, businesses can improve their products and services to better meet those needs.
Supporting Research and Development
Data is crucial for researchers to test hypotheses, validate theories, and advance knowledge in various fields.
Enhancing Efficiency
Data helps in streamlining processes and improving operational efficiency by highlighting areas that need attention or improvement.
Conclusion
Understanding the methods, types, and benefits of data collection can greatly enhance your ability to gather useful information and make informed decisions. Whether you're conducting research, running a business, or just curious about the world around you, mastering data collection is a valuable skill. Use this guide to get started and explore the many ways data can help you achieve your goals.
To know more: A Guide to Data Collection: Methods, Types, and Benefits
Outsource Data Collection Services
5 notes
·
View notes
Text
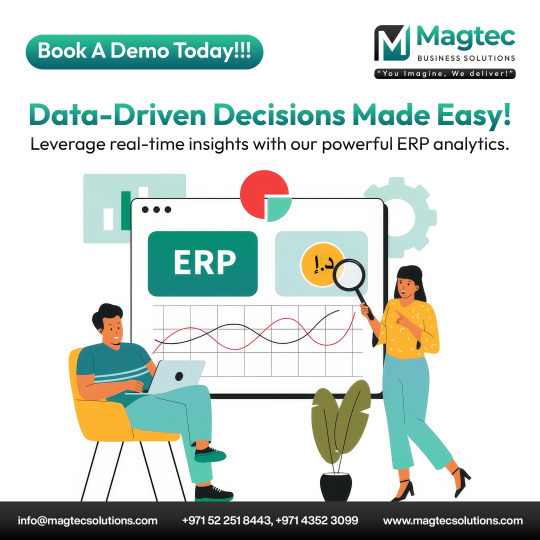
Transform your business with Magtec's powerful ERP analytics! 📊 Make data-driven decisions effortlessly and unlock real-time insights. 🚀 Book a demo today and experience the future of business solutions. 🌟
#magtec#erp#businesssolutions#datadriven#realtimeinsights#analytics#techinnovation#businessgrowth#digitaltransformation#smartbusiness#efficiency#techsolutions#innovation#businessintelligence#futureofbusiness#enterprisesolutions#techtrends#businessstrategy#datainsights#businessoptimization#erpsystem#businessinnovation#techforbusiness#businesssuccess#digitalbusiness#erpsoftware#businessanalytics#smartdecisions#businessgoals#magtecsolutions
2 notes
·
View notes
Text
🔍 Elevate your document analysis with AlgoDocs' state-of-the-art automated table extraction.
In today's digital era, where information is abundant, efficiency is paramount. AlgoDocs seamlessly identifies and extracts structured data from tables, eliminating manual entry and cumbersome processes.
🚀 Why AlgoDocs?
✅ Harness advanced OCR algorithms and AI techniques.
✅ Achieve accurate identification of tables in various document formats.
✅ Streamline operations, enhance decision-making, and gain a competitive edge.
📈 Unlock the true potential of your data-rich documents across industries such as finance, healthcare, research, and legal entities. AlgoDocs empowers you to extract valuable insights, automate processes, and make informed decisions.
💼 Embrace efficiency. Subscribe now for a forever-free plan with 50 pages per month. Tailored pricing plans are available for higher processing needs. Contact us for custom solutions.
#TableExtraction#DocumentAnalysis#DataInsights#AlgoDocs#BusinessAutomation#OCRAlgorithms#AITechnology#StructuredDataExtraction#DocumentProcessing#PDFConversion
3 notes
·
View notes
Text
Unleashing the Power of Data Analytics & Reporting: A Guide to Enhanced Decision-Making
In today's fast-paced business landscape, data reigns supreme. Every click, purchase, and interaction generate a wealth of valuable information waiting to be analysed and utilized. The ability to harness this data effectively through analytics and reporting can make all the difference between thriving and merely surviving in the competitive marketplace.
The Role of Data Analytics & Reporting
Data analytics involves examining raw data to draw conclusions and insights, while reporting involves presenting these findings in a structured format to facilitate decision-making. Together, they provide businesses with the necessary tools to understand customer behaviour, optimize processes, and drive strategic initiatives.
Importance of Data Analytics:
1. Informed Decision-Making: By analysing past trends and patterns, businesses can make data-driven decisions rather than relying on intuition or guesswork.
2. Competitive Advantage: Companies that leverage data analytics gain a competitive edge by identifying opportunities for growth, improving efficiency, and mitigating risks.
3. Enhanced Customer Experience: Understanding customer preferences and behavior enables personalized marketing efforts, leading to higher customer satisfaction and loyalty.
Significance of Reporting:
1. Communication of Insights: Reports serve as a means to communicate key findings, trends, and metrics to stakeholders, facilitating understanding and alignment across the organization.
2. Performance Tracking: Regular reporting allows businesses to monitor performance against goals and objectives, enabling timely adjustments and course corrections.
3. Compliance and Accountability: Reporting plays a crucial role in meeting regulatory requirements, ensuring transparency, and holding individuals and departments accountable for their actions.
Leveraging Outsourcingwise Consulting's Training for Data Analytics & Reporting
In the realm of data analytics and reporting, staying abreast of the latest tools, techniques, and best practices is essential for success. This is where Outsourcingwise Consulting's training programs come into play, offering comprehensive courses designed to equip professionals with the skills needed to excel in this field.
Cutting-Edge Curriculum:
Outsourcingwise Consulting's training curriculum covers a wide range of topics, including:
- Data Collection and Preparation: Understanding data sources, cleaning, and transforming raw data into usable formats.
- Statistical Analysis: Applying statistical methods to uncover patterns, correlations, and trends within the data.
- Data Visualization: Communicating insights effectively through charts, graphs, and dashboards.
- Reporting Tools: Utilizing industry-leading reporting tools such as Tableau, Power BI, and Google Data Studio to create compelling reports.
- Advanced Analytics Techniques: Delving into predictive analytics, machine learning, and AI for more sophisticated analysis and forecasting.
Hands-On Learning:
One of the key features of Outsourcingwise Consulting's training programs is their emphasis on practical, hands-on learning. Participants could work on real-world projects, applying their newly acquired skills to solve actual business problems. This experiential learning approach ensures that participants are not just theory-smart but also equipped with the practical know-how to tackle challenges in the workplace.
Expert Guidance:
The trainers at Outsourcingwise Consulting are seasoned professionals with extensive experience in the field of data analytics and reporting. They bring their wealth of knowledge and expertise to the training sessions, providing valuable insights, tips, and guidance to participants. Whether you're a beginner looking to build a solid foundation or an experienced professional seeking to deepen your skills, the trainers at Outsourcingwise Consulting are committed to helping you achieve your goals.
Career Advancement Opportunities:
In today's job market, proficiency in data analytics and reporting is in high demand across industries. By completing Outsourcingwise Consulting's training programs, participants not only enhance their skill set but also position themselves for career advancement opportunities. Whether it's securing a promotion within their current organization or transitioning to a new role in a different industry, the skills acquired through Outsourcingwise Consulting's training can open doors to exciting career prospects.
Conclusion
In conclusion, data analytics and reporting play a pivotal role in driving informed decision-making, enhancing organizational performance, and gaining a competitive edge in the marketplace. By leveraging Outsourcingwise Consulting's training programs, professionals can acquire the skills and knowledge needed to excel in this dynamic and rapidly evolving field. Whether you're a business leader seeking to unlock the full potential of your data or an aspiring data analyst looking to kick-start your career, Outsourcingwise Consulting offers the expertise and resources to help you succeed. Embrace the power of data analytics and reporting today, and chart a course towards a brighter, more data-driven future.
#DataAnalyticsTraining#AnalyticsEducation#DataTraining#DataScienceEducation#AnalyticsWorkshops#DataLearning#DataSkills#AnalyticsCertification#DataProfessionals#DataDrivenDecisions#AnalyticsConsulting#DataInsights#DataStrategy#BigDataTraining#DataAnalyticsBootcamp#DataVisualization#MachineLearningTraining#BusinessAnalytics#DataProficiency#AnalyticsTutorials
2 notes
·
View notes
Text
Certified Data Scientist: Mastering the Journey with IABAC
By becoming a certified data scientist, you open yourself up to a world of possibilities in the ever-changing world of technology. The International Association of Business Analytics Certifications (IABAC) plays a crucial role in this field by providing a recognized platform for professionals to validate their skills.
At the heart of data science is extracting valuable insights from huge amounts of data. Being certified by IABAC not only showcases your proficiency in handling complex data but also demonstrates your dedication to excellence. The certification process involves rigorous training and evaluation, ensuring that you are well-prepared to tackle practical challenges.
The Certified Business Analytics credential is a recognized achievement that covers the complexities of both data science and business analytics. This certification indicates that the holder has a solid grasp of how to use data to drive business growth. It signifies not only technical expertise but also the capability to match data strategies with overall business goals.
The IABAC's Business Analytics Certification is an impressive achievement that highlights the importance of using analytics strategically to guide business choices. Individuals who possess this certification have a unique blend of technical skills and business knowledge, making them extremely valuable to organizations seeking data-oriented solutions.
The journey towards certification starts by building a strong foundation in data science principles. Aspiring candidates explore various topics like statistical analysis, machine learning, and data visualization. What makes IABAC stand out is its focus on practical application. The certification process includes hands-on projects, allowing individuals to apply their knowledge in real-world scenarios.
Certified data scientists who complete their training gain a prestigious credential and become valued members of a global community of experts. At IABAC.org, we offer networking opportunities that allow professionals to connect, collaborate, and stay updated on the latest industry trends.
#DataScience#IABACCertification#AnalyticsCertification#DataInsights#MachineLearning#CertifiedDataScientist#TechCertifications#DataAnalytics#BigDataSkills#IABAC.org#DigitalSkills#TechProfessionals#DataVisualization#BusinessAnalytics#DataMastery#DataDrivenDecisions#ProfessionalDevelopment#TechCommunity#CareerGrowth#IABACCommunity#DataProfessionals#LearnDataScience#BusinessAnalyticsCertifications#CertifiedBusinessAnalytics
3 notes
·
View notes
Text
Embracing the synergy of Cloud & DaaS revolutionizes data analytics! Instant access, supreme scalability, & cost-effectiveness drive data-driven decisions. We're at a new horizon, unbound by limits, ready to soar with informed strategies. Join the journey towards boundless innovation!
#clouds#daas#data analytics#data driven#dataviz#datainsights#business intelligence#data science#bigdata#machine learning#artificial intelligence#digital transformation#getondata
2 notes
·
View notes
Photo
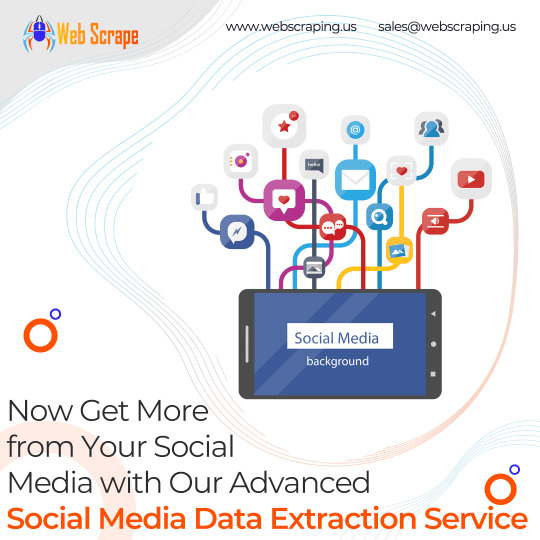
Stay ahead of the social media game and enhance your marketing strategies with our social media data extraction service. With the global social media analytics market projected to grow at a CAGR of 34.1%, it's more important than ever to gain valuable insights and stay competitive. Contact us today to learn more!
For more information, https://webscraping.us/web-data-extraction/ or contact us at [email protected]
4 notes
·
View notes
Text
Enhance Your Ecommerce Fulfillment Game!
Looking to minimize Return to Origin rates and keep your customers delighted? Check out these 5 game-changing strategies to optimize your fulfillment process! From accurate product descriptions to proactive customer support, we've got you covered!
👉 Swipe through to discover the secrets to success! 👉 . .
#RTOs#BusinessSuccess#DataInsights#Optimization#warehousity#EcommerceFulfillment#CustomerSatisfaction#OptimizeYourBusiness
2 notes
·
View notes
Text
Top 5 trends to enhance big data with geo targeted proxies in 2023

📊 Stay ahead of the big data game with geo targeted proxies! Explore the top 5 trends that are revolutionizing data analytics in 2023. Discover how Dexodata leverages these trends to unlock valuable insights. Read more: https://dexodata.com/en/blog/top-5-trends-to-enhance-big-data-with-geo-targeted-proxies-in-2023
2 notes
·
View notes
Text
The Biggest Hurdles in Market Research Today

The market research industry has been undergoing significant changes, driven by technological advancements, shifting consumer behaviors, and the increasing demand for real-time insights. Below are the key challenges transforming this dynamic industry:
1. Data Overload and Management
With the proliferation of digital platforms, organizations have access to vast amounts of data. While this presents opportunities, managing and making sense of this data remains a major challenge.
2. Evolving Consumer Behavior
Consumer preferences are changing rapidly due to societal, economic, and technological factors.
3. Integration of Advanced Technologies
The adoption of artificial intelligence (AI), machine learning (ML), and big data analytics has revolutionized market research.
4. Data Privacy and Ethical Concerns
Stringent data privacy regulations, such as GDPR and CCPA, have introduced complexities in data collection and usage.
5. Declining Response Rates
As consumers become increasingly wary of surveys and data collection methods, response rates have dropped.
6. Demand for Real-Time Insights
Businesses now require faster and more actionable insights to stay competitive.
7. Globalization and Cultural Nuances
Conducting market research across diverse geographies and cultures introduces complexities in interpreting data.
8. Budget Constraints and ROI Pressures
Clients increasingly demand more insights at lower costs, challenging research firms to demonstrate the ROI of their services while managing operational expenses.
9. Adapting to Hybrid Research Models
The industry is shifting towards hybrid research methods that combine qualitative and quantitative techniques, as well as traditional and digital tools.
Conclusion
The challenges transforming the market research industry are reshaping its landscape. Companies that proactively address these hurdles through innovation, adaptability, and ethical practices will be better positioned to thrive in this evolving market. Staying ahead of these changes is not just an option—it's a necessity for sustained success.
To know more: data analytics services company
healthcare market research services
3 notes
·
View notes
Text
7 Key Principles to Drive Success in Market Research

Market research plays a crucial role in guiding business strategies and decision-making. Here are seven key principles to ensure success in your market research efforts:
1. Define Clear Objectives
Start with well-defined goals. Understand what insights you need and how they will support your business decisions.
2. Know Your Audience
Identify and segment your target audience effectively. Tailor your research methods to align with their preferences and behaviors.
3. Choose the Right Methodology
Select the most suitable research approach, whether qualitative, quantitative, or a hybrid model, to ensure meaningful results.
4. Leverage Advanced Tools and Technology
Incorporate AI, big data, and analytics tools to enhance data accuracy and speed. Modern technology can streamline data collection and interpretation.
5. Ensure Data Quality
Prioritize data accuracy, relevance, and reliability. Scrutinize data sources and methodologies to avoid biased or incomplete insights.
6. Adhere to Ethical Standards
Respect privacy and comply with regulations like GDPR. Ethical practices build trust and credibility with your audience.
7. Translate Insights into Action
Insights are valuable only when applied. Create actionable recommendations and integrate them into your strategy to drive results.
By following these keys, businesses can elevate their market research practices and gain a competitive edge in their industry.
To know more: online market research platforms
online panel management platform
fraud detection and reporting tool
#market research#onlineresearch#samplemanagement#panelmanagement#communitypanel#datacollection#onlinesurvey#fraud detection#datainsights
3 notes
·
View notes
Text
The Next Wave: Business AI, Privacy, and Navigation Industry Evolution

As technology continues to advance, the interplay between artificial intelligence (AI), privacy, and the navigation industry is reshaping the business landscape. Here's a glimpse into how these elements are driving transformation:
1. AI's Expanding Role in Business
AI is revolutionizing industries with its ability to analyze vast datasets, predict trends, and automate processes. In navigation, AI enables real-time traffic updates, predictive routing, and autonomous vehicle advancements. Businesses leveraging AI gain a competitive edge by offering smarter, more efficient solutions.
2. Privacy Challenges and Innovations
With AI's reliance on data, privacy concerns are escalating. Regulations like GDPR and CCPA are setting stricter standards for data usage, urging companies to prioritize transparency and ethical practices. Balancing personalized services with data protection is becoming a critical challenge for businesses.
3. Navigation Industry Transformation
The navigation industry is evolving with AI-driven innovations, such as augmented reality (AR) mapping, enhanced geolocation services, and integration with IoT devices. These advancements not only improve user experiences but also open new avenues for businesses to deliver value in logistics, travel, and urban planning.
Conclusion
The convergence of AI, privacy considerations, and navigation technology signals a future filled with opportunities and challenges. Businesses that embrace AI while respecting privacy and adapting to industry changes will be well-positioned to thrive in this evolving landscape.
To know more: Survey Programming & Hosting Company
Outsource Data Collection Services
2 notes
·
View notes
Text
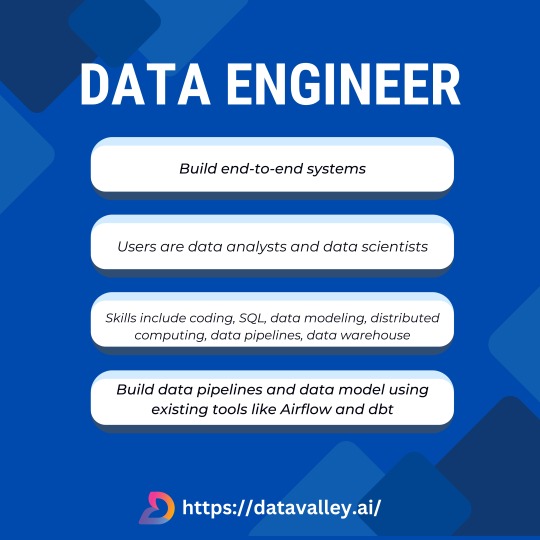
A data engineer is a professional who designs, develops, and maintains the infrastructure and systems necessary for handling large volumes of data. They specialize in constructing data pipelines, optimizing data workflows, and ensuring data quality and reliability. With expertise in programming, data modeling, and database management, data engineers play a crucial role in enabling effective data analysis and decision-making within organizations.
More Information Visit :-https://datavalley.ai/.../aws-data-engineering-masters.../
#DataTeam#DataExperts#DataAnalytics#DataDrivenDecisions#DataInsights#DataTransformers#DataMasters#DataVisualization#AnalyticsTeam#DataIntelligence#DataSolutions#DataInnovation#DataStrategy#DataLeadership#DataDrivenCulture#DataProfessionals#DataEnthusiasts#DataSkills#DataInfluencers#DataExcellence
2 notes
·
View notes
Text
Advanced Power BI Techniques: From Data Prep to Visualization
In today’s data-driven world, businesses are constantly seeking smarter ways to turn raw data into actionable insights. Power BI, Microsoft’s powerful business analytics tool, is one of the most widely used platforms for data visualization and reporting. While beginners can build basic dashboards with ease, mastering advanced Power BI techniques can help you unlock the platform’s full potential—from data preparation to impactful visualizations.
If you're ready to take your skills to the next level, this article is your roadmap.

Why Go Beyond the Basics?
Power BI is more than just drag-and-drop charts. Advanced users tap into features like:
Power Query for complex data transformations
DAX (Data Analysis Expressions) for custom calculations
Data modeling for relational analysis
Row-level security for access control
Custom visuals and drill-through reports
These capabilities allow you to build highly interactive, real-time dashboards that deliver deep insights tailored to your organization’s needs.
Advanced Data Preparation with Power Query
Power Query is the engine behind Power BI’s data transformation capabilities. It allows users to clean, filter, merge, pivot, and shape data before it even hits the report canvas.
Examples of advanced data prep techniques:
Creating custom columns using M language
Merging multiple datasets from different sources
Automating refresh schedules for large-scale data flows
Mastering DAX for Smart Calculations
DAX is the formula language of Power BI. With it, you can create calculated columns, measures, and KPIs to deliver deeper analysis.
Popular advanced DAX functions:
CALCULATE – for dynamic filtering
FILTER – for customized context evaluation
TIME INTELLIGENCE – for date-based comparisons
RANKX – for creating rank-based insights
Advanced Visualizations That Tell a Story
Power BI lets you create more than just bar charts and pie graphs. With custom visuals, drill-through pages, bookmarks, and tooltips, you can build storytelling dashboards that guide users through your data.
Pro Tips:
Use heat maps and decomposition trees for root cause analysis.
Leverage tooltips to give extra context without cluttering the dashboard.
Use bookmarks to create guided reports or interactive presentations.
Power BI Training in KPHB: Learn from the Experts
If you’re serious about advancing your career in data analytics, enrolling in a structured course can be a game-changer. At NareshIT, our Power BI training in KPHB is designed to take you from intermediate to expert level with hands-on projects and real-world case studies.
👉 Visit NareshIT – Power BI Training in KPHB
FAQs – Power BI Training in KPHB
Q1: What is covered in the Power BI training at KPHB? A: The course covers Power BI basics, advanced DAX, Power Query, data modeling, report design, and real-time dashboards with hands-on practice.
Q2: Do I need prior experience with Power BI? A: Basic understanding of Excel and data concepts is helpful, but the course includes beginner to advanced content.
Q3: Is certification included? A: Yes, upon completion of the course, you’ll receive a recognized certification from NareshIT.
Q4: Are live projects included in the course? A: Absolutely! The training includes real-time projects to help you apply what you learn in practical scenarios.
Q5: How do I enroll in the Power BI course in KPHB? A: You can easily register online. Visit this link for more details.
Whether you're a data analyst, business user, or aspiring BI professional, mastering advanced Power BI techniques is a powerful step toward making smarter business decisions. Don’t just use data—make it work for you.
👉 Join Power BI Training in KPHB at NareshIT Today!
#powerbi#darascience#dataanalytics#BusinessIntelligence#data#DataInsights#python#DataDrivenDecisions#tableau#DataTools#sql#dashboard#DataReporting#onlinelearning#analytics#courses#dynamics#bi#software
0 notes