#ForexChartPatterns
Explore tagged Tumblr posts
Text
The Ultimate Forex Trading Patterns List: Key Patterns Every Trader Should Know
In the fast-paced world of Forex trading, understanding chart patterns is essential for identifying potential market movements. These patterns serve as visual representations of price action, helping traders make informed decisions. Mastering key Forex trading patterns can significantly enhance your trading skills and improve your chances of success. In this article, we’ll explore the most important Forex trading patterns every trader should know.

What Are Forex Trading Patterns?
Forex trading patterns are formations on price charts that indicate potential market movements. They are created by fluctuations in price over time and can help traders predict future trends. Patterns fall into two main categories: continuation patterns and reversal patterns.
Continuation patterns suggest that the current trend will continue after a brief consolidation.
Reversal patterns signal that the market is likely to change direction.
By recognizing these patterns, traders can better time their entries and exits, improving their overall strategy.
Why Forex Trading Patterns Matter
Understanding Forex patterns is crucial for several reasons:
Predicting Market Behavior: Patterns help traders anticipate price movements with greater accuracy.
Risk Management: Recognizing patterns allows traders to set appropriate stop-loss and take-profit levels.
Enhanced Decision-Making: Patterns provide a structured approach to analyzing the market, reducing emotional trading.
Now, let’s dive into the key Forex trading patterns every trader should know.
1. Head and Shoulders Pattern
Description
The Head and Shoulders pattern is a popular reversal pattern that signals a potential trend change. It consists of three peaks: a higher peak (head) between two lower peaks (shoulders). This pattern is typically seen at the end of an uptrend.
How It Works
Left Shoulder: The first peak forms after a strong upward movement.
Head: The second, higher peak represents the continuation of the uptrend.
Right Shoulder: The final peak is lower than the head, signaling weakening bullish momentum.
Once the neckline is broken, it confirms the reversal, and the price typically moves downward.
Trading Tip
Wait for the price to break below the neckline with high volume before entering a short position.
2. Inverse Head and Shoulders Pattern
Description
The Inverse Head and Shoulders pattern is the bullish counterpart of the regular Head and Shoulders. It signals a potential reversal from a downtrend to an uptrend.
How It Works
Left Shoulder: The first low forms after a strong downward movement.
Head: The second low is deeper, representing the continuation of the downtrend.
Right Shoulder: The final low is higher than the head, indicating reduced bearish pressure.
Once the price breaks above the neckline, the trend reversal is confirmed.
Trading Tip
Enter a long position when the price breaks above the neckline with strong volume.
3. Double Top and Double Bottom Patterns
Double Top Pattern
A Double Top is a bearish reversal pattern that appears after an uptrend. It consists of two consecutive peaks at roughly the same level, separated by a moderate dip.
How It Works
After the second peak, the price fails to break higher and reverses downward.
The confirmation occurs when the price breaks below the support level formed by the dip between the two peaks.
Double Bottom Pattern
The Double Bottom is the bullish counterpart of the Double Top. It signals a potential reversal from a downtrend to an uptrend.
How It Works
The price forms two consecutive lows at a similar level.
The confirmation occurs when the price breaks above the resistance level formed by the peak between the two lows.
Trading Tip
For both patterns, wait for a confirmed breakout before entering a position.
4. Triangles
Triangles are continuation patterns that indicate a period of consolidation before the trend resumes. There are three types of triangle patterns:
Ascending Triangle
This bullish pattern features a flat resistance level and rising support. It indicates that buyers are gaining strength and a breakout to the upside is likely.
Descending Triangle
This bearish pattern has a flat support level and declining resistance. It suggests that sellers are in control, and a downside breakout is expected.
Symmetrical Triangle
This neutral pattern forms when both support and resistance converge toward each other. The breakout can occur in either direction, so traders must watch for confirmation.
Trading Tip
Wait for a breakout with strong volume to confirm the direction of the trend before taking a position.
5. Flags and Pennants
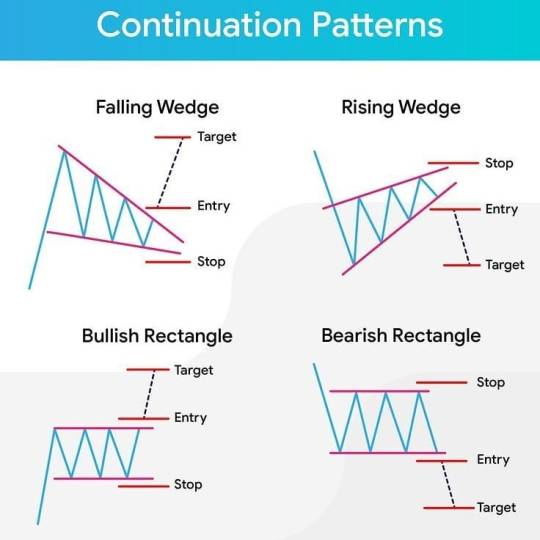
Flags and pennants are short-term continuation patterns that indicate a brief pause in the current trend before it resumes.
Flag Pattern
The flag resembles a small rectangle that slopes against the prevailing trend. It indicates a brief consolidation before the trend continues.
Pennant Pattern
The pennant is similar to the flag but has a triangular shape. It forms after a strong price movement, followed by a brief consolidation period.
Trading Tip
Enter a trade in the direction of the breakout once the price exits the flag or pennant formation.
6. Wedge Patterns
Wedges are reversal or continuation patterns that indicate a narrowing price range. There are two types:
Rising Wedge
This bearish pattern forms when the price makes higher highs and higher lows, but the range narrows over time. It usually signals an impending downward breakout.
Falling Wedge
This bullish pattern forms when the price makes lower highs and lower lows, with the range narrowing over time. It typically precedes an upward breakout.
Trading Tip
Wait for a confirmed breakout before entering a trade, as false breakouts are common with wedges.
Conclusion
Mastering Forex trading patterns is a vital skill for any serious trader. By understanding and recognizing key patterns such as Head and Shoulders, Double Tops and Bottoms, Triangles, Flags, Pennants, and Wedges, you can significantly improve your market analysis and trading decisions. At Shenzhou Capital, we emphasize the importance of combining these patterns with a well-rounded trading strategy to help traders achieve consistent results.
Remember, no pattern is 100% accurate, and it’s essential to combine them with other technical indicators and sound risk management strategies. With practice and patience, these patterns can become powerful tools in your trading arsenal.
So, start observing these patterns on your charts and incorporate them into your trading strategy. The more you practice, the better you’ll get at identifying opportunities and making confident trades in the Forex market.
#ForexTrading#TradingPatterns#ForexStrategy#ForexChartPatterns#HeadAndShouldersPattern#DoubleTopPattern#DoubleBottomPattern#TrianglePattern#WedgePattern
0 notes
Text
How to Develop a Trading Plan.
#WhatisForex#HowtoTradeForex#ForexChartPatterns#WhatisForexTrading#WhyTradeForex#CommonForexMistakes#ForexTradingSignals#TradingPlan#WhoTradesForex#HowtoBuyandSellCurrency
0 notes
Text
forex chart patterns: A Guide to Effortlessly Identifying
forex chart patterns Introduction:

Undoubtedly,forex chart patterns the foreign exchange market or the forex market is the world's largest financial market, boasting an impressive daily trading volume of nearly $6.6 trillion. Subsequently, traders seeking success in this continually evolving environment must effectively grasp the significance of various chart patterns that can help predict market movements. Consequently, in this informative post, we introduce several pivotal forex chart patterns and delve into how they can be applied to make informed trading decisions.
Double Top and Double Bottom

Initially, the double top pattern emerges when a currency's price encounters resistance twice and fails to surpass it. This prevalent pattern typically signals a trend reversal, prompting astute traders to sell. Conversely, the double bottom pattern forms at a well-established support level, suggesting that an upward trend reversal may be looming. patterns
Head and Shoulders

Following an uptrend, a bearish reversal pattern known as the head and shoulders pattern often materializes. This phenomenon is characterized by a central peak (the "head"), flanked by two lower peaks (the "shoulders"). In essence, this pattern reveals that the market is losing momentum and may soon change direction.
Triangles forex chart patterns

Surprisingly, there are three types of triangle patterns: ascending, descending, and symmetrical. Ascending triangles feature a horizontal resistance line and an upward trendline, while descending triangles exhibit a horizontal support line and a downward trendline. On the other hand, symmetrical triangles showcase two converging trendlines and may break out in either an upward or downward direction. Crucially, triangle patterns frequently depict market consolidation before continuation or reversal patterns.
Flags and Pennants

Both flag and pennant patterns are continuation patterns that often appear after a significant price movement, aptly dubbed the "flagpole."
Wedges

Lastly, wedges emerge when two trendlines effectively converge at an angle. When a breakout occurs in the opposite direction of the wedge, this insightful pattern signifies a trend reversal. patterns
forex chart patterns Conclusion:

In conclusion, patterns serve as indispensable tools for traders seeking to amplify their profitability. By accurately identifying and interpreting these patterns, traders can make well-informed decisions, enhancing their chances of success in the fiercely competitive forex market. Investopedia's Forex Chart Patterns Guide "Gain deeper insights and data on market analysis." "Third Party Risk Management: A Comprehensive Guide Businesses"

Read the full article
0 notes
Text


Join us to make profit like we do 🔥
#forexeducation #forexchartpattern #forexmarket #forexchart #forexanalysis #forextrader #forextrade #forexdaytrader #forextips #forexprofit #fxeducation #fxmarket #fxsignals #forexsignals #forexmoney #fxindicator #forexindicator #forextrading #fxtrading
11 notes
·
View notes
Photo

Forex Charts Patterns
The forex charts patterns refer to a collection of past patterns of price behavior for a particular currency pair. Therefore, forex traders must first master the concept of price charts in order to understand forex chart patterns. Price charts are used by analysts, individual traders, and forex market experts to track historical price movements in a currency exchange rate.
More At: What Are Forex Charts Patterns? The Beginners Guide
0 notes
Photo

Technical Analysis in a nutshell!
0 notes
Photo

Join our FREE CHANNEL LINK IN BIO 📈📊✅✅⬆️💎🏆🎯👑👑💰💰🔥🔥🤑🤑🤑🤑🤑 #forexsouthafrica #forexasia #forexbrasil #forexmentor #forexindonesia #forexnews #FOREX #forexcourse #forexindonesiafinance #forextips #forextrader #forextradingsignals #forexbrasilsignal #forexmoney #forexsignalservice #forexindia #forexeducation #forexchartoftheday #forexchartpattern #forexfrance https://www.instagram.com/p/COdUcgBhR85/?igshid=v7ebatmwgsfo
#forexsouthafrica#forexasia#forexbrasil#forexmentor#forexindonesia#forexnews#forex#forexcourse#forexindonesiafinance#forextips#forextrader#forextradingsignals#forexbrasilsignal#forexmoney#forexsignalservice#forexindia#forexeducation#forexchartoftheday#forexchartpattern#forexfrance
0 notes
Text
Common Forex Mistakes.
#WhatisForex#HowtoTradeForex#ForexChartPatterns#WhatisForexTrading#WhyTradeForex#CommonForexMistakes#ForexTradingSignals#TradingPlan#WhoTradesForex#HowtoBuyandSellCurrency
0 notes
Text
Forex Chart Patterns
#WhatisForex#HowtoTradeForex#ForexChartPatterns#WhatisForexTrading#WhyTradeForex#CommonForexMistakes#ForexTradingSignals#TradingPlan#WhoTradesForex#HowtoBuyandSellCurrency
0 notes
Text
Why Trade Forex
#WhatisForex#HowtoTradeForex#ForexChartPatterns#WhatisForexTrading#WhyTradeForex#CommonForexMistakes#ForexTradingSignals#TradingPlan#WhoTradesForex#HowtoBuyandSellCurrency
0 notes
Text
How To Trade Forex
#WhatisForex#HowtoTradeForex#ForexChartPatterns#WhatisForexTrading#WhyTradeForex#CommonForexMistakes#ForexTradingSignals#TradingPlan#WhoTradesForex#HowtoBuyandSellCurrency
1 note
·
View note
Photo

Join our FREE CHANNEL LINK IN BIO 📈📊✅✅⬆️💎🏆🎯👑👑💰💰🔥🔥🤑🤑🤑🤑🤑 #forexsouthafrica #forexasia #forexbrasil #forexmentor #forexindonesia #forexnews #FOREX #forexcourse #forexindonesiafinance #forextips #forextrader #forextradingsignals #forexbrasilsignal #forexmoney #forexsignalservice #forexindia #forexeducation #forexchartoftheday #forexchartpattern #forexfrance https://www.instagram.com/p/COdUZtOB7qh/?igshid=t6y9n7wyx47n
#forexsouthafrica#forexasia#forexbrasil#forexmentor#forexindonesia#forexnews#forex#forexcourse#forexindonesiafinance#forextips#forextrader#forextradingsignals#forexbrasilsignal#forexmoney#forexsignalservice#forexindia#forexeducation#forexchartoftheday#forexchartpattern#forexfrance
0 notes
Photo

Join our FREE CHANNEL LINK IN BIO 📈📊✅✅⬆️💎🏆🎯👑👑💰💰🔥🔥🤑🤑🤑🤑🤑 #forexsouthafrica #forexasia #forexbrasil #forexmentor #forexindonesia #forexnews #FOREX #forexcourse #forexindonesiafinance #forextips #forextrader #forextradingsignals #forexbrasilsignal #forexmoney #forexsignalservice #forexindia #forexeducation #forexchartoftheday #forexchartpattern #forexfrance https://www.instagram.com/p/COdUMvWrnvQ/?igshid=16zob7sbkj3on
#forexsouthafrica#forexasia#forexbrasil#forexmentor#forexindonesia#forexnews#forex#forexcourse#forexindonesiafinance#forextips#forextrader#forextradingsignals#forexbrasilsignal#forexmoney#forexsignalservice#forexindia#forexeducation#forexchartoftheday#forexchartpattern#forexfrance
0 notes
Photo

Join our FREE CHANNEL LINK IN BIO 📈📊✅✅⬆️💎🏆🎯👑👑💰💰🔥🔥🤑🤑🤑🤑🤑 #forexsouthafrica #forexasia #forexbrasil #forexmentor #forexindonesia #forexnews #FOREX #forexcourse #forexindonesiafinance #forextips #forextrader #forextradingsignals #forexbrasilsignal #forexmoney #forexsignalservice #forexindia #forexeducation #forexchartoftheday #forexchartpattern #forexfrance (at NYC Manhattan) https://www.instagram.com/p/COdT718LVhJ/?igshid=rutz0swbzdat
#forexsouthafrica#forexasia#forexbrasil#forexmentor#forexindonesia#forexnews#forex#forexcourse#forexindonesiafinance#forextips#forextrader#forextradingsignals#forexbrasilsignal#forexmoney#forexsignalservice#forexindia#forexeducation#forexchartoftheday#forexchartpattern#forexfrance
0 notes
Photo

Join our FREE CHANNEL LINK IN BIO 📈📊✅✅⬆️💎🏆🎯👑👑💰💰🔥🔥🤑🤑🤑🤑🤑 #forexsouthafrica #forexasia #forexbrasil #forexmentor #forexindonesia #forexnews #FOREX #forexcourse #forexindonesiafinance #forextips #forextrader #forextradingsignals #forexbrasilsignal #forexmoney #forexsignalservice #forexindia #forexeducation #forexchartoftheday #forexchartpattern #forexfrance (at Miami, Florida) https://www.instagram.com/p/COdQoGyLW18/?igshid=1mq08vbidhqx9
#forexsouthafrica#forexasia#forexbrasil#forexmentor#forexindonesia#forexnews#forex#forexcourse#forexindonesiafinance#forextips#forextrader#forextradingsignals#forexbrasilsignal#forexmoney#forexsignalservice#forexindia#forexeducation#forexchartoftheday#forexchartpattern#forexfrance
0 notes
Photo

Join our FREE CHANNEL LINK IN BIO 📈📊✅✅⬆️💎🏆🎯👑👑💰💰🔥🔥🤑🤑🤑🤑🤑 #forexsouthafrica #forexasia #forexbrasil #forexmentor #forexindonesia #forexnews #FOREX #forexcourse #forexindonesiafinance #forextips #forextrader #forextradingsignals #forexbrasilsignal #forexmoney #forexsignalservice #forexindia #forexeducation #forexchartoftheday #forexchartpattern #forexfrance (at NYC) https://www.instagram.com/p/COdQkc1rety/?igshid=edu9b2n10fvp
#forexsouthafrica#forexasia#forexbrasil#forexmentor#forexindonesia#forexnews#forex#forexcourse#forexindonesiafinance#forextips#forextrader#forextradingsignals#forexbrasilsignal#forexmoney#forexsignalservice#forexindia#forexeducation#forexchartoftheday#forexchartpattern#forexfrance
0 notes