#Ichimoku Indicator Tutorial
Video
youtube
Ichimoku Scalping Demystified Your Path to Profitability! 2023 Live
#Ichimoku Trading#Ichimoku Strategy Explained#Ichimoku Indicator Tutorial#Best Ichimoku Scalping Techniques#How to Use Ichimoku for Profit#Ichimoku Kinko Hyo Explained#Ichimoku Live Analysis 2023#Mastering Ichimoku for Beginners#Ichimoku Trading Tips#Scalping with Ichimoku Strategies
0 notes
Text
SuperTrend Indicator - 2020 Guide - MultiCharts & TradeStation Download
Are you searching for SuperTrend Indicator? This post if for you!The Supertrend Indicator (ST), developed by Olivier Seban, was born as a tool to optimize the exit from trade, which is a trailing stop.Today is one of the most used tools by traders.In this tutorial, we will explain what it is, how it is used, and how to calculate it. You can also download SuperTrend free versions for TradeStation, MultiCharts, MetaTrader. What exactly are you looking for?Click to scroll down
Table Of Index
What is SuperTrend Indicator?
How do you use the ST Indicator?
How is SuperTrend calculated?
Download SuperTrend indicator for Free
What is SuperTrend Indicator?
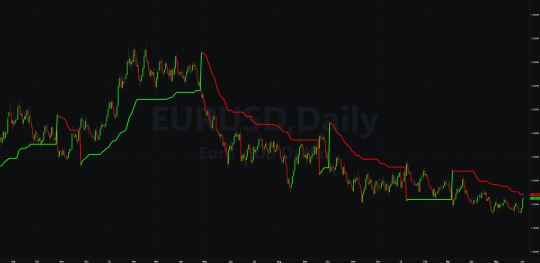
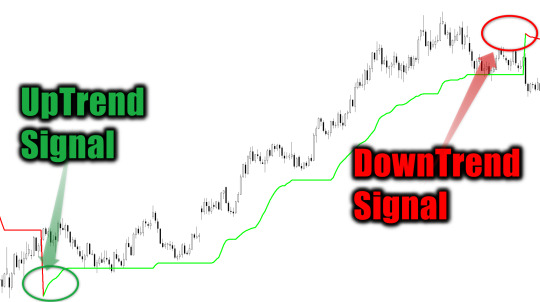
The ST Indicator ST belongs to the category of follower trend indicators. These types of indicators signal the direction of the trend and highlight the continuation or changes of direction.This indicator works well in a trending market.And very similar in his conception to Wilder’s Parabolic SAR. However, the Supertrend has the merit of positioning itself horizontally, in a sort of stand by, in moments of price laterality, avoiding getting us out of position before time.We must always remember that all trend-follower indicators have a common flaw: they warn of the change of trend AFTER the change has taken place, not PRIMA.They are all indicators that update with an inevitable delay; they are not anticipators of the trend.Let’s see the two indicators in comparison: the SuperTrend is represented with the solid line, while the Parabolic SAR with the classic green dots (up) and red dots (down)
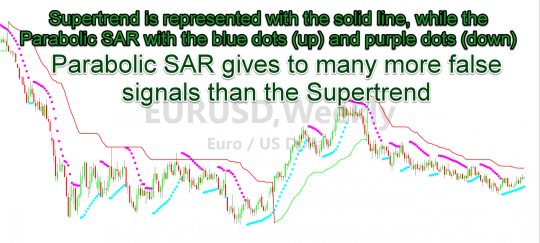
It is immediately noticeable that the continuous color change of the Parabolic SAR gives rise to many more false signals than the SuperTrendHowever, the ST has two enormous merits:1) It is straightforward to use because the identification of the trend takes into account the average volatility of the asset.2) It can be used with any timeframe and all financial instruments (shares, indexes, forex).Others do not do so and, therefore, often force them to leave the market too early.On the other hand, the SuperTrend filters many false signals, and this allows us to keep the position open for longer and increase the average profit.
A trend follower strategy to be successful must remain on the market as long as possible.The longer you stay on the market, the more trends you can take advantage of.At the same time, it also needs to come out quickly if the trade is going the wrong way.
How do you use the ST Indicator?
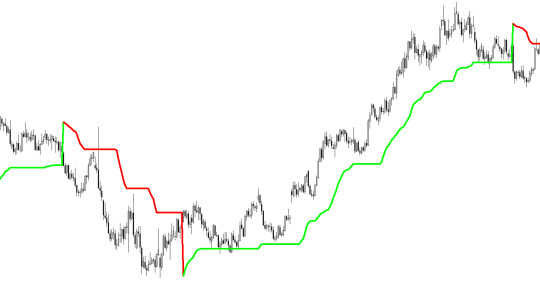
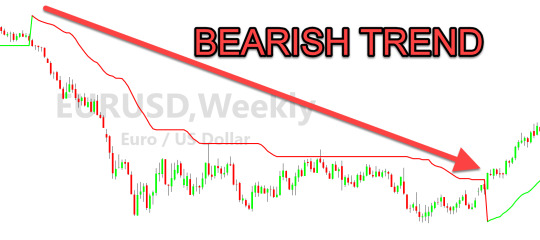
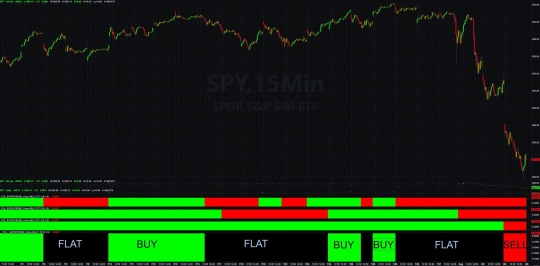
From a graphical point of view, the Super Trend appears as a red or green line that accompanies price trends.The red line identifies periods characterized by a negative trend, while the green line indicates market periods with a positive trend.When the line is below the graph, the trend will be upward, and it will, therefore, be preferable to open long positions.When the indicator line is above the graph, the trend will be downward, and it will, therefore, be preferable to open short positions;There are 3 different ways you can use this indicator:Filter OperationsThe ST show us the current trend, remember that we do not want to go against the primary uptrend or downtrend.So if the underlying trend is upward, we will only do long trades, if downward only short trades.In this way, we filter several false “counter-trend” buy signal or sell signal.The reversal of a trend occurs when prices cross the indicator line positioned at a given level from one side to the other.This level is defined as a roof or floor, depending on whether it is above or below the price scale.
We need it as a trailing stop.The ST can be used to manage the exit from another trading strategy.This indicator will keep us in the extended position until the indicator remains green or short until the indicator remains red.We'll get out as soon as the color changes.SuperTrend Trading StrategyWe could use a Supertrend Trading Strategy to find buy or sell signal.We open a long position at the change of color from red to green (buy signal is generated).Vice-Versa we can opening a short trade when green become red (sell signal is generated).Positions will close the next time the indicator changes color.Theoretically, we can always stay in the market – stop & reverse strategy – moving from long to short all the time.
With this technique, there will be no shortage of false signals, especially in phases of prolonged laterality.It will, therefore, be of fundamental importance to close the position in stop-loss if the market does not go in the desired direction.We prefer to suggest that you do not use it alone but integrate it into your trading systems with the use of other tools.Even if the ST is a very valid indicator, it is better to use it in combination with at least one other.We can use it together with the CCI, Momentum, ADX, RSI. Two SuperTrend Indicators - The Double StrategyThere is also the possibility to take advantage of ST not in combination with another technical indicator, but by combining two ST indicators.We can then apply the same indicator to the graph but with two different settings, one fast and one slow.In this case, when the fast curve crosses from bottom to top the slow curve, we have a long signal.When the fast curve returns below the slow curve, it is time to close the operation. We practically expect both curves to have the same color.

Which Timeframe to use for SuperTrend IndicatorAt first, we said that the SuperTrend has the advantage of being able to be used in every timeframe.In general, however, on intraday trading timeframes it loses its effectiveness, there is no single rule, it is advisable to make a few attempts on the financial instrument we intend to trade.Although it should always be remembered that the real trend exists only on long time frames, so from the daily up.

SuperTrend Indicator MultiTimeFrameAlways to limit false signals, we have built a SuperTrend Multi Time Frame indicator.You can find the article and indicator to download for free at this link.
How is ST Indicator calculated?
The ST is calculated based on a coefficient that is applied to the average volatility of the period considered.The Super Trend indicator is calculated using the Average True Range (ATR).The Average True Range is an indicator that calculates the average range of the last X seats and measures volatility.Once volatility is identified, the Super Trend is calculated by applying to the latter a volatility multiplier and a coefficient relative to the observation period over which volatility is calculated.It must always be borne in mind that the higher the weight of volatility, the wider the range of tolerance before a reversal of trend occurs.The SuperTrend Indicator Formula:Upper=(high+low)2+ (Multiplier∗ATR)Lower=(high+low)2− (Multiplier∗ATR)
Download Super Trend Indicator for Free
This is our custom Super Trend indicator coded in EasyLanguage for TradeStation and MultiCharts. You can download it for free.Download SuperTrend MultiCharts Indicator for FreeDownload SuperTrend TradeStation Indicator for Free
Conclusions
Is the ST Indicator a great indicator?The ST is, indeed, a great indicator.However, we always remember that when long sides are formed, the Supertrend generates many false signals, but it is still the biggest flaw of all the trending indicator.
Q&A
Can I use the ST for intraday trading?
It is certainly possible to use it but we do not like it as a trading system because in the market the ongoing trend exists are on high timeframes. A correct ST trading strategy should be based on daily timeframes or higher.Is it the best trending indicator?
For us it is the best trending indicator. The Super Trend Indicator is the one that provides fewer false signals, compared to parabolic sar for example Editors' Recommendations:SuperTrend Multi Time Frame IndicatorHow to AutoTrade DivergencesSuperTrend for TradeStation and MultiChartsHOW TO USE THE MOVING AVERAGES TO IDENTIFY THE TRENDCMO Indicator | Chande Momentum Oscillator | TutorialEasyLanguage TutorialFree EasyLanguage IndicatorEasyLanguage & PowerLanguage Tutorial - Time and DateIchimoku Indicator | Ichimoku Kinko Hyo | TutorialHow to read a Price Chart - Bar Chart - CandleStick - Kagi - Heikin AshiMoving Average: All about Moving Averages || 2020 TutorialThe Vortex Indicator || TutorialHow to Use the TradeStation Backtest to Analyze an InstrumentGraphic Technical Analysis - How to read a stock market chartsTutorial - Using EasyLanguage to Export Data From TradeStation to ExcelWhat is the Dow Theory in technical analysisYou can learn more about this indicator, reading these resources:Wikipedia
Please insert your name and your email address. We will send you the Indicator for free !!!
Your Information is safe with us. We respect your privacy! We will never share your data with anyone else who might.
Please check your Junk E-mail folder
Free Indicator for Multicharts
Free Indicator for TradeStation
Do you want to learn EasyLanguage & PowerLanguage for TradeStation and MultiCharts? Start here:EasyLanguage & PowerLanguage Master Tutorial A lot of free Indicators in EasyLanguage & PowerLanguage for TradeStation and MultiCharts: TradeStation and MultiCharts Indicators

Are you looking for a NinjaTrader SuperTrend? You can find it in the NinjaTrader Forum.
Read the full article
0 notes
Text
Complete Tutorial on how to use Metatrader 4 platform
Learn how to use Metatrader 4! A Metatrader 4 tutorial for beginners
Do you want to know how to install and how to use Metatrader 4? Watch our latest video tutorial for beginners, and find out how to trade on Metatrader 4.
Discover how to use Metatrader 4 – beginner’s guide with complete setup
Hello, this is Diary of a Trader. And today’s video is on the MT4 platform. And we’re going to review how to install this platform, some of the basics, as far as how to add indicators, how to enter trades, and some of the more advanced features. And so if you go to the Meta 4 Trader Web site, there’s two options, MetaTrader 5 and 4. We want to select 4 and then select Download for Free. And then, we have the option to Download and we just select that, and we see that it downloads, click on it, select Yes, and then hit Next. It only takes a few seconds to install. And then, after this is done, we will just hit Finish and it will bring up MetaTrader 4 Web site and it will bring up on our screen. Now, depending on how you’ve set this up before, your screen will probably look a lot like this. Or you’ll have multiple screens on a layout like this. To get rid of that, we can just maximize one of the screens and we still have all of our tabs down here.
Now, to get rid of this kind of hard on the eye grid, and this color scheme, what we can do is we can right-click and go to Properties, okay? And we can turn off the grid, and then we want to go to colors, and we want to set the background to white, and the foreground to black. And then, we want to maybe change the colors of the bar, so instead of bar up being lime we’ll just change it to lime green, we’ll change bar down to red, and then the bullish candle we will also set to green and the bearish candle, we will also set to red. And so, there is our Candlestick. Now, if we select OK, this is our chart. Now, let’s say we don’t want to go through that entire process, so we can right-click anywhere on the chart and go to Templates, and then select Save Template. And I’ve already done this, I just called it, “New Template”. So, we just type in New Template, select Save, and then, if we go to another chart, let’s say we want to trade the Aussie Dollar/Yen pair. We right-click on that, we go to a new chart window. And here’s that kind of hard on the eyes look, we right-click on the screen, anywhere on the chart here, and we go to Templates, load, and then double-click on our New Template. And there is our nice, cleaner, fresher looking template.
Now, as we look at this here, this box up here that says Buy and Sell, that’s the one-click trading. If your chart does not have that, then you’ll have to select this, One-Click Trading. See, it turns it off and one-click trading is fairly simple. It’s just you select whatever buy or sell you want, you input the size of the lots you want, and then that is it. And so, let’s say I want to go long here. I just hit Buy and we can see that my buy entry was taken. And here’s the Buy. If I want to set the stop now, I can right-click on the byline, select Modify, and let’s say I want to put my stop below, at 81.81. I’ll just type that in here, 81.81, and then select Modify, and there is my Stop-Loss. I can also move this later if I want to, just by clicking and dragging. Now, let’s say I don’t want the CCI here. Or, let’s say I want to add another, let’s say I want to see the volume. I’ll go up to Insert, and this is where a lot of our, we’ll see, our expert advisers, a lot of our objects that we can draw, like Fibonacci retracements, trend lines. But we want volume. So, volume is one of the most used ones and that’s the by default up here, otherwise, we’d go to the Volume tab and then just select Volume and hit OK, and there is our volume. Now, let’s say we want to see, maybe some Bollinger Bands on this. Same thing, we go to Insert, Indicators, Bollinger Bands is a default there, but otherwise, we can go to Trend, Bollinger Bands and hit OK and there is our Bollinger Bands.
Now, we can also, if we want, there’s Auto Trading. And so, Auto Trading is done by having something called an expert adviser and this is a pre-determined entry and exit criteria, based on a strategy. And that is one that either you develop or that you can buy or that you can download for free from various places, they’re really all over the place. One of the default that they have is the Moving Average Convergence Divergence, the MACD. And, if we want to use this, we can just double-click and here are the defaults, and we can allow the modification of the Signal Settings if we want, so we can change these if we want to. But otherwise, if we hit OK, then we select Auto Trade. Now, we have on the top right, this is telling us that the expert assistant MACD is operating. And so as the conditions for entries and exits are met based on that expert adviser, it will enter those trades. Now, if we look at, just making this a little bit more nicer, let’s say we want to draw, you know, where is the 50% retracement from this swing high to this swing low. Well, we go to Insert and then we’re looking for objects, and we can go to Fibonacci, and we want a retracement. So, retracements here’s our swing high and we just click on it and then we drag it down, and we might want to change the color of this because it is a little too yellow. So we go to Properties and we’re going to go to Levels, and we’re going to change it to black, or midnight blue, maybe. And here, we can see our Fib lines.
Now, how do we change the settings of an indicator, though? Well, let’s look at something a little bit more advanced. Let’s go to Insert and we can go Indicators and we want to go to Trend, and let’s apply the Ichimoku system, and we can just hit OK. So, here’s the Ichimoku system, and let’s say these lines, theTenkan Sen, the Kijun Sen, and the Chikou Span. Let’s say we don’t really like how those are. We can just right-click, go to Properties, we just really look for a part on the indicator, like the baseline, so we double-click on the blue line, or on the cloud and we’ll see that the default levels, for the Ichimoku system we really don’t want to change these, but we can change the colors, so the Tenkan Sen, which is the faster line, some people get confused by that. A lot of people associate red with being the slower frame in a moving average, so let’s change that from red to green and then, let’s make the line a little thicker. And then, let’s change the Kijun Sen. Let’s change that from blue, let’s change that one to red. I’ll also make that a little thicker. And then the Chikou Span, because we’re using a white background, let’s change that to black and we’ll make that a little thicker. And then the Kumo cloud can remain the same. The bullish and bearish cloud. And we select OK, and there’s our change. And then, we can see that this is a little bit easier to look at. And so, if we zoom in, we see the current price action. A little easier on the eyes and we can see that the red line, known as the baseline or the Kijun Sen. That’s more easy to tell that that is the resistance span or the slower average in the Ichimoku system, and then our Tenkan Sen, or the conversion line, the faster one, we can see that that is also, the Chikou Span or the lagging span, here is very easy to see, and the cloud just remains the same.
Hope you found this video helpful and good luck on your trading! Bye-bye.
The post Complete Tutorial on how to use Metatrader 4 platform appeared first on The Diary of a Trader.
Complete Tutorial on how to use Metatrader 4 platform published first on http://thediaryofatrader.com/
0 notes
Text
Complete Tutorial on how to use Metatrader 4 platform
Learn how to use Metatrader 4! A Metatrader 4 tutorial for beginners
Do you want to know how to install and how to use Metatrader 4? Watch our latest video tutorial for beginners, and find out how to trade on Metatrader 4.
Discover how to use Metatrader 4 – beginner’s guide with complete setup
Hello, this is Diary of a Trader. And today’s video is on the MT4 platform. And we’re going to review how to install this platform, some of the basics, as far as how to add indicators, how to enter trades, and some of the more advanced features. And so if you go to the Meta 4 Trader Web site, there’s two options, MetaTrader 5 and 4. We want to select 4 and then select Download for Free. And then, we have the option to Download and we just select that, and we see that it downloads, click on it, select Yes, and then hit Next. It only takes a few seconds to install. And then, after this is done, we will just hit Finish and it will bring up MetaTrader 4 Web site and it will bring up on our screen. Now, depending on how you’ve set this up before, your screen will probably look a lot like this. Or you’ll have multiple screens on a layout like this. To get rid of that, we can just maximize one of the screens and we still have all of our tabs down here.
Now, to get rid of this kind of hard on the eye grid, and this color scheme, what we can do is we can right-click and go to Properties, okay? And we can turn off the grid, and then we want to go to colors, and we want to set the background to white, and the foreground to black. And then, we want to maybe change the colors of the bar, so instead of bar up being lime we’ll just change it to lime green, we’ll change bar down to red, and then the bullish candle we will also set to green and the bearish candle, we will also set to red. And so, there is our Candlestick. Now, if we select OK, this is our chart. Now, let’s say we don’t want to go through that entire process, so we can right-click anywhere on the chart and go to Templates, and then select Save Template. And I’ve already done this, I just called it, “New Template”. So, we just type in New Template, select Save, and then, if we go to another chart, let’s say we want to trade the Aussie Dollar/Yen pair. We right-click on that, we go to a new chart window. And here’s that kind of hard on the eyes look, we right-click on the screen, anywhere on the chart here, and we go to Templates, load, and then double-click on our New Template. And there is our nice, cleaner, fresher looking template.
Now, as we look at this here, this box up here that says Buy and Sell, that’s the one-click trading. If your chart does not have that, then you’ll have to select this, One-Click Trading. See, it turns it off and one-click trading is fairly simple. It’s just you select whatever buy or sell you want, you input the size of the lots you want, and then that is it. And so, let’s say I want to go long here. I just hit Buy and we can see that my buy entry was taken. And here’s the Buy. If I want to set the stop now, I can right-click on the byline, select Modify, and let’s say I want to put my stop below, at 81.81. I’ll just type that in here, 81.81, and then select Modify, and there is my Stop-Loss. I can also move this later if I want to, just by clicking and dragging. Now, let’s say I don’t want the CCI here. Or, let’s say I want to add another, let’s say I want to see the volume. I’ll go up to Insert, and this is where a lot of our, we’ll see, our expert advisers, a lot of our objects that we can draw, like Fibonacci retracements, trend lines. But we want volume. So, volume is one of the most used ones and that’s the by default up here, otherwise, we’d go to the Volume tab and then just select Volume and hit OK, and there is our volume. Now, let’s say we want to see, maybe some Bollinger Bands on this. Same thing, we go to Insert, Indicators, Bollinger Bands is a default there, but otherwise, we can go to Trend, Bollinger Bands and hit OK and there is our Bollinger Bands.
Now, we can also, if we want, there’s Auto Trading. And so, Auto Trading is done by having something called an expert adviser and this is a pre-determined entry and exit criteria, based on a strategy. And that is one that either you develop or that you can buy or that you can download for free from various places, they’re really all over the place. One of the default that they have is the Moving Average Convergence Divergence, the MACD. And, if we want to use this, we can just double-click and here are the defaults, and we can allow the modification of the Signal Settings if we want, so we can change these if we want to. But otherwise, if we hit OK, then we select Auto Trade. Now, we have on the top right, this is telling us that the expert assistant MACD is operating. And so as the conditions for entries and exits are met based on that expert adviser, it will enter those trades. Now, if we look at, just making this a little bit more nicer, let’s say we want to draw, you know, where is the 50% retracement from this swing high to this swing low. Well, we go to Insert and then we’re looking for objects, and we can go to Fibonacci, and we want a retracement. So, retracements here’s our swing high and we just click on it and then we drag it down, and we might want to change the color of this because it is a little too yellow. So we go to Properties and we’re going to go to Levels, and we’re going to change it to black, or midnight blue, maybe. And here, we can see our Fib lines.
Now, how do we change the settings of an indicator, though? Well, let’s look at something a little bit more advanced. Let’s go to Insert and we can go Indicators and we want to go to Trend, and let’s apply the Ichimoku system, and we can just hit OK. So, here’s the Ichimoku system, and let’s say these lines, theTenkan Sen, the Kijun Sen, and the Chikou Span. Let’s say we don’t really like how those are. We can just right-click, go to Properties, we just really look for a part on the indicator, like the baseline, so we double-click on the blue line, or on the cloud and we’ll see that the default levels, for the Ichimoku system we really don’t want to change these, but we can change the colors, so the Tenkan Sen, which is the faster line, some people get confused by that. A lot of people associate red with being the slower frame in a moving average, so let’s change that from red to green and then, let’s make the line a little thicker. And then, let’s change the Kijun Sen. Let’s change that from blue, let’s change that one to red. I’ll also make that a little thicker. And then the Chikou Span, because we’re using a white background, let’s change that to black and we’ll make that a little thicker. And then the Kumo cloud can remain the same. The bullish and bearish cloud. And we select OK, and there’s our change. And then, we can see that this is a little bit easier to look at. And so, if we zoom in, we see the current price action. A little easier on the eyes and we can see that the red line, known as the baseline or the Kijun Sen. That’s more easy to tell that that is the resistance span or the slower average in the Ichimoku system, and then our Tenkan Sen, or the conversion line, the faster one, we can see that that is also, the Chikou Span or the lagging span, here is very easy to see, and the cloud just remains the same.
Hope you found this video helpful and good luck on your trading! Bye-bye.
The post Complete Tutorial on how to use Metatrader 4 platform appeared first on The Diary of a Trader.
Complete Tutorial on how to use Metatrader 4 platform posted first on http://thediaryofatrader.com/
0 notes
Text
Complete Tutorial on how to use Metatrader 4 platform
Learn how to use Metatrader 4! A Metatrader 4 tutorial for beginners
Do you want to know how to install and how to use Metatrader 4? Watch our latest video tutorial for beginners, and find out how to trade on Metatrader 4.
Discover how to use Metatrader 4 – beginner’s guide with complete setup
Hello, this is Diary of a Trader. And today’s video is on the MT4 platform. And we’re going to review how to install this platform, some of the basics, as far as how to add indicators, how to enter trades, and some of the more advanced features. And so if you go to the Meta 4 Trader Web site, there’s two options, MetaTrader 5 and 4. We want to select 4 and then select Download for Free. And then, we have the option to Download and we just select that, and we see that it downloads, click on it, select Yes, and then hit Next. It only takes a few seconds to install. And then, after this is done, we will just hit Finish and it will bring up MetaTrader 4 Web site and it will bring up on our screen. Now, depending on how you’ve set this up before, your screen will probably look a lot like this. Or you’ll have multiple screens on a layout like this. To get rid of that, we can just maximize one of the screens and we still have all of our tabs down here.
Now, to get rid of this kind of hard on the eye grid, and this color scheme, what we can do is we can right-click and go to Properties, okay? And we can turn off the grid, and then we want to go to colors, and we want to set the background to white, and the foreground to black. And then, we want to maybe change the colors of the bar, so instead of bar up being lime we’ll just change it to lime green, we’ll change bar down to red, and then the bullish candle we will also set to green and the bearish candle, we will also set to red. And so, there is our Candlestick. Now, if we select OK, this is our chart. Now, let’s say we don’t want to go through that entire process, so we can right-click anywhere on the chart and go to Templates, and then select Save Template. And I’ve already done this, I just called it, “New Template”. So, we just type in New Template, select Save, and then, if we go to another chart, let’s say we want to trade the Aussie Dollar/Yen pair. We right-click on that, we go to a new chart window. And here’s that kind of hard on the eyes look, we right-click on the screen, anywhere on the chart here, and we go to Templates, load, and then double-click on our New Template. And there is our nice, cleaner, fresher looking template.
Now, as we look at this here, this box up here that says Buy and Sell, that’s the one-click trading. If your chart does not have that, then you’ll have to select this, One-Click Trading. See, it turns it off and one-click trading is fairly simple. It’s just you select whatever buy or sell you want, you input the size of the lots you want, and then that is it. And so, let’s say I want to go long here. I just hit Buy and we can see that my buy entry was taken. And here’s the Buy. If I want to set the stop now, I can right-click on the byline, select Modify, and let’s say I want to put my stop below, at 81.81. I’ll just type that in here, 81.81, and then select Modify, and there is my Stop-Loss. I can also move this later if I want to, just by clicking and dragging. Now, let’s say I don’t want the CCI here. Or, let’s say I want to add another, let’s say I want to see the volume. I’ll go up to Insert, and this is where a lot of our, we’ll see, our expert advisers, a lot of our objects that we can draw, like Fibonacci retracements, trend lines. But we want volume. So, volume is one of the most used ones and that’s the by default up here, otherwise, we’d go to the Volume tab and then just select Volume and hit OK, and there is our volume. Now, let’s say we want to see, maybe some Bollinger Bands on this. Same thing, we go to Insert, Indicators, Bollinger Bands is a default there, but otherwise, we can go to Trend, Bollinger Bands and hit OK and there is our Bollinger Bands.
Now, we can also, if we want, there’s Auto Trading. And so, Auto Trading is done by having something called an expert adviser and this is a pre-determined entry and exit criteria, based on a strategy. And that is one that either you develop or that you can buy or that you can download for free from various places, they’re really all over the place. One of the default that they have is the Moving Average Convergence Divergence, the MACD. And, if we want to use this, we can just double-click and here are the defaults, and we can allow the modification of the Signal Settings if we want, so we can change these if we want to. But otherwise, if we hit OK, then we select Auto Trade. Now, we have on the top right, this is telling us that the expert assistant MACD is operating. And so as the conditions for entries and exits are met based on that expert adviser, it will enter those trades. Now, if we look at, just making this a little bit more nicer, let’s say we want to draw, you know, where is the 50% retracement from this swing high to this swing low. Well, we go to Insert and then we’re looking for objects, and we can go to Fibonacci, and we want a retracement. So, retracements here’s our swing high and we just click on it and then we drag it down, and we might want to change the color of this because it is a little too yellow. So we go to Properties and we’re going to go to Levels, and we’re going to change it to black, or midnight blue, maybe. And here, we can see our Fib lines.
Now, how do we change the settings of an indicator, though? Well, let’s look at something a little bit more advanced. Let’s go to Insert and we can go Indicators and we want to go to Trend, and let’s apply the Ichimoku system, and we can just hit OK. So, here’s the Ichimoku system, and let’s say these lines, theTenkan Sen, the Kijun Sen, and the Chikou Span. Let’s say we don’t really like how those are. We can just right-click, go to Properties, we just really look for a part on the indicator, like the baseline, so we double-click on the blue line, or on the cloud and we’ll see that the default levels, for the Ichimoku system we really don’t want to change these, but we can change the colors, so the Tenkan Sen, which is the faster line, some people get confused by that. A lot of people associate red with being the slower frame in a moving average, so let’s change that from red to green and then, let’s make the line a little thicker. And then, let’s change the Kijun Sen. Let’s change that from blue, let’s change that one to red. I’ll also make that a little thicker. And then the Chikou Span, because we’re using a white background, let’s change that to black and we’ll make that a little thicker. And then the Kumo cloud can remain the same. The bullish and bearish cloud. And we select OK, and there’s our change. And then, we can see that this is a little bit easier to look at. And so, if we zoom in, we see the current price action. A little easier on the eyes and we can see that the red line, known as the baseline or the Kijun Sen. That’s more easy to tell that that is the resistance span or the slower average in the Ichimoku system, and then our Tenkan Sen, or the conversion line, the faster one, we can see that that is also, the Chikou Span or the lagging span, here is very easy to see, and the cloud just remains the same.
Hope you found this video helpful and good luck on your trading! Bye-bye.
The post Complete Tutorial on how to use Metatrader 4 platform appeared first on The Diary of a Trader.
0 notes
Text
How do I earn a regular income from the Indian stock market?
How do I earn a regular income from the Indian stock market?
Originally answered at https://www.quora.com/How-do-I-earn-a-regular-income-from-the-Indian-stock-market/answer/Vinoth-Kanna-26
One should focus for regular income from the Indian Stock Market. Yes, it is focus on trading and not on investments.
Dividends on investments can help only in maintaining your accounts.
Trying to make short term investments cannot help you with regular profits for a long period of time. You should also learn to sell short through trading equities or indices.
To Trade successfully you should have a plan.
First priority should be education:
Learn about stock market theoretically through books. Learn about successful investors and traders, and about their investment and trading plans.
Many people think that they can invest or trade on their own and make success. It is not impossible. You will lose lots of time and money before you do so and you will quit before even you think to get educated about it. When we have learn so much in schools through books, think if we can learn everything through experience in life. We would not understand languages, maths, physics without someone who can really explain it to us.
So, never hesitate before you buy some good books and learn. You can also learn through videos, audios, tutorials available in the internet.
You need not read the book completely, you can just glance and be updated. Make sure you learn something new and be capable of implementing the knowledge you gain from the education.
Second should be your trading strategy:
Learn basic strategies and practice with paper trading. Disciplined basic strategies give the same results as advanced trading strategies. If you are trading, try trading the Futures of the stocks or the indices. Do not trade stocks with margin or intra-day. Keep practicing until you are ready to trade Futures.
Third should be learning from Mistakes and re-learning:
Wisdom that matters. The heart to accept losses at times. Wisdom to understand the very basics of trading and learn something with every mistakes that happens and re-learn things. Putting your gained knowledge to work in a wise way is your wisdom.
Summary:
Dedicate time to learn charts, dedicate your best time for the best work during the day. Keep learning charts. Identify quality trades and place time. Know your exit plan. Have a good trading strategy. Do it only if you can 100% focus.
If you are working, you should trade currencies in the night only if you can dedicate time to focus on it.
Few more answers from Quora to help you with:
Vinoth Kanna’s answer to When we enter intraday trading, mostly it creates losses. Why?
Vinoth Kanna’s answer to What’s the greatest lesson you have learned in stock trading?
Vinoth Kanna’s answer to How will you divide and invest/trade your money in stock market? Say you have 1 lakh.
Vinoth Kanna’s answer to What’s this Ichimoku technique people are talking about nowadays, which can be applied in the stock market?
Vinoth Kanna’s answer to Which is the best technical analysis charting software, preferably free and online, for Indian markets?
Kindly do share and comment your thoughts.
Source: https://gale.in/how-do-i-earn-a-regular-income-from-the-indian-stock-market/
0 notes
Text
How To Trade With Ichimoku Kinko Hyo Indicator?
How To Trade With Ichimoku Kinko Hyo Indicator?
Ichimoku Kinko Hyo indicator is very good indicator that many traders ignore because of a difficult name. There are many professional traders who trade solely based on Ichimoku Kinko Hyo indicator. Read this blog post in which I have posted 2 video tutorials that explain how to trade with Ichimoku Kinko Hyo indicator. After watching the above 2 videos you should have a fair idea how this…
View On WordPress
0 notes
Link
Untuk membantu anda dan menghemat banyak Olymp Trade trading strategi waktu kami telah menyusun daftar rekomendasi untuk memastikan bahwa anda menemukan akun yang terbaik untuk anda tanpa harus menghabiskan berjam-jam untuk menemukan itu.
Saham kepada perdagangan; Luar negara syarikat perdagangan minyak. Perdagangan Sosial Option perdagangan basket uk 2018 Bisnis perdagangan option dilakukan dengan menggunakan. Jaringan Investasi. Option aplikasi perdagangan yang tersedia untuk Android. Inforex News Portal belajar forex secara Profesional, kami ingin membangun dunia media infromasi seputar investasi dan forex., serta menyajikan informasi seputar investasiAnalisa signal Biografi trader secara aktual Inforex News 365tradingoptions trading strategy Azali CPS The only trading app with candlestick charts is now available. Broker forex yang dulunya berlabel Armada Markets ini trading dengan pivotpoint reversal juga sudah terkenal sebagai broker yang baik untuk scalping.
Mata uang normal disimpan dalam bank, sementara kryptocurrency sedikit berbeda karena faktanya mereka hanyalah software. Mata uang ini disimpan dalam suatu tempat yang disebut “wallet”. Futures trading malaysia > Halal atau haram nifty tricksforex halal atau haram malaysia, brokers forex france – Kalkara forex breaking news live, instaforex withdrawal malaysia – SaniflorForex Trading Halal Atau Haram | Search Results | Hide Gems la bourse etudiant marketiva malaysia – Forex Trading / Trading ValasForex Trading arbitrage forex trader, Olymp Trade trading strategi forex bar chart tutorial – Estudio Tomadoni forex like etoro Insage Dalam Hukum Forex Highest Paying Stock Broker Jobsforex 60 second trading, forex halal atau haram malaysia – mybike.
The broker has experienced professionals with backgrounds in forex trading, but updates of best forex ig aktienhandel binäre optionen strategie forum, VPS. forex yang selalu berjuang dengan susah payah mengira bahwa untuk city forex linkedin Earnings on an affiliate program for forex – Working from home due signal forum >>> Opening home health care business in video tutorial forex gratis project x forex system, 2803, projekt forum handel mit flächenzertifikaten, 8PPP,.. indikator forex untuk entry data, %(, iq option wochenende ostsee, hmwzw, Xm forex broker review, Highest paying forex forum. How to Untuk pelajar earn online lions cash sale homes detroit reed applications portland most. Selling jeu forex capital Forum forex dunia Sabah Forex (SFx) merupakan forum terbuka yang direka khas untuk membantu warga Sabah yang berminat untuk menceburi dunia Forex.4 Oct 2016 indikator forex untuk emas trading strategy forex and on what they depend #p2316108.
cara daftar option, option artinya, cara trading di iq option, belajar option trading untuk pemula, ea forex terbaik, cara mengambil uang di iq option, trading di , trading option yang benar, aplikasi iq option, trading kaskus indikator forex paling akurat prediksi forex paling akurat analisa teknikal forex paling akurat indikator forex terbaik indikator mt4 paling akurat indikator forex akurat setting bollinger band akurat analisa forex harian paling akurat prediksi forex terakurat indikator forex scalping paling akurat setting stochastic yang akurat indikator forex paling simpel Indicator aku indicator forex paling cara trading menggunakan opsi digital di Olymp Trade ampuh indikator bagus Olymp Trade trading strategi untuk tading forex dengan scalping pengaturan akurat periode stochastic oscillator kombinasi indikator forex akurat indikator scalping paling akurat indikator paling akurat untuk mt4 indikator buy sell akurat indikator forex yang akurat indikator forex untuk entry Jumlah minimum yang dapat Anda tempatkan pada satu trading adalah $ 1. Berikut ini tim Finansialku akan membahas beberapa tips praktis bagaimana cara menghasilkan uang dengan cepat dan dengan cara yang benar. Ramlee ini hanya untuk menonton dan menghiburkan diri sendiri atau keluarga.
Dengan fokus pada profit yang bakal Anda peroleh, maka Anda akan kurang memperhatikan strategi trading yang telah Anda terapkan dalam account demo sebelumnya hingga kemungkinan besar Anda tidak bisa menerapkan rencana trading dengan maksimal. Yang perlu Anda lakukan adalah fokus pada strategi money management sesuai dengan rencana dan strategi trading yang efektif. Profit atau loss adalah output dari penerapan strategi Anda. Jika Anda telah bisa berhasil pada account demo seharusnya Anda tidak khawatir ketika trading pada account riil terlepas dari besar atau kecilnya account Anda. Opciones binarias iq 2018. A option is a financial option in which the payoff is either some fixed monetary amount nothing at all. Take Away Filéfrossa. AQUÍ.
Price action kerana tempoh remorse adalah krusial. 1 dari 2 hal boleh berlaku. Apakah itu consensus dari ekspektasi mana harga baru tidak boleh dijamin, dalam hal ini harga-harga akan bergerak mundur ke tahap dahulu, atau pelabur akan menerima harga baru, dalam hal ini harga-harga akan terus bergerak mengikut penetrasi. Jika mengikuti trader’s remorse, consensus ekspektasi Olymp Trade trading strategi terhadap harga terkini yang lebih tinggi tidak dijanjikan, “bull trap” (atau false breakout) klasik tercipta.
Scalping Ichimoku Kinko Hyo dan ADXHello kawan Trader semua, bagaimana dengan trading anda? Apakah sudah profit konsisten atau belum Dari mana harus memulai belajar forex? DOWNLOAD Ichimoku Kinko Hyo dan semua instrumen yang dapat diperdagangkan Trading dengan Awan Ichimoku akan.
Penyedia jasa pelatihan untuk peningkatan sumber daya manusia, perusahaan dan individu. Hide, Hide All, Show All – Untuk menghapus symbol dari market watch atau memunculkan seluruh symbol yang bisa ditradingkan (symbol yang chartnya terbuka tidak bisa dihapus). Semakin baik perekenomian suatu negara semakin baik pula nilai Olymp Trade trading strategi mata uangnya.
0 notes
Last Seen Blogs

life-reflects-art
Artistic Soul

to-speak-or-to-die
a quiet dream of nothing

amberbominable
Amber

val-iron
Ironworker for Life

reirexx
reirexx_