#Iris PublishersIris Publishers LLCJournal of Nutritionfood and nutrition sciences journalfood and nutrition sciences
Text
Iris publishers-Global Journal of Nutrition & Food Science (GJNFS)
Methanol Leaf Extract of Diospyros Chloroxylon Attenuates Chlorpyrifos-Induced Toxicity in Rats
Authored by Oyewo EB*
Abstract
Background and Objective: Chlorpyrifos [O, O-diethyl-O-(3, 5, 6-trichloro-2-pyridyl)-phosphorothioate] (CPF) is a broad-spectrum Organophosphate insecticide that are used in many farms and homes. Despite the several reported toxicity in humans, there has been virtually no alternative effective insecticide. Thus, the amelioration of the toxicities seems the best option in alternative medicine. This study, therefore, investigated the effects of methanol extract of Diospyros chloroxylon leaf (MEDCL) on the brain and heart of rats exposed to CPF.
Materials and Methods: Twenty-four rats were randomized into four groups of 6 rats each, and treated separately with distilled water (Control), CPF (5 mg/kg), MEDCL (100 mg/kg) and MEDCL (100 mg/kg) + CPF (5 mg/kg), following 7 days of acclimatization. After 4 weeks of treatments, the rats were sacrificed, and the levels of Superoxide dismutase (SOD), Catalase (CAT), Malondialdehyde (MDA), reduced glutathione (GSH), Glutathione peroxidase (GPx), glutathione S-transferase (GST) and DNA fragmentation were spectrophotometrically assessed in the brain and heart, while Acetylcholinesterase (AChE) activities were assessed in the serum and brain of the rats.
Results: The results showed that CPF significantly reduced the levels of SOD, CAT, GSH, GPx and GST, while that of MDA was elevated in brain and heart, compared with controls. Treatment with CPF significantly lowered the activities of AChE in serum and brain by 94% and 48% respectively, while the level of DNA fragmentation was significantly elevated in the CPF-treated rats. Supplementation with MEDCL significantly ameliorated the changes in the rats.
Conclusion: From the foregoing, the suppressive potential of methanol extract of Diospyros chloroxylon leaf is marked indicated in brain and cardiac redox imbalance induced on exposure to Chlorpyrifos.
Keyword: Chlorpyrifos; Diospyros chloroxylon; Oxidative stress; Acetylcholinesterase; DNA fragmentation
Introduction
Chlorpyrifos [O, O-diethyl-O-(3,5,6-trichloro-2-pyridyl)- phosphorothioate] (CPF) is an organophosphate insecticide, acaricide and miticide used in protection of various crops and ornamental plants [1]. Chlorpyrifos becomes introduced into the environment via direct application on crops, lawns, domesticated animals, as well as in homes and workplaces. However, volatilization is the major way in which this organophosphate is dispersed in the environment, after application. In the environment, it becomes decomposed through the sunlight, bacterial and chemical processes [2]. Mackay, et al. [3] has observed the atmospheric formation of Chlorpyrifos oxon from Chlorpyrifos. The hepatic biotransformation of Chlorpyrifos has been reported to involve cytochrome P-450 dependent desulfuration, to form Chlorpyrifos oxon [4,5]. This oxon is rapidly hydrolyzed to 3, 5, 6-trichloro-2-pyridinol (TCP) through the activity of Aryl- esterase. Both bioactivation and detoxification of Chlorpyrifos have been suggested to occur very rapidly, since TCP was detected as the only metabolite in the hepatic effluent under steady-state conditions 4. The TCP has been noted to be, in several orders of magnitude, less toxic than either Chlorpyrifos or its oxon form [6,7].
Some earlier studies by Bakke, et al. [8] and Nolan, et al. [9] had indicated that the hydrolysis of Chlorpyrifos oxon by A-esterase could probably be a common route of detoxification, since TCP or its conjugate is the major metabolite detected in rodents and humans. A kinetic study of the relative rates of deulfuration and detoxification of Chlorpyrifos by Chambers and Chambers [10] suggested a gender-dependence, which may explain its higher toxicity in female rats than male ones. Various mutagenicity studies using Chorpyrifos revealed that it could cause metaphasic chromosomal aberrations in mouse spleen cell culture [11], sister chromatid exchange in human lymphoid cells [12] and induction of micronuclei, chromosomal lesions, and DNA damage in many organisms [13-15]. However, the USEPA [16] reported the nonmutagenicity of Chlorpyrifos in both bacterial and mammalian cells but did noticed slight genetic aberrations in yeast and DNA in bacterial cells. Tumor developments in mammalian organs, such as prostate [17], breast [18,19] and rectum [20] have been reported to be caused by Chlorpyrifos exposure.
The hepatic cytochrome P-450 dependent metabolism of testosterone and estradiol has been noticed to be inhibited Chlorpyrifos exposure [21,22]. Furthermore, this organophosphate insecticide has been reported to cause decrease in testicular testosterone biosynthesis, and low productions of major steroidogenic enzymes, steroidogenic acute regulatory (StAR) protein and luteinizing hormone receptor stimulated cAMP as investigated by Viswanath, et al. [23].
Diospyros choloroxylon is a widely distributed shrub, belonging to the Diospyros species of the family, Ebenaceae [24]. This shrub and some other members of the species have been used in orthodox medicine all over the world in treatments of several ailments and diseases [25-27]. Studies have shown a possible link between the medicinal potential of D. chloroxylon and the presence of secondary metabolites, such as, alkaloids, flavonoids, tannins, saponins, triterpenoids and phenolics [28]. An important triterpenoid, betulinc acid, present in Diospyros species [29], has been reported to possess several biological properties [30-35]. In the recent time, methanol extract of D. chloroxylon leaf has been reported potent against some environmental toxicants [36,37]. In the present study, the hypothesis was that methanol extract of Diospyros chloroxylon leaf could attenuate redox-induced injuries in the brain and heart of rats exposed to Chlorpyrifos.
Materials and Methods
Duration and place of study
Both experimental work and data analysis were carried out between the months of February and June 2018, in the Department of Biochemistry, Ladoke Akintola University of Technology, Ogbomoso, Oyo State, Nigeria.
Chemicals
Glutathione, Epinephrine, 5, 5 dithiobis-(2-nitrobenzoate) (DTNB) and hydrogen peroxide were purchased from the Sigma chemical Co. Saint Louis, MO, USA. Trichloroacetic acid, 2-thiobarbituric acid, Triton X-100 and Diphenylamine were purchased from the British Drug House (BDH) Chemical td, Poole, U.K. All other reagents were of good analytical grades.
Collection and extraction of Plant material
The leaves of Diospyros chloroxylon were bought in February 2018, from a local herb seller in Ogbomoso, and authenticated at the Department of Biology, Botany Unit, Ladoke Akintola University of Technology, Ogbomoso, Oyo State, Nigeria. The leaves were washed with distilled water, air-dried, and pulverized with an electrical grinder. The leaf powder was soaked in methanol for 72 hours. The extraction was repeated twice, and the extract was collected, filtered, and concentrated under vacuum using rotary evaporator at 45oC. The resulting crude extract was stored under refrigeration at 4oC.
Experimental animals and design
Twenty-four (24) male Wistar rats (140.09±9.61 g) were bought from the Animal house of the Institute for Advanced Medical Research and Training (IAMRAT), University of Ibadan, Nigeria. The rats were later brought to the Animal house of the Department of Biochemistry, Ladoke Akintola University of Technology, Ogbomoso, Oyo State, Nigeria. They were randomized into four (4) groups (6 rats each) and housed in plastic cages and fed on rat pellets and drinking water (ad libitum) for 7 days of acclimatization, under 12-h light/dark cycle and temperature of 29±2oC. The 4 groups of rats were separately treated as follows: distilled water (Control), CPF (5 mg/kg), methanol extract of D. chloroxylon leaf (MEDCL) (100 mg/kg), and CPF (5 mg/kg) + MEDCL (100mg/kg). CPF and MEDCL were administered twice per week and every other day, respectively for 4 weeks.
Collection of blood and organs
After 4 weeks, the rats were fasted overnight. Blood was collected into non-heparinized bottles by ocular bleeding and animals were sacrificed by cervical dislocation. Blood was allowed to clot and then centrifuged at 3000xg for 10 minutes to obtain serum. Brain and heart were excised, washed in ice-cold 1.15% potassium chloride solution to remove blood stains. Each organ was divided into 2 portions, one portion was homogenized with phosphate buffer (pH 7.4) using a Teflon homogenizer and centrifuged using a high speed refrigerated centrifuge (HITACHI) at 10,000xg for 10 minutes to obtain homogenate used for antioxidant and Acetylcholinesterase assays. The other portion of organs was kept for DNA fragmentation assay.
Biochemical assays
Determination of protein level: Protein levels of brain, heart and serum were determined as described by Lowry, et al. [38] using Bovine serum albumin as the standard.
Determination of malondialdehyde level: Malondialdehyde (MDA) levels of brain and heart were estimated as described by Ohkawa, et al. [39]. The absorbance of the clear pink supernatant was measured spectrophotometrically against a reference blank at 532 nm. The MDA concentration was calculated using a molar extinction coefficient (Ɛ) of 1.56 x 10⁵ M-1cm-1.
Determination of superoxide dismutase activity: Superoxide dismutase activities of brain and heart were measured by the epinephrine method described by Misra and Fridovich [40]. The increase in absorbance of the assay reaction at 480 nm was monitored spectrophotometrically at 30 seconds intervals for 150 seconds. The specific activity of SOD was expressed in units/mg protein.
Determination of catalase activity: Catalase activities of brain and heart were assayed according to the method of Aebi [41]. The method is based on the ability of catalase to promote decomposition of hydrogen peroxide in a reaction mixture. The change in absorbance 240 nm was monitored spectrophotometrically at 60 seconds intervals for 180 seconds. Catalase activity was expressed as units/mg protein.
Determination of glutathione peroxidase activity: Glutathione peroxidase (GPx) activities of brain and heart were determined using the method described by Andersen, et al. [42]. The assay is based on the reaction of organic peroxide in a reaction mixture and oxidation of reduced glutathione (GSH) to form disulfide glutathione (GSSG). The GSSG is later reduced to GSH by glutathione reductase and NADPH. The decrease in absorbance at 412 nm is directly proportional to the GPx activity, which is expressed in μmol/mg protein/min.
Determination of reduced glutathione level: Reduced Glutathione (GSH) levels of brain and heart were determined using the method of Mitchell, et al. [43]. The assay is based on the oxidation of GSH by sulfhydryl reagent DTNB, to form a yellow derivative, 51-thio-2-nitrobenzoic acid, with an absorbance at 412 nm. GSH level is proportional to absorbance at 412 nm. Values were expressed as U/ mg protein.
Determination of glutathione-s-transferase activity: Glutathione-S-transferase (GST) activities of brain and heart were assayed according to the method of Habig, et al. [44]. The method is based on the ability of GST to catalyse the conjugation of L-glutathione and CDNB to form a conjugate, GS-DNB, with an absorbance at 340 nm. The rate of increase in absorbance at 340 nm is directly proportional to GST activity. Specific activities were expressed as μM/mg protein/min.
Determination of acetylcholinesterase activity: Acetylcholinesterase (AChE) activities of serum and brain were determined using the method described by Ellman, et al. [45], with acetylthiocholine iodide as a substrate. In this method AChE hydrolyzes acetylthiocholine iodide into thiocholine and butyric acid. The thiocholine reacts with 5, 5-dithiobis-2- nitrobenzoic acid (DTNB) to form 5-thio-2-nitrobenzoic acid to form a yellow product whose absorbance is measured spectrophotometrically at 412 nm.
Determination of DNA fragmentation level: Finally, a spectrophotometric method described by Wu et al.46 was used to determine the percentage fragmented DNA. Briefly, the brain and heart were homogenized in Tris-HCl-EDTA (lysis) buffer and centrifuged at 27,000 x g for 10 mins to separate the intact DNA (pellet) from the fragmented DNA (supernatant). Both the pellet and supernatant were treated with freshly prepared DPA reagent for colour development. The mixtures were incubated at 370C for 20-24 hours. The absorbance was read spectrophotometrically at 620 nm. The percentage fragmented DNA was calculated using the formula:
Statistical Analysis
All values were expressed as the mean±standard deviation of six rats per group. Data were analysed using the Graph Pad Prism 6.0 package. Level of significance among the groups was evaluated using one-way analysis of variance (ANOVA) followed by Tukey multiple comparison test. P values of < 0.05 were considered significant.
Results
Effect of MEDCL on body weight of CPF-exposed rats
The effects of Chlorpyrifos (CPF) on the body weights of the rats are presented in Table 1. Treatment with CPF significantly (p<0.05) reduced the body weight gain (in grammes) of the rats (10.26±1.9) relative to the control (35.97±2.7). In the MEDCL-supplemented rats, the weight gain was significantly increased (27.20±2.6 g) compared with the CPF-treated group.
Effects of MEDCL on oxidant parameters of CPF-exposed rats
The data in Table 2 show that CPF significantly (p < 0.05) reduced the activity of SOD (2.30±1.3 and 1.85±0.6 U/mg protein) versus control (5.14±1.2 and 3.54±1.0) in both brain and heart, respectively. Furthermore, the catalase activities were reduced (3.91±1.2 and 3.38±1.0 U/mg protein) versus control (6.88±1.5 and 3.93±0.4 U/mg protein) in brain and heart, respectively. Interestingly, supplementation with MEDCL significantly elevated the activities of SOD (4.68±1.6 and 3.14±0.6 U/mg protein) and Catalase (7.13±0.8 and 4.13±0.4 U/mg protein) in brain and heart, respectively relative to the CPF group.
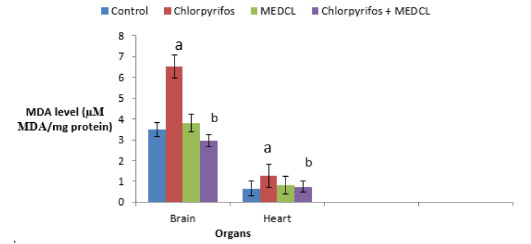
The present study also examined the effects of the treatments on levels of lipid peroxidation (MDA) and reduced glutathione (GSH), as well as the activities of glutathione peroxidase (GPx) and glutathione S-transferase (GST) in the rats. Treatment with CPF caused the level of MDA to significantly (p<0.05) increase (6.51±1.0 and 1.25±0.3 μM MDA/ mg protein) in the brain and heart, respectively compared with control treatment (3.48±0.4 and 0.66±0.1 μM MDA/ mg protein). On supplementation with MEDCL, significantly lower levels of MDA were found as 2.95±0.7 and 0.75±0.2 μM MDA/ mg protein) in brain and heart, respectively compared with the CPF-treated rats (Figure 1).
The level of GSH was significantly (p<0.05) reduced by CPF administration in both brain (11.62±03 U/mg protein) and heart (9.74±10U/mg protein) as against the controls (18.77±14 and 15.56±12 U/mg protein), respectively. When MEDCL was administered, the levels were elevated, and found to be 17.51±3.2 and 15.91±1.8 U/mg protein, in brain and heart, respectively compared with the CPF group, as shown in (Figure 2).
Table 3 presents the results on GPx and GST activities during the treatments. Chlorpyrifos was observed to significantly (p < 0.05) reduce GPx activity in brain (6.74±1.0 U/mg protein) and heart (2.13±0.5 U/mg protein) relative to the respective controls (8.47±2.1 and 3.48±1.2 U/mg protein). However, supplementation with MEDCL significantly attenuated the CPF- induced effects in the two organs, as shown in Table 3. Furthermore, CPF was found to significantly (p < 0.05) reduce GST activities in the brain (2.75± 0.8μM/mg protein) and heart (1.13±0.2μM/mg protein) compared with the control rats (5.04±1.2 and 2.48±0.9μM/mg protein, respectively) as shown in table 3. On supplementation with MEDCL, the activities were found to be 4.05±1.4 and 2.98±0.8 μM/ mg protein in the respective organs compared with the CPF-treated rats.
Effects of MEDCL on Acetylcholinesterase activity and DNA fragmentation in CPF-exposed rats
The result in Figure 3 shows that CPF treatment caused the AChE activities to significantly (p < 0.05) decrease in brain (0.11±0.0 U/ml) and heart (0.18±0.1 U/ml), when compared with the control treatment (0.19±0.1 and 0.25±0.0 U/ml). When supplemented with MEDCL, the activities of AChE enzyme were observed to be 0.21± 0.1 U/ml (brain) and 0.24±0.0 U/ml (heart) in the experimental rats. The result of the effect of CPF on the percentage of DNA fragmentation in the two organs has been presented in (Figure 4).
Treatment with CPF significantly (p<0.05) elevated the level of fragmented DNA in brain (49.51±2.4 %) and heart (64.78±5.3 %), compared with the controls (28.47±3.1 and 32.50±3.8 %, respectively). Interestingly, supplementation with MEDCL significantly attenuated the CPF-induced DNA damage in brain (30.90±3.2 %) and heart (44.20±5.1 %) in the rats.
Discussion
The major findings in the present study include induction of oxidative stress, DNA damage and inhibition of Acetylcholinesterase activity in rats exposed to Chlorpyrifos. Interestingly, these adverse changes were attenuated on treatment of the experimental rats with methanol extract of Diospyros chloroxylon leaf (MEDCL).
The rats exposed to CPF were noticed with a significant reduction in body weight gain, while on supplementation with the extract, the effect was improved comparable to the control animals. Studies conducted by Perera, et al. [47] and Whyatt, et al. [48] found a correlation between CPF intoxication and reduced birth weight and body length. This reduction may be a result of loss of appetite, malabsorption, and digestive disorder, as reported by Neuget, et al. [49].
Oxidative stress results from the imbalance between the reactive oxygen species (ROS) and antioxidant defence system of the cells, causing oxidation of DNA, protein, or lipid molecules. The damage, in turn, may result in several events, such as, altered gene expression [50], enhanced cell proliferation [51], genomic or chromosome instability, genetic mutation or tumour development [52,53].
The data from this study showed that SOD and catalase activities were significantly reduced in both brain and heart on exposure of the rats to CPF. Malondialdehyde (MDA) is a reactive aldehyde formed because of the reaction of ROS with polyunsaturated fatty acids [54]. The elevated level of MDA indicates an induction of lipid peroxidation, hence oxidative damage in the organs of the CPFtreated animals. The toxicant also significantly reduced the levels of GSH, GPx and GST in the two organs of the animals compared with the controls. In several tissues, including brain, liver, and testis, CPF has been demonstrated to cause increase in lipid peroxidation (MDA level) [55, 56] and decrease in catalase, SOD, GPx and GST [57-60]. According to Bebe and Panemangalore [61], low doses of CPF were demonstrated to cause decrease in GSH and increase in GPx, although the level of GSH was found to increase during treatment with higher CPF doses.
Catalase is an endogenous antioxidant enzyme capable of removing ROS via conversion of hydrogen peroxide to water and oxygen [62], while GPx are a group of seleno-proteins involved in cellular protection against oxidative damage induced by hydrogen peroxide and organic peroxides [63]. Reduced glutathione (GSH), on the other hand, serves as a substrate for glutathione peroxidase (GPX) during detoxification, by being oxidized to GSH disulfide (GSSG). The GSSG is converted back to which is converted back to GSH through the activity of glutathione reductase (GPR) [64]. Decrease in level of GSH has been associated with low availability of cysteine molecules required for GSH production, which in turn has resulted from defect in transulfuration characteristic of liver damage [64].
Glutathione-S-transferases (GSTs) belong to a major group of phase II detoxification enzymes, responsible for the conjugation of several endogenous and exogenous reactive electrophiles with GSH [65]. Inhibition of GST activity has been suggested by Binkova, et al. [66] as a mechanism of potentiating the toxicity of environmental chemicals, resulting in increased interactions between them (or their metabolites) and cellular macromolecules. In rats and mouse, CPF is bioactivated in the liver, through cytochrome-p450-dependent pathway, to form CPF-oxon [67,68], which is a more toxic metabolite. The observed reduction in the activities of the antioxidant enzymes in the present study may thus indicate the inhibitory influence of CPF-oxon, which has therefore enhanced accumulation of ROS, leading to oxidative imbalance in the two organs of the rats. This finding is supported by a study carried out by Ventura, et al. [19], who reported that Chlorpyrifos caused increase in the level of ROS in certain breast cancer cell lines. Furthermore, CPF has been demonstrated to induce oxidative stress in rat testes, leading to reductions in sperm count, systemic testosterone, gonadotropin levels and activities of enzymes catalysing spermatogenesis [69]. In the group of animals supplemented with MEDCL, the activities of the antioxidant enzymes were significantly improved, while the level of MDA was reduced relative to the toxicant group. In a recent study, betulinic acid, a triterpenoid reported to be present in Diospyros species [29], has been demonstrated to improve the activities of SOD, Catalase, GPx and GST, as well as the level of MDA in experimental rats treated with an environmental toxicant34. This thus suggests the potential of the Diospyros chloroxylon leaf extract used in this study to ameliorate the imbalance in antioxidant status of the rats.
The present study also examined the effects of CPF on the Acetylcholinesterase (AChE) activities in the brain and serum of the experimental animals. Significantly decreased activities of the enzyme were observed in rats treated with CPF relative to control rats. In several studies, CPF treatment was shown to cause neurological effects such as, sensory loss, memory impairment and depression in AChE activities in many animal species [70-72]. In a study by Cutler, et al. [73], it has been shown that CPF itself is not a potent inhibitor of AChE, but its metabolite, CPF-oxon. This metabolite phosphorylates the serine hydroxyl group at the active site of AChE enzyme, through a nucleophilic interaction, resulting in accumulation of acetylcholine, with subsequent neurotransmission disruption and death [74]. Some other studies have revealed that in the earliest stage of brain and central nervous system development, CPF mitigated neural formation, and caused reduction in the cholinergic projections [75]. This resulted in reduced neural connections, cell signalling capacity, and eventual deficiency in cholinergic synaptic response with behavioural problems in adolescence and adulthood [76]. However, CPF has been demonstrated to preferentially exert toxicity in brain glial cells, which are formed later than the neuronal cells [77,78]. Furthermore, this toxicant exerted adverse effects on the proliferation, differentiation and functioning of glial cells, as well as the cells involved in the neuronal metabolism and targeting within the CNS in rats, during prenatal and postnatal exposures [19,79]. In addition, Sandoval et al [80] have reported that CPF could induce generation of astroglial cells, using human neural stem cells (hNSCs) line, without affecting neuron formation. However, this study has demonstrated that supplementation with MEDCL against CPF treatment improved the activity of AChE enzyme in both brain and serum of the rats, indicating the potential of the extract in improving cholinergic transmission in the rats.
The genotoxic effect of CPF in the brain and heart of the rats was also examined by determining the level of DNA fragmentation as described by Wu, et al. [46]. The treatment with CPF caused a significant increase in DNA fragmentation compared with the controls. Interestingly, the ability of MEDCL to lower the amount of fragmented DNA against CPF treatment was observed. Various forms of genotoxic effect of CPF have been reported, including bone marrow micronuclei induction and DNA hypomethylation in mouse [15], chromosomal alterations, chromosomal breaks, and sister chromatid exchange in humans [81], and micronuclei induction and chromosomal lesions in erythrocytes [82]. The reduction in the level of DNA fragmentation by MEDCL, as observed in this study shows the potential of the extract to protect the organs from the DNA damaging effect of CPF. The overall findings have implied the potential of methanol extract of Diospyros chloroxylon leaf in ameliorating the toxic effects of chlorpyrifos in experimental rats. The study thus clearly shows the possible application of Diospyros chloroxylon leaf extract in the discovery of drugs against toxicity induced by environmental agents. It could therefore be recommended that Pharmaceutical Scientists could isolate, and work on, the active ingredients of Diospyros chloroxylon leaf, for the purpose of making a drug potent against oxidative and degenerative diseases. However, this study has some limitations in that only methanol was used for extraction, and the various compounds in the MEDCL were not elucidated.
Conclusion
The data from this study have shown that Chlorpyrifos (CPF) induced significant oxidative, neurotoxic and genotoxic damage in brain and heart of experimental rats. However, methanol extract of Diospyros chloroxylon leaf ameliorated the CPF-induced redox imbalance in the two organs of rats. Furthermore, the extract of Diospyros chloroxylon leaf exerted attenuation against the neurotoxic and DNA-damaging effects induced by chlorpyrifos in the experimental rats.
Significance Statement
This study discovered the potential of Diospyros chloroxylon leaf extract, which could be beneficial for treatments of oxidative and degenerative diseases induced by chlorpyrifos. This study will assist researchers towards the use of Diospyros chloroxylon leaf for drug discovery, which has not been previously explored. As a result, a new theory on treatments of oxidative and degenerative diseases, using Diospyros chloroxylon leaf may be put forth, in addition to the existing data on medicinal values of plants.
List of Abbreviations
CPF: Chlorpyrifos, MEDCL: Methanol extract of Diospyros chloroxylon leaf, SOD: Superoxide dismutase, CAT: Catalase, MDA: Malon-di-aldehyde, GSH: Reduced Glutathione, Gpx: Glutathione peroxidase, GST: Glutathione S-Transferase, AChE: Acetylcholinesterase, ROS: Reactive Oxygen Species
Ethical Approval and Consent to Participate
This study was carried out in accordance with ethical laws on animal handling.
Availability of Data and Materials
The dataset supporting the conclusions of this article are included as tables and figures in the within the article (and its additional files).
Authors Contributions
AGE conceived, designed and supervised the study. AOT cosupervised the study and read the final manuscript. AOO, AOE and BW provided the materials used in the study, collated literatures and performed the experimental procedures. EBO did the statistical analyses and drafted the manuscript. All authors financed of the study. All authors read and approved the final manuscript with the order of author’s names.
To read more about this article: https://irispublishers.com/gjnfs/fulltext/methanol-leaf-extract-of-diospyros-chloroxylon-attenuates-chlorpyrifos-induced-toxicity-in-rats.ID.000565.php
For more Open Access Journals in Iris publishers please click on: https://irispublishers.com/pdf/peer-review-process-iris-publishers.pdf
0 notes
Text
Iris publishers-Global Journal of Nutrition & Food Science (GJNFS)
Contamination Status of Polycyclic Aromatic Hydrocarbons (PAH s) In Atmospheric Particulate Matter PM2.5 Samples of a Semi-Residential Area of Dhaka, Bangladesh
Authored by YN Jolly*
Abstract
This study deals with the determination of the polycyclic aromatic hydrocarbons (PAHs) in the atmospheric particulate matters (PM2.5) at a semi residential site of Gazipur, Dhaka, Bangladesh. Source identification and possible human health impact of polycyclic aromatic hydrocarbon was evaluated as well. A total of 20 samples were collected in six weeks period of time. Polycyclic Aromatic Hydrocarbons (PAH’s) were determined using gas chromatography-mass spectrometry. The average concentration of Anthracene, Phenanthrene, Pyrene, Chrysene, Benzo (a) anthracene, Benzo(a)pyrene, perylene were found to be 0.309, 0.159, 0.227, 2.120, 1.954, 2.269 and 3.373μgm-3 respectively. Two-way ANOVA test revealed that the concentration of different PAHs species (Fcal> Fcrit) are significantly different from each other at a 95% confidence level. The main contributory sources for PAHs were found gasoline exhaust, diesel exhaust, wood burning and brick kilns. The result revealed that these compounds are present in a higher level in the atmosphere when compared with the value of other countries in the world. Concentration of highly carcinogenic Benzo(a) pyrene was in a range where carcinogenic effect is an immediate threat in case of long-time exposure and hence regular monitoring is suggested.
Keyword: Polycyclic Aromatic Hydrocarbon; Air-Metrics Mini-Vol Samplers; Gas Chromatography-Mass Spectrometry; Quartz Filters
Introduction
Polycyclic aromatic hydrocarbons (PAHs) are organic compounds consist of two or more fused benzene rings in a linear or cluster arrangement, typically found as a complex mixtures [1]. They are very stable organic pollutants that are made up of only carbon and hydrogen and occur naturally but, they can be synthesized as individual compounds for research purposes. Furthermore, they have high boiling and melting points with high molec ular weights and are able to survive at high temperatures from the combustion of fuel from automobiles and airplanes engines and most of them have low water solubility [2]. Polycyclic aromatic hydrocarbons (PAHs) are considered ubiquitous in the environment and can be formed from either natural or manmade combustion sources [3]. The dominant sources of PAHs in the environment are thus from human activity: wood-burning and combustion of other bio-fuels etc., and wildfires are another notable source. Dungor crop residues contribute more than half of annual global PAHs emissions, particularly due to bio fuel use in India and China (Anita and Maharaj,2004), industrial processes and the extraction and use of fossil fuels made up slightly more than one quarter of global PAHs emissions, dominating outputs in industrial countries such as the United States. Lower-temperature combustion, such as tobacco smoking tends to generate low molecular weight PAHs, whereas high-temperature industrial processes typically generate PAHs with higher molecular weights [4].
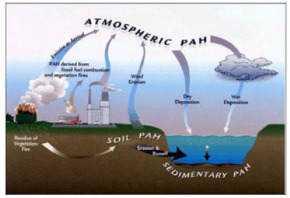
Atmospheric PAHs are distributed (Figure 1) between the gas and particulate phases depending on their physicochemical properties. They can be transported through the atmosphere over long distances. Polycyclic Aromatic hydrocarbons are emitted into the atmosphere either as vapors or associated with primary aerosol particles. Once enters in the atmosphere, the residence times and ultimate fates of these semi volatile chemicals depend upon their distributions among vapor, particle, and droplet phases. The atmospheric chemical and photochemical reactions of PAHs are of great importance because the decomposition product of the PAHs may be more hazardous to human health than the PAHs from which they were derived [5]. A number of experimental studies have demonstrated that many PAHs are susceptible to photochemical and/or chemical oxidation under simulated atmospheric conditions [6]. Nitro PAHs are emitted as a result of incomplete combustion processes.
PAHs have been linked to different cancers in well-established animal model studies [7]. The structure of a PAH influences whether and how the individual compound is carcinogenic [8]. Some carcinogenic PAHs are genotoxic and induce mutations that initiate cancer; others are not genotoxic and instead affect cancer promotion or progression [9] and hence continued research regarding the mutagenic and carcinogenic effects from chronic exposure to PAHs and metabolites is needed. Other than carcinogenic, adult exposure to PAHs has been linked to cardiovascular disease as well [10]. PAHs are among the complex suite of contaminants in tobacco smoke and particulate air pollution and may contribute to cardiovascular disease resulting from such exposures [11]. laboratory experiments, animals exposed to certain PAHs have shown increased development of plaques (atherogenesis) within arteries [12]. Oxidative stress following PAH exposure could also result in cardiovascular disease by causing inflammation, which has been recognized as an important factor in the development of atherosclerosis and cardiovascular disease [13,14]. Biomarkers of exposure to PAHs in humans have been associated with inflammatory biomarkers that are recognized as important predictors of cardiovascular disease, suggesting that oxidative stress resulting from exposure to PAHs may be a mechanism of cardiovascular disease in humans [15]. Multiple epidemiological studies of people living in Europe, the United States, and China have linked in uterus exposure to PAHs, through air pollution or parental occupational exposure, with poor fetal growth, reduced immune function, and poorer neurological development, including lower IQ.
As PAHs are known to have carcinogenic, mutagenic and teratogenic properties, their persistence in the environment have been placed them on the list of priority pollutants by the United States Environmental Protection Agency (US-EPA) and also the European Environment Agency [16]. People from all over the world are concerned more about the air pollution aspects due to the increased rate of mortality and morbidity and also multifarious effects of particulate pollution and we are not out of it. In this regard it is imperative to have a systematic study ascertaining the facts concerning the nature, sources, and trends of the particulate pollution in our beloved city, Dhaka, Bangladesh.
Gazipur area of Dhaka, Bangladesh is known to have moderately dense in population with high traffic and other industrial establishments like garments factories etc. There are several brick kilns in and around the area; more over there is a very busy rail station. Different types of industrial and regular activities are there responsible to contribute a lot carcinogenic aromatic polycyclic hydro carbons in the air of that area that ultimately affects local habitants as well as the visitors. Present study therefore sketched to determine the polycyclic aromatic hydrocarbon concentration in the atmospheric particulate matters collected from Gazipur, Dhaka, Bangladesh, identification of possible sources and human health impact. The main objectives are therefore:
• Determination of the polycyclic aromatic hydro-carbons concentration in the atmospheric particulate matters of Gazipur air
• Identification of the source of the polycyclic aromatic hydrocarbon in the atmosphere.
• Understanding the possible human health impact of polycyclic aromatic hydrocarbon.
Materials and Methods
Sampling site
Air samples were collected from Gazipur area of Dhaka, Bangladesh, which is a residential area of moderate population density. The sampling location is within 20 m from a local road and about 200m from a secondary roadwith moderate traffic density. The highway of Joydeb puris a very busy traffic point, which is about 5 km west to the studied site. Joydebpur rail station, through which daily 60 trains pass away, is about 100m away from the sampling location. At “Konabari” and “Kodda” which are about 5 to 7 km to the north-west of the sampling site, more than 100 brick kilns are there in production using kindle wood. There are also many garments and other industrial units at 4 to 7 km distance from this site (Figure 2).
Samples collection and preparation
PM2.5 (particulate matter) sampling was started from 13 January 2014 by Air-Metrics Mini-Vol samplers at Joydebpur (Gazipur), Dhaka, Bangladesh. And the samplers were placed on the flat roof of the continuous air monitoring station (CAMS-4) site of Clean Air and Sustainable Environment (CASE) project, Gazipur city corporation central symmetry, at 20 feet height from the ground level. The amount of air passed was maintained at 7.2m3.PM2.5 was collected simultaneously for every 24 hours (from 10 a.m. to 10 a.m. of the next day) at the sampling site. The pre-weighted conditioned clean filters (quartz) were loaded to respective filter holder assembly at the conditioning room of CAMS. After sampling, filter holder assemblies (keeping the exposed filters inside) were brought to the conditioning room of the Atomic Energy Centre (AEC), Dhaka, directly from the sampling site for conditioning and PM filter retrieval. Special care was taken in transporting the exposed filter holder assemblies, so that there should be no PM loss.PM2.5 masses were measured in the Atmospheric and Environmental Chemistry Laboratory of Chemistry Division of the Atomic Energy Centre (AECD), Dhaka and preserved under 4°C temperatures. The aerosol sample having PM2.5 was determined by weighing filter before and after exposure using a micro balance. The difference in weights for each filter was calculated and the mass of each PM2.5 sample thus determined.
Extraction of Samples
The particulate PAHs containing sample was weighed and taken into the volumetric flask, then about 30 ml dichloromethane (DCM solvent solution) was added to dissolve the PAHs, kept for 24 hours then sonicated. After sanitations the extract was filtered through what man filter paper and collected in a clean volumetric flask. Special attention was given to avoid loss of extract. Silica clean up column was prepared and the samples were passed through the column and collected. The total solution was concentrated using liquid nitrogen gas to 1-2 ml and transferred into a GC vial for analysis.
Preparation of standard PAHs solution
A known amount of PAHs was dissolved in definite amount of solvent (dichloromethane) to prepare 5 ppm PAHs standard solution of Phenanthrene, Anthracene, Pyrene, Chrysene, 1.2-benzanthracene, Perylene, Benzo-a-pyrene, marked with individual identification number and was stored in the refrigerator. The quantitative determination of PAHs has been done by external calibration curve method. The calibration curve of each compound is prepared with known concentrations of the compound prepared and run through GC-MS. Standard curve for each compound is generated by plotting the area vs. the concentration range for corresponding samples. Over this concentration range, the linear regression analysis of peak areas (y) in function of concentration (x), calculated by least square method. Calibration curve for each compound is presented in (Figure 3).
Chromatogram of a standard PAHs solution
The GC column temperature program employed was 400C to 2800C, started from 400C with holding time 1 min and then raised to 1600C at 100C min-1 ramping and finally the temperature raised to 2800C at 150C min-1 ramping. The injector and detector temperature were 2500C and 2800C respectively. The difference in the chemical properties between different molecules in a mixture and their relative affinity for the stationary phase of the column will promote separation of the molecules as the sample travels the length of the column. The molecules are retained by the column and then elute come off from the column at different time (called the retention time), and this allows the mass spectrometer downstream to capture, ionize, accelerate, deflect, and detect the ionized molecules separately. The mass spectrometer does this by breaking each molecule into ionized fragments and detecting these fragments using their mass-to-charge ratio. So, the components have been separated and detected through their retention time and quantified the area through their charge to mass ratio. The retention time of standard solution is 21.59, 21.75, 25.79, 29.40, 29.51, 33.23 and 33.45 min for Phenanthrene, Anthracene, Pyrene, Chrysene, Benz[a]anthracene, Perylene, Benzo[a]pyrene respectively.
Result and Discussion
Analysis of different PAHs in PM2.5 samples
Distribution of different PAHs revealed that the concentrations vary from time to time depending on the trend of air flow. In general, concentration of total PAHs is easily affected by location and seasonal variation. Besides local sources of PAHs, in both urban and rural areas, transport of PAHs through atmosphere can play a large role. The highly carcinogenic benzo[a]pyrene was normally found in the range of 1-20 ng/m3 in Europe, and around 1 ng/m3 in the USA. For other PAHs, individual concentrations were generally in the range of 1-50 ng/m3 in Europe, 0.1-1 in North and South America and in Australia, 1-10 in Japan, and 10-100 in two towns in India and New Zealand [17]. The measured concentration of Phenanthrene, Anthracene, Pyrene, Chrysene, 1,2- Benzanthracene, Perylene, Benzo-a-Pyrene are presented in (Table 1).
Benz [a] anthracene
Benz [a] anthracene or benzo [a] anthracene is a polycyclic aromatic hydrocarbon with the chemical formula C18H12. According to scientists, more than 20% of the carbon in the universe may be associated with PAHs, possible starting materials for the formation of life. Benzo [a] anthracene is a constituent of tobacco smoke [17]. There was a dose-dependent decrease in cell density was observed due to exposure of benz (a)anthracene.
In the present study the average concentration of Benzo(a) pyrene in the atmospheric particulate matter (PM2.5) was found 2.26μg/m3. The highest concentration was found 6.682μg/m3 and lowest concentration was 0.009μg/m3 (Figure 4). The strongly carcinogenic benzo[a]pyrene was typically found in the range of 1–20 ng/m3 in Europe and around 1 ng/m3 in the USA [18]. Present study reveals the mean concentration of Benzo[a]pyrene is 2.269 μg/m3, which is almost 22 times more from India and 100 times more than from Europe [18] and which may be the result of incomplete combustion of organic matter at temperatures. The other sources may be residential wood burning, automobile exhaust fumes (especially from diesel engines) as the sample location is within a heavy traffic area. [19] Reported, after long-term inhalation of “pure” Benzo [a] pyrene at a concentration of 10ng/m3, cancer of the respiratory tract occurred in 35% of golden hamsters. The range of unit lifetime risks calculated from a number of selected Benzo[a]pyrene studies included in a meta-analysis was 1.1 × 10⁻³ to 4.8 ×10⁻³μg/m3. Some other risk estimates of respiratory tract cancer related to Benzo[a] pyrene in the ambient air have been calculated by the US Environmental Protection Agency and the estimated risk per year ranged from 0.11 × 10⁻⁵ to 1.4 × 10⁻⁵ per ng of Benzo[a]pyrene per m3(EPA Report No. EPA-450/5-83-006, 1984).
Phenanthrene
Phenanthrene is composed of three fused benzene rings and in its pure form, it is found in cigarette smoke, it is a known irritant, photosensitizing skin to light. Phenanthrene appears as a white powder having blue fluorescence. Phenanthrene is the backbone of morphinan, which in turn is the backbone of a large number of psychoactive chemicals including antitussives, analgesics, and dissociative drugs. Phenanthrene is absorbed readily from the gut and lungs. In general, these PAHs are highly lipid-soluble and pass across epithelial membranes.
In this study, the average concentration of Phenanthrene in the atmospheric particulate matters (PM2.5) was found 0.159μg/m3 with a highest concentration of 0.465μg/m3 and lowest of 0.039μg/ m3 (Figure 5). Phenanthrene is a rather common PAH. It occurs naturally in fossil fuels and is a product of incomplete combustion. The primary emission sources of phenanthrene are the combustion of fossil fuels but in this case it may be from traffic and exhausts from industry.
Anthracene
Anthracene is a solid polycyclic aromatic hydrocarbon (PAH) of formula C14H10, consisting of three fused benzene rings. Coal tar, which contains around 1.5% anthracene, remains a major source of this material. Anthracene, as many other polycyclic aromatic hydrocarbons, is generated during combustion processes. Exposure to humans mainly happens through tobacco smoke and ingestion of food contaminated with combustion products. Many investigations indicate that Anthracene is noncarcinogenic: “consistently negative findings in numerous in vitro and in vivo genotoxicity tests”. Furthermore, it is readily biodegraded in soil. It is especially susceptible to degradation in the presence of light [20]. The average concentration of Anthracene in the Gazipur air was detected 0.345μg/m3. The highest concentration was 0.903μg/m3 and lowest concentration was 0.025μg/m3 (Figure 6). The vast majority of anthracene is released to the environment when combustion is incomplete (usually because there is insufficient oxygen). In this case the possible source is emission from vehicle exhausts and domestic wood and coal fires. Emissions also arise from industrial effluents, municipal wastewater treatment facilities, waste incinerators and aluminum smelting.
Pyrene
Pyrene is a PAH with a molecular formula C16H10 and made up of four fused benzene rings, which results in a flat aromatic system. It is a colorless solid which is the smallest peri-fused PAH (one where the rings are fused through more than one face). It is formed during incomplete combustion of organic compounds. Pyrene was first isolated from coal tar, where it occurs up to 2% by weight [21]. Therefore, it is produced in a wide range of combustion conditions. Although it is not as problematic as benzopyrene, animal studies have shown that pyrene is toxic to the kidneys and the liver [21].
The average concentration of Pyrene was found in the gazipur air (PM2.5) was 0.227μg/m3. The highest concentration was 0.364μg/m3 and lowest concentration was 0.011μg/m3 (Figure 7). It is released to the environment through various waste streams. Some source of pyrene includes exhaust from motor vehicles, cigeratte smoke, coal, oil and wood burning furnaces. It is produced in a wide range of combustion conditions. For example, automobiles produce about 1μg/km [20].
Chrysene
Chrysene is a PAH with the molecular formula C18H12 and made up of four fused benzene rings. It is a natural constituent of coal tar, from which it was first isolated and characterized. It is also found in creosote, which is a chemical used to preserve wood. Chrysene is formed in small amounts during the burning or distillation of coal, crude oil and plant material [22]. However, high purity chrysene is colorless, the yellow color being due to the traces of its yellow-orange isomer tetracene, which cannot be separated easily [22]. Chrysene is a ubiquitous environmental contaminant that occurs as a product of the incomplete combustion of organic compound. Humans are exposed to chrysene by oral, inhalation, and dermal routes. Exposure occurs through the consumption of fruits and vegetables grown in areas with high soil or atmospheric concentrations of chrysene and from drinking or using water contaminated with chrysene. Meats, particularly those with high fat contents, contribute significant quantities of chrysene to the diet from the paralysis of fats during the cooking process. Foods smoked or cooked over open coals contain even greater concentrations.
In this study the average concentration of Chrysene in the atmospheric particulate matters (PM2.5) was found 2.120μg/m3. The highest concentration was 7.533μg/m3 and lowest concentration was 0.100μg/m3 (Figure 8). It is a natural constituent of coal tar. Chrysene is estimated to have only about 1% of the toxicity of benzopyrene. It is also found in creosote at levels of 0.5-6 mg/kg [23].
1, 2-Benzanthracene
1, 2-Benzanthracene is a PAH with a molecular formula C18H12, is available as colorless to yellow brown fluorescent flakes or powder. It is stable, combustible, and incompatible with strong oxidizing agents. On decomposition, 1,2-benzanthracene releases carbon monoxide, carbon dioxide, acrid smoke, and fumes. During work, 1,2-benzanthracene can be absorbed into the body of occupational workers by inhalation, through the skin, and by ingestion. Exposures may cause irritation to the eyes, skin, and respiratory tract. Exposures to 1,2-benzanthracene is known to cause kidney damage.
The average concentration of 1,2-Benzanthracene was found in the atmospheric particulate matters (PM2.5) 1.954 μg/m3. The highest concentration was 7.736μg/m3 and lowest concentration was 0.019μg/m3 (Figure 9). The major source may be gasoline and diesel exhaust. Benz (a) anthracene is a carcinogenic constituent of tobacco smoke [24].
Perylene
Perylene or perilene is a polycyclic aromatic hydrocarbon with the chemical formula C20H12, occurring as a brown solid. It or its derivatives may be carcinogenic, and it is considered to be a hazardous pollutant. In cell membrane ecyto chemistry, perylene is used as a fluorescent lipid probe. Perylene are formed during the incomplete burning of coal, oil, gas, wood, garbage, or other organic substances, such as tobacco and charbroiled meat. Perylene did not induce mutations in cultured human lymphoblastic cells. Perylene exerted a cytotoxic effect on human keratinocytes in vitro. The agent is not classifiable as to its carcinogenicity to humans. The average concentration of Perylene in the present study was found 3.374μg/m3. The highest concentration was 11.229μg/m3 and lowest concentration was 0.155μg/m3 (Figure 10).
ANOVA test also revealed (Table 2) that the concentration of different PAHs species are significantly different (Fcal> F crit) at different sampling times, which indicated that concentration of PAHs species are correlated with times and seasons. Two-way ANOVA test revealed that the concentration of different PAHs species (Fcal> F crit) are significantly different from each other at a 95% confidence level. ANOVA test also revealed that the concentration of different PAHs species are significantly different (Fcal> F crit) at different sampling times, which indicated that concentration of PAHs species are correlated with times and seasons.
Pearson’s Correlation
The Pearson’s correlation matrix between all the variables (e.g. Benzo(a)Pyrene, Phenanthrene, Anthracene, Pyrene, Chrysene, 1,2- Benzanthracene and Perylene) in air particulate matter PM2.5 samples was performed using a windows version software ‘IBM SPSS Statistics 20’ (IBM, USA); and the results are presented in (Table 3). The study revealed a significant positive correlation between the Chrysene and Benzo (a) Pyrene, 1,2-Benzanthracene and Perylene; Benzo (a) Pyrene and Perylene; Anthracene and Phenan-threne; and 1,2- Benzanthracene and Chrysene at a 95% Confidence level -indicating they are coming from the same source/s. Reversely a negative correlation was also observed between Chrysene and Anthracene (-0.460*) at a 95% confidence level.
Conclusion
The average concentration of Benzo-a-Pyrene, Phenanthrene. Anthracene, Pyrene, Chrysene, 1,2- Benzanthracene and Perylene, were 2.26μg/m3 , 0.16μg/m3, 0.35μg/m3 , 0.23μg/m3 , 2.12μg/ m3 , 1.95μg/m3 , and 3.37μg/m3 respectively The most carcinogenic Benzo-a-Pyrene (BAP) was detected with a concentration of 2.26μg/m3 in Gazipur air but WHO guide line value for BAP is between 0.1 and 1.3 ng/m3 for Lung cancer. The strongly carcinogenic benzo[a]pyrene was typically found in the range of 1–20ng/ m3 in Europe and around 1ng/m3 in the USA but in our study it is 2.26μg/m3 which is almost 100 times more than that found in Europe and USA. Average concentration of seven PAHs of Gazipur area was 1.49μg/m3. Whereas the average concentrations of particle- bound PAHs were 0.27±0.16μg/m3 in North Chinese Plain and hence Gazipur air contains more than 5 times greater amount of PAH’s and is really alarming [25]. showed that average concentration of measured sixteen polycyclic aromatic hydrocarbons (PAHs) in total suspended particulate matter (TSPM) from an urban and industrial cum residential site in Agra (India) from December 2005 to December 2006 were 115±17ngm3 [26]. Also reported, average concentration of total PAH was extremely high, with annual average concentration of 155ng/m3 in air sample collected from the Kathmandu Valley in the foothills of the Himalayas. The average concentrations of particle-bound total PAHs were 267ng/m3 in North Chinese Plain. [27] And hence in the present study average total PAHs are 10.439μg/m3.
Due to the industrialization and modernization of society, the introduction of motorized vehicles, and the explosion of the human population, massive traffic, burning of fuel, burning of coal in the brick kilns and power plant, burning of different types of plastic, dust particles from the different construction sites were the sources of the PAHs in the Gazipur area. The concentration was found in a level where there is a potential threat to carcinogenic effect due to long time exposure. Therefore, it is essential to develop an air pollution abatement strategy to protect people from the hazardous effects arising from elevated atmospheric PAHs by the systematic study of air pollution. The Government of Bangladesh should take immediate action to reduce these high concentrations of PAHs [28].
To read more about this article: https://irispublishers.com/gjnfs/fulltext/contamination-status-of-polycyclic-aromatic-hydrocarbons.ID.000560.php
For more Open Access Journals in Iris publishers please click on: https://irispublishers.com/pdf/peer-review-process-iris-publishers.pdf
0 notes
Text
Iris publishers-Global Journal of Nutrition & Food Science (GJNFS)
Studying the Effect of Tio2 Nanoparticles on Seed Germination Characteristics of Ziziphora Clinopodioides Lam
Authored by Reyhaneh Azimi*
Abstract
Improvement in the rate and amount of germination of seeds has a very important effect on the establishment of primary seedlings and the increase of rangeland production. The rapid and uniform germination of seeds leads to the successful establishment of plants. The use of nanoscale materials can help germinate faster seeds. Therefore, in this study, the effects of TiO2 nanoparticles in concentrations of 0, 10, 20, 30, 40, 60 and 80 mg/ L on the rate and speed of seed germination of Ziziphora clinopodioides Lam. paid. This design was carried out in a completely randomized design with four replications for 20 days at a constant temperature of 20°C under 12 hours of light and 12 hours of darkness at the Germinator of Natural Resources Faculty of the Ferdowsi University of Mashhad. The results showed that germination percentage of treated seeds with TiO2 nanoparticles increased to 23% ppm compared to control treatment. Also, in other concentrations of other nanoparticles, there was a positive effect on speed and germination percentage, so that the effect of different concentrations of nanoparticles on germination characteristics of Ziziphora clinopodioides Lam. seeds was significant. The highest germination percentage was observed in the concentration of 30 ppm and the lowest germination rate at 30 and 20 ppm concentrations. In high concentrations of TiO2 nanoparticles, no positive effects were observed on the germination characteristics of seed Ziziphora clinopodioides Lam. To conclude the use of TiO2 nanoparticles can be improved by improving the seed germination properties of the medicinal plant Ziziphora clinopodioides Lam. that cause increases plant’s establishment in natural areas.
Keywords: Nanoparticles, Tio2, Germination, Ziziphora clinopodioides Lam
Introduction
Nanotechnology research is the background of advanced technology, which has led to the rapid development of electronic science, biotechnology, medicine, space science and defense industries. So far, few studies have been done on the effects and mechanisms of nanoparticles on plant growth [1]. Examples of the unique properties of nanoparticles include a very high specific surface area, high surface energy, and quantum imprisonment. These unusual properties may even affect their fate and environmental behavior in both mass and non-nanoscale materials [2]. Plants, ex cept for the foundation of all ecosystems, play a crucial role in the fate and transfer of nanoparticles in the environment through absorption and bioaccumulation. Silicon oxide and titanium dioxide are the most commonly used nanoparticles used in the industry. Of course, some of them are also used in agriculture and natural resources. Below we will investigate several studies on the role of these nanoparticles in the germination of different plant species.
Among different methods, nanoparticles (NPs) of different metal oxides by absorbing water, oxygen and nutrients and having the antimicrobial properties can affect seed germination percentage, improve growth, dry weight, photosynthesis, chlorophyll biosynthesis, and plant metabolism [3]. Thus, soaking seeds in NP solution can be used as an option to increase seed germination percentage. The application of 100% TiO2-NP treatment increased seed germination percentage, germination index, germination energy, vigour index, seedling height and fresh weight of Pinus tabulaeformis Carrière [4]. The effect of silver NPs on Boswellia ovalifoliolata N.P. Balakrishnan & A.N. Henry caused an increase and acceleration of the seed germination percentage [5].
Abdel Latef, et al. (2017) [6] in a research titled “ Titanium Dioxide Nanoparticles Improve Growth and Enhance Tolerance of Broad Bean Plants under Saline Soil Conditions” compared the effects of three different nTiO2 concentrations (0·01%, 0·02% and 0·03%) with respect to plant growth and stress responses. The 0·01% nTiO2 application significantly increased shoot length, leaf area and root dry weight of plants under normal conditions.
Feizi, et al. (2012) [7,8] concluded in a study titled “ Effects of various concentrations of nanoparticles and non-nano-titanium dioxide on seed germination and seedling growth of fennel”, which showed that germination percentage of seeds was significantly increased in treatment Application of concentration of 60 mg/l titanium oxide nanoparticles (76%) increased compared to other treatments and control (54%). The average germination time improved by application of nanoparticles with a concentration of 40 mg / L compared to the control by about 31%, while non-nano particles improved the mean germination time by only 21%. In general, the use of titanium dioxide nanoparticles as an option for seed that has a germination problem and a low germination percentage can be used. Also, Feizi et al. (2013) [9], in another study titled “The effects of plant and native titanium dioxide on the fennel,” showed that with the concentration of TiO2 nanoparticles at 0, 5, 20, 40, 60 and 80 After 14 days of inoculation, the germination percentage increased to 31.8% (60 ppm TiO2 nanoparticles) with non-nano TiO2 after 14 days of inoculation. The same positive effects were observed for stem dry weight and germination. Behnam, et al. (2012) [10], in a study titled “The effect of titanium nanoparticles and non-nanodioxid on germination performance of Echinacea purpurea under drought stress”, concluded that the application of titanium dioxide treatment on the seeds of Echinacea purpurea in conditions without The stress on roots and length of seedling length and root length, rootstock and seedlings, seed vigor index, I and II, and mean germination time at 1% were very significant in drought stress conditions. Drought stress at 3-bar intensity did not negatively affect the most traits such as percentage and speed of germination, average daily germination and seed vigor index I and II in Sardinia. The concentration of 159 mg / L of non-nano titanium dioxide increased the length of stem, root, and seedlings compared to the control 3 times. In the face of drought stress, the application of 100 milligrams per liter of nanoparticles and non-nano particles often improves the germination characteristics of Echinacea purpurea and can be recommended in areas with drought stress. Feizi, et al. (2013) [9] in a study titled “Comparative effects of different levels of titanium dioxide in nano and non-nano plants of Salvia officinalis L.” concluded that after 21 days of inoculation, Germination increased with 60 mg/l nano-titanium dioxide and non-nano, but did not affect root and shoot length and biomass. Agheli, et al. (2016) [11], in a study titled “Silybum marianum L. seed germination induction using titanium dioxide nanoparticles and magnetic field”, which was tested as a factorial experiment in a completely randomized design with three Repeated experiments were carried out and the first factor was seed treatment at different concentrations of titanium dioxide nanoparticles containing 50, 10, 0 and 100 mg/l, and the second factor of the treatment of seeds with a magnetic field at 0.30, 60 and 90 millitesla for 30 minutes showed that the highest percentage of seed germination in the interaction of nanoparticles of TiO2 nanoparticles with a concentration of 100 ppm and intensity The magnetic field intensity was 30 millitesla and the application of titanium dioxide nanoparticles with a concentration of 50 ppm and magnetic field intensity of 60 milliseconds. These treatments improved the germination percentage by 5.6 and 5.7 times the control treatment. Feizi, et al. (2012) [7,8] showed in a study titled “The reaction of wheat seed to different concentrations of titanium dioxide nanoparticles (TiO2) compared to non-nano particles”. Experimental treatments were based on seed’s germination percentage and germination rate did not have a significant effect but had a significant effect on average germination time. The lowest mean germination time (MGT) was 0.89 days at a concentration of 10 ppm nanoparticles of TiO2 and the highest was observed in the control treatment with 1.35 days (Table 2). Therefore, the concentration of 10 ppm nanoparticles of non-nano TiO2 reduced the MGT content by 34% compared to the control, while the concentration of 10 ppm TiO2 in non-nano, MGT did not changed against the control. One-year-old seedlings of Pine (Larix elgensis) were placed in concentrations of 62, 125, 250, 500, 1000, 2000 μl/l of nano silicon dioxide (SiO2) for about 6 hours. Nano treatment greatly improved the growth and quality of seedlings. Treatment with 500 μl/liter had the best result, with an increased average height of 42.5%, a root diameter of 30.7%, a root length of 14%, and the number of lateral roots of seedlings of 31.6% in comparison with control. Also, treatment with 500 μl/l showed the highest concentration of chlorophyll [12]. Lee, et al. (2008) [13] examined the toxicity of copper nanoparticles on beans and wheat and stated that TiO2 concentrations had a significant effect on root dry weight but did not have a significant effect on stem and seedling dry weight. Takallo, et al. (2012) [14], in a study titled “The effect of TiO2 nanoparticles on germination and cytogenetic indices of barley plant, showed that the comparison of nanoparticle treatments compared to control increased the index of chromosomal deviations of barley, whereas on other cytogenetic indices and germination traits had no significant effect. A few study has been done on the effects of NP-TiO2 and TiO2 on various plants such as Triticum aestivum, Zea mays, Salvia officinalis [15,16]. NP-TiO2 can improve the structure of chlorophyll, increase light absorbance, facilitate formation of pigments, better capture of sunlight and transfer of light energy to active electrons, chemical activities and having effect on photosynthesis [17]. Jiang, et al. (2017) [18] showed that seed germination indices markedly improved upon seed exposure to TiO2. Samadi, et al. (2014) [19] showed that TiO2 in higher concentration had pronounced effects on photosynthetic pigments while lower concentration of NP-TiO2 had significantly increased root length. root length was significantly influenced by 100mg L-1 concentration of NP-TiO2 rather than non NP-TiO2 concentrations. Pronounced effect on photosynthetic pigments (chlorophyll a and b and carotenoids) was found in 200mg L-1 concentration of TiO2 and 100mg L-1 concentration of NP-TiO2.
Mahmoodzadeh et al. (2013) in a study named as Physiological effects of TiO2 nanoparticle on wheat (Triticum aestivum) showed that NP-TiO2 at higher concentration decreased the shoot and root length of radish, rape, corn, lettuce and cucumber. Movafeghi, et al. (2018) [20] showed that The increasing concentration of TiO2-NPs led to the significant decrease in all of the growth parameters and changes in antioxidant enzyme activities. The activity of superoxide dismutase enhanced significantly by the increasing concentration of TiO2-NPs. Enhancement of superoxide dismutase activity could be explained as promoting antioxidant system to scavenging the reactive oxygen species. In contrast, the activity of peroxidase was notably decreased in the treated plants. Reduced peroxidase activity could be attributed to either direct effect of these particles on the molecular structure of the enzyme or plant defense system damage due to reactive oxygen species.
The mixing of SiO2 and TiO2 nanoparticles with the low concentration, increased nitrate reductase activity in soybean rhizosphere, resulting in increasing of soybean germination and growth [21]. It has been reported that nanoparticles can accelerate soybean germination and growth and prevent rotting by molds. Nanoparticles can enhance roots power and nitrate reductase activity and improve the root ability to absorb water and fertilizer and increase the activity of antioxidants, dismutase and catalase enzymes and improve soybean resistance to stress [22]. The remarkable effect of nanoparticles is probably due to the small size of the particles, which allows its penetration into the seed. In a study by Ivani, et al. (2012), the effect of nano silica and non-nano silicon dioxide particles on stress tolerance of Trigonella foenum-graecum seedlings, the results of the analysis of variance showed that the levels of water stress and nano and non-nano silicon dioxide treatments had a significant effect on the studied traits.
The results of Zhang, et al. (2005) [1] showed that spinach (Spinacia oleracea) old seeds germination rate was very low. Treatment with TiO2 increased the rate by 23%, but treatment with nano TiO2 significantly increased germination rate, germination index, seedling dry weight and Vigor index of older seeds. In spinach (Spinacia oleracea), the best treatment was 5.2 per 1000 of TiO2 nanoparticles, with the fresh and dry weight of each plant increasing by 63% and 76%, respectively against the control [1]. All treatments significantly affected germination percentage and germination rate. The highest germination percentage was observed in the seeds of titanium nanoparticles with concentrations of 30 (48%), 40 and 20 mg/l (35%), and the lowest rate of germination in the seeds impregnated with titanium nanoparticles with concentrations of 30 (29.9 days) and 20 (6.9 days) were observed [1]. The germination percentage of Arabidopsis thaliana seeds was affected by SiO2. A significant positive effect on rootlet length was observed on all concentrations of nano Al2O3 and 400 nano SiO2 concentrations, while other concentrations, as well as nano Fe3O4 and ZnO, showed inhibitory effects on root length. All concentrations of ZnO contained fewer leaves [23]. Khodakovskaya, et al. (2009) [24] showed that carbon nanotubes with concentrations of 10-40 mg/l increased germination and tomato growth, which is probably due to the ability of carbon nanotubes to penetrate the seed crust and stimulation of water absorption.
Materials and Methods
Introducing the plant used in the experiment
Mountain Ziziphora clinopodioides Lam. belongs to the genus Ziziphora, the plant has a height of 10 to 40 centimeters. Booty and stable, a woody base, and sometimes it has a stem of pubes with different densities. The aerial parts of the Ziziphora clinopodioides Lam. are widely used in traditional medicine and pharmaceutical industries of Iran [25]. The resistance of the mountain Ziziphora clinopodioides Lam. to drought is suitable and can be used for cultivation in arid and semi-arid regions [26]. Also, since plants have essential oils such as peppermint plants (Ziziphora clinopodioides Lam. and etc.) have a good function in semi-arid and Mediterranean regions, these plants can be considered as a commercial product for Iran and an alternative surplus product [27]. The geographical distribution of Ziziphora clinopodioides Lam. in the world is in the Eastern Balkan Peninsula, Southwest Asia and Central Asia to the Pamir Himalaya Mountains (Iran, Iraq, and the central and eastern parts of Turkey) and Africa [28]. Ziziphora clinopodioides Lam. grows in Iran in mountainous areas, rocky and deposit slopes, and steppe areas at altitudes between 800 and 3700 m above sea level [28].
Laboratory operations
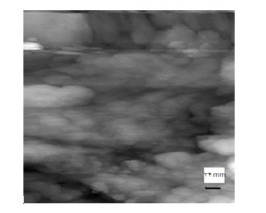
Germination test was performed in two stages. In the first step, in order to study the quality and percentage of germination of the Ziziphora clinopodioides Lam., 25 healthy seeds of Ziziphora clinopodioides Lam. were placed in petri dish in four replicates and germination test was done with distilled water for 20 days. After 20 days of the experiment, the germination percentage of the Ziziphora clinopodioides Lam. seed was about 25% and very low. Therefore, different concentrations of nanoparticles were used to improve the seed germination characteristics of Ziziphora clinopodioides Lam. This experiment was carried out to evaluate the different concentrations of titanium nanoparticles on the germination traits of Ziziphora clinopodioides Lam. seed. For this purpose, 7 treatments containing different concentrations of 0, 1000, 2000, 3000, 4000, 6000 and 8000 mg/l nanoparticles of titanium particles were performed in a completely randomized design with four replications. The seeds of Ziziphora clinopodioides Lam. were obtained from Khorasan Razavi Natural Resources Office. The titanium dioxide nanoparticle powder was as AEROXIDE® TiO2 P25, that prepared from Evonik DegussaGmbH company in Germany. The purity of nanoparticle powder was 99.8%, the average particle size was 21 nm and its specific surface area was 50 m2/g (Figures 1 to 4). Non-nano iron oxide was prepared from AppliChem GmbH Germany with a purity of 99% and a particle size of about 1 micrometer. Before the experiment, the size of the nanoparticles was determined by an STM tunnel microscope (STM) at the Central Laboratory of Ferdowsi University of Mashhad. Also, purity and their compounds were determined by X-ray diffraction (XRD) at Damghan University of Science.
In order to obtain the desired concentrations, we first weighed the nanoscale materials in distilled water. Ultrasound bath was used for 20 minutes to prepare a uniform suspension. 2 ml of prepared suspension was placed in per petri dish along with 25 seeds. In the control group, 2 ml of distilled water was added. In the next steps, if necessary, only distilled water was added to the dishes. Seed scratching treatment was performed at 4°C for one week (ISTA, 2009). This experiment was carried out at germinator of the Faculty of Natural Resources and Environment of Ferdowsi University of Mashhad at a temperature of 20 centimeters under 12 hours of light and 12 hours of darkness. To prevent evaporation of the extract and loss of moisture, Petri dishes port were laid and placed in plastic. The germinated seeds were counted and recorded daily. Seed counting continued until 20 days after starting germination. Data and daily measurements were entered into Excel spreadsheet software and after processing, statistical analysis of data was done by SPSS18 and Minitab16 softwares and the meanings were compared by Duncan’s multiple domain tests at 5% probability level.
Data Analysis
The following equations were used to determine the rate of germination from the formula of Maguire (1982) and the mean germination time (MGT) [29]:
Germination rate (GR) = (a/1) + (b-a/2) + (c-b/3) + …..+ (n-n- 1/N) Equation (1)
In which, GR, the germination rate according to germinating seed per day, a, b, c, and n represents the number of germinated seeds after 1, 2, 3 and N days after starting to absorb water.
MGT = ΣF (X)/ ΣF Equation (2)
In this equation, MGT, the average germination time (day), F: The number of new seeds germinated on the day of counting Xi and X is the day of counting. In this experiment, Mean daily germination, Pick value and Germination value was calculated from the following equations [30]:
Daily germination average (MDG)= Germination percent/Total days of experiment Equation (3)
maximum value (PV) (GV) = highest number of germinated seeds per day/ germination day Equation (4) germination value= PV × MDG Equation (5)
Results and Discussion
In Figure 1-4, it can be seen an image of the size of the titanium dioxide nanoparticles, using a tunneling scanning microscope (STM), a topographic image of the titanium dioxide nanoparticles, using a tunnel scanning microscope (STM), illustration of the size of the non-nano titanium dioxide particles using Scanning electron microscopy (SEM) and X-ray diffraction spectrum (XRD) of titanium dioxide nanoparticles.
The results of the analysis of variance showed that different concentrations of titanium nanoparticles had a significant effect on seed germination characteristics of Ziziphora clinopodioides Lam. Based on the results, different concentrations of titanium nanoparticles showed a significant effect on germination percentage, germination rate at 1% and 5% probability levels Table 1. Also, the comparison of the mean of different concentrations of titanium nanoparticles on the characteristics of germination of Ziziphora clinopodioides Lam. seed is given in Table 2.
In order to reduce the amount of data in the table of analysis of variance, only the mean square of the data and significant levels were used at the probability level of 1 and 5%.
The best rate of germination was observed at concentrations of 20, 30 and 40 mg Table 2. The concentration of 30 ppm of nanoparticles had the greatest effect on improving seed germi nation properties of Ziziphora clinopodioides Lam. Therefore, it seems that titanium nanoparticles can be one of the treatments to improve germination properties. Seed germination percentage of the control treatment was about 25%, while seed germination percentage reached 48% in the seeds treated with the nano-particles solution Table 2. The seeds that were treated with nanoparticles had the best results from the observations. The maximum germination percentage and the minimum germination time were about 48 and 29.9%, respectively, compared to the control. Germination speed improved from 12.23 days in control treatment to 9.29 days in nano-treated seeds (30 ppm). Germination percentage increased with increasing concentrations up to 30 mg/l, and then from 40 mg, germination percentage had decreasing trend Table 2, while Feizi et al. (2013a) [9], in a study titled “Effects of different concentrations of nano and non-nano titanium dioxide on seed germination and Foeniculum vulgare seedling growth”, concluded that seed germination percentage was significantly increased in the application of 60 mg/l (76%) than other treatments and control (54%).
Like the present study, Feizi, et al. (2013b) [15] showed that with a concentration of TiO2 nanoparticles, the germination percentage increased. Feizi, et al. (2012b) [8] showed which a concentration of 10 ppm nanoparticles of TiO2, decreased MGT until 34% relative to the control, while the concentration of 10 ppm of TiO2 non- nanoparticles did not change the MGT value compared with the control. Also, Behnam, et al. (2013) [10] concluded that the concentration of 159 mgr/l of non-Titanium dioxide nanoparticles increased the length of stem, root, and seedlings by 3 times against the control that is compatible to the present study. The results of Lee, et al. (2008) [13] showed that toxicity of copper nanoparticles in beans and wheat that TiO2 concentration had a significant effect on root dry weight, but no significant effect was observed on stem and seedling dry weight, that is compatible to the present study. Zhang et al. (2005) [1] showed that increased germination and dry weight are probably due to increased absorption of mineral nutrients and the photosynthesis process catalyzed by TiO2 nanoparticles. The remarkable effect of nanoparticles is probably due to the small size of the particles, which allows it to penetrate into the seed during the treatment period, that is compatible to the present study. Lu, et al. (2002) [21] reported that the mixture of SiO2 and TiO2 nanoparticles increased at low concentration of nitrate reductase in soybean rhizosphere, resulting in increased germination and soybean growth. According to Zhang et al. (2005) [1], nano TiO2 treatment significantly increased germination rate, germination index, seedling dry weight and Vigor index of older seeds, that is compatible to the present study. It is possible that superoxide and hydroxide ions increase the permeability of the seed and facilitate the entry of water and oxygen into the cell, and thus aggravate the seed germination metabolism [31-34]. In addition, the entry of TiO2 nanoparticles into cells can produce oxidation-reduction reactions through radical superoxide ions during germination in the dark, leading to the release of free radicals in the germinating seeds. The oxygen produced in such a process can be used for breathing, which will further stimulate germination, that is compatible to the present study.
All treatments of this study significantly affected germination percentage and germination rate. The highest germination percentage was observed in the seeds of titanium nanoparticles with concentrations of 30 (48%), 40 and 20 mg/l (35%), and the lowest germination rate were observed in the seeds impregnated with titanium nanoparticles with concentrations of 30 (29.9 days) and 20 (6.9 days).
Conclusion
Improvement in the rate and rate of seed germination has a very important effect on the establishment of primary seedlings and the increase of rangeland production. Rapid and uniform germination of seeds leads to the successful establishment of plants. The use of nanomaterials can help seeds to germinate faster. Therefore, in this research, the effects of TiO2 nanoparticles in concentrations of 0, 10, 20, 30, 40, 60 and 80 mg/l on the rate and speed of seed germination of Ziziphora clinopodioides Lam were studied. The effect of different concentrations of titanium nanoparticles on germination percentage and germination rate of Ziziphora clinopodioides Lam. seed was significant at 1% and 5% probability level. Titanium nanoparticles in the concentration of 30 and 20 mg/l, stimulating effect and in higher concentrations had an inhibitory or neutral effect on seed germination of Ziziphora clinopodioides Lam. High concentrations of titanium nanoparticles in the germination stage had a negative effect on MGT, and the best and suitable concentration was used to stimulate growth and germination of 30 mgr/l of nanoparticles. These results indicate that the use of TiO2 nanoparticles can increase the establishment of this plant in natural areas by improving the seed germination properties of the Ziziphora clinopodioides Lam. medicinal plant.
To read more about this article:https://irispublishers.com/gjnfs/fulltext/studying-the-effect-of-tio-nanoparticles-on-seed-germination-characteristics.ID.000555.php
For more Open Access Journals in Iris Publishers please click on: https://irispublishers.com/pdf/peer-review-process-iris-publishers.pdf
Indexing List of Iris Publishers: https://medium.com/@irispublishers/what-is-the-indexing-list-of-iris-publishers-4ace353e4eee
Iris publishers google scholar citations:https://scholar.google.co.in/scholar?hl=en&as_sdt=0%2C5&q=irispublishers&btnG
0 notes
Text
Iris publishers-Global Journal of Nutrition & Food Science (GJNFS)
Changes in Fish Quality During Canning Process and Storage Period of Canned Fish Products: Review Article
Authored by Adel A El Lahamy*
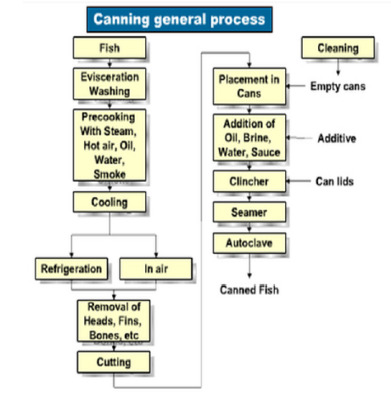
Abstract
Fish and fish products are subject to enzymatic, microbiological and chemical changes during fish processing. Canned fish products stable at ambient temperature, have long shelf life and in consequence are eminently suitable for world-wide distribution. Therefore, this study aimed to conclude the alterations in proximate chemical composition, Quality characteristics, nutritional quality and microbiological safety of fish during canning process. Also following changes in these parameters during storage period of canned fish.
Keywords: Canning process; Chemical composition; Storage period
Introduction
Canning is a well-established and traditional means of providing food which is stable at ambient temperatures, has long shelf life and in consequence is eminently suitable for world-wide distribution. Canned fish is therefore exported from countries all over the world into the consumer markets. The manufacturing of canned fish has provided, and continues to provide much-needed employment, individual incomes and the means for foreign currency exchange for developing countries, particularly in Southeast Asia, South America and the Indian Ocean. [1] Canned fishery products are formally canned in vegetable oils and now available in water packs. Preservation methods such as freezing, and canning are technologies that used basically due to cost and non-availability of equipment and cold storage system [2]. The advantages of canned food are such as their preservation, safety and convenience. The major steps in canning process include cooking, cooling, packing with a covering oil or tomato sauce in sealed cans and sterilized to achieve commercial sterilization by the heat. Oxidation of lipids and formation of nitrogenous compounds can occur during the cooling step of fish cooking [3]. during storage temperature (above 35°C) must be avoided to prevent the growth of thermophilic bacterial spores. Changes in the food quality during storage period result from a change in physicochemical and microbiological properties that decrease their nutritional value, palatability, and safety.Chemical CompositionSlabyj and Carpenter [4] stated that raw mussel meat contained 81.2% moisture, 3.29% protein, 0.81% lipid, 0.41% ash, and 0.75% carbohydrate, steamed mussel meat contained 74.6% moisture, 2.73% protein, 0.62% lipid, 0.24% ash, and 0.32% carbohydrate, and canned mussel meat contained 75.7% moisture, 2.90% protein, 0.72% lipid, 0.27% ash, and 0.20% carbohydrate. El-Sherif (2001) [5] stated that the moisture contents of shrimp canned with vegetables and those canned with tomato sauce were lower by 12.6 and 10.8% respectively as compared with moisture content of raw shrimp. Also, he found that protein content in shrimp and found that protein contents of raw shrimp, samples canned with vegeta-bles and samples canned with tomato sauce were 76.90, 60.85 and 68.11 (on dry weight basis), respectively. These values indicated that heat treatments applied in canning process resulted in losses of protein which were accounted by 20.9 and 11.4 in samples canned with vegetables and tomato sauce respectively. Chemical analysis of canned shrimp showed that crud fat, crud ash and carbohydrate content were higher than of raw shrimp [5]. The chemical composition of smoked mussels of (Mytilus galloprovincialis L) were 20.4±0.45, 4.9, 1.30, 2.4±0.02 and 69.4±0.23 for Protein, lipid, ash and moisture respectively. After caning process these values changed to 12.7±0.46, 8.1±0.14, 3.1±0.14 and 70.2±0.62 for Protein, lipid, ash and moisture respectively [6]. Also he reported that chemical composition of mussels (Mytilus galloprovincialis L) were 17.3±0.04, 4.0±0.28, 1.8±0.19 and 73.0±0.07, after caning process these values changed to 12.2±0.47, 10.6±0.57 2.8±0.01 71.1±0.29 for Protein, lipid, ash and moisture, respectively. Shakila, et al., (2005) [7] have observed a reduction of 6% moisture content in cooked tuna. Also, Garcia-Arias et al., (2003) [8] have reported that moisture content decreased and fat content increased in cooked fish fillets. Selmi, et al. (2008) [3] the lipid contents found in tuna (Thunnus thynnus) and sardine (Sardina pilchardus) contents dropped significantly (P<0.05) after the caning process. In cooked tuna, the moisture content decreased significantly (p<0.05) with an increase in the duration of heat process giving up to 16% reduction [9]. Canning process reduced the protein content for Orcynopsis unicolor, But, increased in protein content for Euthynnus affinis. El-Dengawy, et al. (2012) [10] determined the chemical composition of Sixteen samples of canned fish products imported (canned tuna, canned sardine, canned Mackerel) and observed that moisture percentages in all canned fish samples ranged between 52.41±0.035 to 78.53±0.142 %. It could be observed that all canned fish samples had high values of water activity (0.990-0.999). Meanwhile, NaCl content ranged between 0.13±0.000 to 1.20±0.042%. Czerner, et al. (2015) [11] determined that the chemical composition of fresh anchovy were 77.65±0.67, 16.24±0.82, 4.25±0.09 and 1.16±0.06 for moisture content, protein content, lipid content and ash content respectively. In canned fish, chemical composition were 64.82±0.06, 26.74±0.74, 6.23±0.38 and 2.21±0.01 respectively. Sajib (2015) [12] Studied the effect of canning process on the chemical composition of chela (Laubuka dadiburjori) and determined that moisture content, protein content, lipid content, ash content and carbohydrate content of fresh fish were 76.56±1.62, 13.74±1.22, 4.25±0.85, 2.37±0.56 and 1.41±0.79 respectively. After canning process these values changed to 67.15±1.69, 16.68±0.88, 5.46±0.34, 8.15±0.83 and 1.35±0.07 for Moisture, Protein, Lipid, Ash t and Carbohydrate respectively.Fatma Arfat (1994) [13] found that the moisture, sodium chloride and protein contents of canned sardine and mackerel were decreased after 24 months storage at room temperature while, total lipids contents was increases. Ghaly (1995) [14] pointed out that chemical composition of canned shrimp was affected by storage at room temperature for 6 months and the kind of filling medium. Moreover, moisture, protein and carbohydrates were decreased while, fat and ash were increased in canned bosr and shrimp packed by dry method. On the other hand the moisture, fat and ash contents were increased. Abd El-Ghafour (1999) [15] found that moisture contents of Tilapia fish fillets slightly decreased while crude protein contents was considerably reduced but crude fat and ash contents were progressively and gradually increased during storage of ambient temperature. Ibrahim (1999) [16] mentioned that moisture, protein and fat contents of canned sardine showed a gradual decreasing as a period of storage at room temperature extended up to 12 months while, ash and salt contents showed a noticed increase. The chemical composition of canned chela (Laubuka dadiburjori) fish were 76.56±1.62, 13.74±1.22, 4.25±0.85, 2.37±0.56 and 1.41±0.79 at zero time of storage period. After 30 day of storage period these values changed to 68.13±2.06, 15.15±0.95, 5.51±0.56, 10.43±0.91 and 1.36±0.09. At the end of storage 60 days these values were 68.88±1.89, 15.62±0.45, 5.96±0.48, 12.60±1.12 and 1.39±0.07 for moisture content, protein content, lipid content, ash content and carbohydrate content respectively [12].Quality Characteristics
Total volatile basic nitrogen (TVB-N) and Trimethyleamin (TMA-N)
TMAO can be degraded during the thermal processing to disagreeable molecules such as TMA and DMA [5,17]. The cooking process had no significant effect on the TVB-N levels (P<0.05), while TMA-N levels in sardine increased to reach 6.32 mg/100g [3]. El-Dengawy, et al. (2012) [10] determined the quality characteristics in Sixteen samples of canned fish products imported (canned tuna, canned sardine, canned Mackerel) and observed that TVN values in canned fish samples ranged between 7.01±0.254 mg N/100g sample to18.04±0.593 mg N/100g sample. The TVB-N in fresh chela (Laubuka dadiburjori) fish recorded 7.10 mg N/100g, these values increased to 15.50 mg N/100 g after caning process [12].Increasing the total volatile basic nitrogen was attributed to the degradation of nitrogenous compounds resulting in an increase in both trimethylamine nitrogen (TMAN) and ammonia nitrogen (NH3N) which were considered the principle fractions of the TVBN [13]. The total volatile nitrogen contents of canned shrimp and bosr packed by dry method and in 3% salt solution, slightly increased during storage at ambient temperature for 6 months [14]. Abd El-Ghafour (1999) [15] recorded a gradual increase in the TVBN content of canned Tilapia fish fillets products as the storage period was extended. At the end of 12 months storage, samples steamed and canned in oil or tomato sauce showed an increasing of TVBN determined by 15.58 and 17.05% respectively while, the increasing rates were 18.71 and 20.61% in samples fried and canned in the same filling media respectively. Fatma Arfat (1994) [13] observed a gradual increase in TMA contents of canned mackerel and sardine samples as the time of storage at ambient temperature was extend ed which was attributed to tri-methyl nitrogen oxide that natural present in fish tissue which chemically reduced by SH group existing in fish protein or by zinc present in C-Enamle used for varnishing the cans. Ibrahim (1999) [16] found that the highest increased observed in TMAN content of sardine during storage was found in samples canned with sauce comparing with those packed in oil or spices. The total volatile basic nitrogen of canned sardine packed in different media gradually increased as the period of storage at room temperature was progressed [16]. In the first period of storage (3 months), TVB-N and TMA-N values increased significantly to attain 23.85 and 18.42 mg/100 g, and 7.95 and 8.11 mg/100 g in sardine and tuna, respectively, and remained statistically constant (P<0.05) until the end of the storage period [3]. The TVB-N values of canned chela (Laubuka dadiburjori) fish was 15.50 mg N/100 g, at zero time of storage period. It increased up to 17.68 mg N/100 g after 30 days. After that it continued to increase to 21.95 mg N/100 g after 60 days of storage period [12].
Thiobarbituric acid (TBA) and Peroxide value (PV)
Primary (peroxide value; conjugated dienes) and secondary (TBA and carbonyl values) lipid oxidation detections did not afford accurate methods for testing quality differences in canned products [18]. Chia, et al. (1983) [19] reported that canning process of rainbow trout pollok and shrimp resulted in reduction of thio-barbituric acid by about 50% of its initial value in the raw materials. The evaporation of water and loss of juiciness during cooking might have also contributed to an increase in TBA-RS values after cooking [20]. Koizumi, et al. (1987) [21] have also reported that TBA-RS values increased during cooking of fish at 100°C for 30 min, but they were below 1 μg of malonaldehyde/g of fat. Thio-barbituric acid determined as malon aldhyde slightly increased from 0.40 mg/kg of raw shrimp to 0.44-0.48 mg/kg of the canned samples. This could be attributed to slight oxidation of unsaturated fatty acids found in shrimp during heat treatment of canning process [5]. El-Dengawy, et al. (2012) [10] determined the quality characteristics in Sixteen samples of canned fish products imported (canned tuna, canned sardine, canned Mackerel) and observed that acid value of canned fish samples had the highest value of AV being 20.39±0.000 mg KOH/g oil in CM.It is well-known that the quality of canned products has a very close relationship with their lipid content and composition. Canned fishery products are especially susceptible to flavor and other changes due to the high levels of polyunsaturated fatty acids [22]. Ghaly (1995) [14] observed a gradual increase in TBA value of canned Suez Shrimp and elongated boor samples as the period of storage at ambient temperature was prolonged. Ibrahim (1999) [16] who noticed that TBA values of canned sardine products were gradually decreased as storage period extended and samples canned with sauce showed the lowest TBA values. Abd El-Ghafour (1999) [15] reported that a progressive increment in the TBA value of canned Tilapia fish fillets during storage at ambient temperature for 12 months. Selmi, et al. (2007) [3] studied the effect of local canning process and storage time (up to 6 months) on tuna and sardine canned in olive oil and tomato sauce and found that the PV and TBA index increased significantly in tuna.
pH
pH values of raw shrimp, canned shrimp with vegetables and canned shrimp with tomato sauce were 6.27, 6.61 and 6.48 respectively. The higher PH values observed in canned samples may by due to the formation and accumulation of some dibasic amino acid and volatile basic nitrogenous compounds such as NH3 as a result of breakdown and proteolysis of proteins during heat treatment [5]. The pH value of fresh chela chela (Laubuka dadiburjori) fish was 6.8. Drop off pH value after caning process to 5.9 in canned fish [12]. Czerner et al. (2015) [11] studied the effect of canning process on physicochemical of anchovy (Engraulis anchoita) and determined that pH value of fresh fish was 6.07, after canning slightly increased to 6.12.Fatma Arfat (1994) [13] observed that pH values of canned sardine and mackerel products were increased during storage at room temperature due to protein degradation into basic products such as ammonia, amines and hydrogen sulphide. Ghaly (1995) [14] showed that pH values of canned Suze Shrimp and bosr in dry pack or in 3% salt solution were slightly decreased during storage at room temperature for 6 months to 6.25 and 6.30 under the same condition. Abd El-Ghafour (1999) [15] during storage of canned Tilapia fish fillets at room temperature, the highest pH value was found in samples fried and canned in tomato sauce. Ibrahim (1999) [16] noticed a significant increase in pH value of canned sardine packed in oil, while samples packed in sauce showed a decreasing trend as the period of storage at room temperature was extended [12]. Studied the effect of storage period on the quality of canned chela (Laubuka dadiburjori) and found that the PH value 5.9, 6 and 6.2 for 0, 30 and 60 day of storage period.Nutritional Quality
Fatty acid
Aubourg, et al. (1989) [18] reported a slightly higher value in certain fatty acids of cooked tuna. Also observed a significant decrease in C20:5 and C22:6 on cooking of albacore tuna. The cooking process (caning) had a significant effect (P<0.05) on SFA composition in tuna flesh lipids. The content of C14:0, C18:0 and C20:0 significantly changed; however, unsaturated fatty acids remained constant after processing [3]. The SFA, MUFA and PUFA contents of raw tuna were 15.5%, 18.3% and 57.9%, respectively. The major SFA were palmitic (C16: 0), stearic (C18:0) and behenic (C22:0) acids. After caning process, the SFA contents varied from 17.4 to 11.0% with an increase in the duration of cooking. Slightly higher values were noticed in most of the SFA in cooked tuna compared to raw tuna except those cooked for 30 min. However, there were significant losses (p<0.05) in C14:0, C16:0, C18:0 and C22:0 fatty acids in tuna cooked for 30 min. The total MUFA content increased with cooking time from 18.8 to 24.5%. This was mainly due to the increase in C24:1 fatty acid. The PUFA content in cooked tuna was more or less same as that of their raw counterparts. There was no significant decrease (p>0.05) in C20:5 fatty acid, however C22:6 suffered 21% loss (p<0.05). Losses were significant (p<0.05) with respect to C16:3, C18:2 and C20:2 fatty acids [19]. Czerner, et al. (2015) [11] determined the FAs profile of anchovy (Engraulis anchoita) samples taken during the canning process and also of the covering liquid taken after thermal treatment and observed that Steam-cooking mainly affected the MUFAs and ω-6 fatty acids, whose contents were significantly reduced after this operation (p50.01). This decrease could be related to leaching loss, as shown the reduction of fat content after this step and also to lipid damage due to high temperatures. Selmi, et al. (2007) [3] found that a higher content of C18:1w9 and C18:2w6 fatty acids were found in the canned samples following 3 and 6 months of storage at ambient temperature. Canned sardine and tuna were characterized by their richness in linoleic (10.98-11%) and oleic (45.3-44.95%) acids after 3 and 6 months of storage, respectively.
Amino acid
Protein denaturation by heat does not necessarily cause nutritional loss. However, denatured proteins become more reactive and can be easily damaged by interacting with other constituents. The total free amino acids content decreased during tuna canning, especially if over-processing was employed. Domah, et al. (1984) [23] stated that fresh, canned and cooked, mussels are rich in terms of methionine, lysine, cystine, threonine, tryptophan, phenylalanine, tyrosine and arginine when compared to those of beef or FAO reference protein. Also have found that frying or boiling increases the nutritional value of mussels, as demonstrated by our amino acid composition results. It was also reported that the nutritional value of fried canned mussels was high. The analysis of nitrogen balance of raw or canned tuna protein did not show significant differences between raw and canned tuna in digestibility (DC), biological value (BV) or net protein utilization (NPU). The loss in available lysine in the canned tuna appeared to have no influence on nutritional quality [24]. Heat treatment of canning process may adversely affects the quality of food protein through it influence in the protein contents of the individual amino acids. The general trend that observed was slight decreasing in some amino acids in the canned samples. The loss particularly more observed in histidine which decreased by 16.1 to 17.9%, lysine and arginine also showed a noticed decrease estimated by 4.3-7%, 4.4-8.4 % respectively. Sulphur containing amino acids that’s is methionine and cystine showed a reduction accounted by 1.9-3.8 % and 20-4.9 % respectively [5]. Gülgün, et al. (2002) [6] studied the effect of caning process on the smoked mussels of (Mytilus galloprovincialis L) and found that through the smoking and canning processes the relative changes in the content of free amino acids of canned smoked mussels resulted in levels that were reasonably comparable to those of steamed mussels. It’s estimated that water conditions where the mussels were cultivated and the additives used for pre-processing before smoking and canning might have been responsible. Glutamic acid content of mussel meat of (Mytilus galloprovincialis L), before and after canning, was rather high. No negative effects on glutamic acid content due to either smoking or canning were found [6].
Minerals and Vitamins
Some loss in minerals (Na, K, Mg, P, Cu, Fe, Ca) from the muscle into the dipping medium occurs in canned tuna [25]. Gall, et al. (1983) [26] reported that a high fat content in the flesh produced a low loss in minerals, indicating a kind of interaction between both types of constituents. An advantage of fish canning is that bones become soft textured and thus edible, providing an important calcium source [27]. Mineral content of the raw tuna were 3.65±0.7, 124.9 ± 53.2, 116.55±2.6, 1424.75±3.6, 1.55±0.2, 0.65±0.1, 3.2 ±50 and 978.0±1.0 for Ca, Mg, Na, K, Zn, Cu, Fe and P respectively, while in steamed tuna these values were3.75±0.4, 95.35±3.8, 114.25±3.5, 1082.15±4.8, 1.55±0.1, 0.65±0.1, 2.85±0.2 and 835.35±4.0 0 for Ca, Mg, Na, K, Zn, Cu, Fe and P respectively [24]. The heat-labile vitamins thiamine, riboflavin, niacin, pyridoxine and pantothenic acid are the nutrients most damaged by the sterilization process. Varying results have been described for vitamin losses (5-80% for thiamine; 71-73% for niacin; 49-50% for riboflavin) [28].
Histamine
The histamine compounds are formed from decarboxylation of the amino acid, histidine, through exogenous decarboxylase enzymes that produced by the microorganisms related with fish or environment [29]. Veciana-Nogues, et al. (1997) [30] determined that the contents of histamine (HI) (Micrograms per Gram) throughout Canning Process were 0.32, 0.55, 0.40, 0.54 and 0.63 for raw fish, before cooking, after cooking, after packing, and end product respectively. The contents of tyramine (TY) (Micrograms per Gram) throughout Canning Process were 0.32, 0.08, 0.24, 0.17 and 0.15 for raw fish, before cooking, after cooking, after packing, and end product respectively [30]. Histamine poisoning caused by the consuming of fish contains high concentrations of histamine in their flesh [31]. FDA has lowered the histamine defect action level from 100 to 50íg/g and has recommended the use of other biogenic amines related with fish spoilage evaluation [32]. Selmi, et al. (2007) [3] Reported that the histamine concentrations increased significantly during storage period but not exceed the acceptable limits. Although tuna and sardine flesh were slightly affected by the canning process, they remained good sources of w3 andw6 fatty acids.
Microbiology
The Egyptian Organization of Standardizations [33-38] for microbiological aspects of fish products (canned Tuna, canned Sardines, El-Feseekh, salted Sardine, smoked fish and frozen fish), stated that these fish products shouldn’t have Clostridium. E. coli should be not detect in Salted, smoked and frozen fish. Coliform bacteria in frozen and smoked fish should be less than 103, 101 CFU/g, respectively. TVC should not exceed 106 and 105 CFU/g in frozen and smoked fish products, respectively. El-Sherif (2001) [5] found that there was a highly remarkable decrease in the TPC of the tested canned shrimp samples after canning process, Also, the total bacterial counts of canned shrimp with vegetables were higher than those of canned shrimp with tomato sauce, this can be resulted from the spices and some vegetables contaminated with high.Fatma Arfat (1994) [13] reported that canned sardine and mackerel products were found to be free from anaerobic and aerobic thermophilic bacteria during storage at ambient temperature. Therefore, neither Clostriduim perfringes nor Bacillus cereus were detected in the canned samples even after 24 months storage. Abd El-Ghafour (1999) [15] indicated that the TBC of canned Tilapia was gradual increased as the storage period was prolonged. TBC was increased from 0.113 and 0.107× 10³ to 0.230 and 0.213 ×10³ cells/g of steamed canned Tilapia fillets with using either oil or tomato sauce as filling media while was increased from 0.097 and 0.090 ×10³ to 0.190 and 0.173 ×10³ cells/g of fried samples with using the same media through storage at ambient temperature. A high fungi growth was observed in sun dried and smoked chela (Laubuka dadiburjori) after 1 and 2 months of storage compared with canned and frozen chela. This can be from the increasing in water activity and water content [12]. The initial total fungal count of canned chela (Laubuka dadiburjori) was 0.95×10² (CFU Gg-1), these values increased to 1.13×10² and 2.18 ×10² (CFU Gg-1) after 30 and 60 day of storage period respectively. Meanwhile the initial total plate count of canned chela (Laubuka dadiburjori) was increased from 1.44×10⁴ (CFU Gg-1), to 1.88×10⁴ and 2.57 ×10⁴ (CFU Gg-1) after 30 and 60 day of storage period respectively [12] (Figure 1).ConclusionCanned fish products have an economic importance in most countries around the world. During canning process, the bacteria and enzymes inactivated by heat treatment, so the canned fish products have a very long shelf lifetime. Some undesirable effects were occurred during canning process such as loss of essential nutrients, formation of undesirable compounds, browning development and lipid and protein damage which can influence the shelf life of canned products.
To read more about this article:https://irispublishers.com/gjnfs/fulltext/changes-in-fish-quality-during-canning-process-and-storage-period-of-canned.ID.000553.php
For more Open Access Journals in Iris Publishers please click on: https://irispublishers.com/pdf/peer-review-process-iris-publishers.pdf
Indexing List of Iris Publishers: https://medium.com/@irispublishers/what-is-the-indexing-list-of-iris-publishers-4ace353e4eee
Iris publishers google scholar citations:
https://scholar.google.co.in/scholar?hl=en&as_sdt=0%2C5&q=irispublishers&btnG
0 notes
Text
Iris publishers-Global Journal of Nutrition & Food Science (GJNFS)
Survey of Mycotoxin in Brazilian Corn by NIR Spectroscopy-Year 2019
Authored by Carlos Augusto Mallmann*
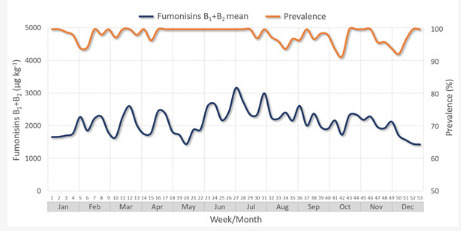
Abstract
Corn is commonly attacked by fungi and mycotoxins. The negative impacts caused by these toxic metabolites justify the use tools that enable constant monitoring and provide a quick feedback. The natural occurrence of mycotoxins, fumonisins B1+B2 (FUM), Aflatoxin B1 (AFB1), Deoxynivalenol (DON) and Zearalenone (ZEN) was investigated through Near Infrared Spectroscopy (NIR) in 3,069 spectra of corn samples from several Brazilian states throughout 2019. FUM was the most prevalent (98.2%) mycotoxin found in this study, followed by AFB1 (20.3%), DON (9.6%) and ZEN (5.9%). The annual average of FUM (B1+B2) was 2,092 μg kg-1 and the average in positive samples was 2,130 μg kg-1, with variations in some periods of the year. The annual mean of AFB1 was low, 1.8 μg kg-1, and the average in positive samples was 8.9 μg kg-1. As well as the prevalence, the concentrations of DON and ZEN were relatively low: 39 and 6 μg kg-1, respectively. These findings show the importance of mycotoxicological monitoring to avoid economic losses and to spare animal health. The use of rapid diagnostic tools, such as NIR, allows decision making in an agile and efficient way.
Keywords: Zea mays L; Aflatoxins; Fumonisins; Online; Monitoring; Risk
Introduction
Corn (Zea mays L.) is one of the most cultivated cereals around the world. It has a relevant role in economy and society due to its high nutritional value and productive potential [1,2]. Brazil is the third major producer of corn, after the United States and China [3]. Most Brazilian states are corn producers, but the largest volume of the cereal is harvested in the mid-west, the southeast and the south regions. Considering the 2018/2019 corn harvest, the leading state was Mato Grosso (31.3%), followed by Paraná (16.7%) and Goiás (11.5%) [4]. The main destination of this commodity is the domestic market, with the animal feed sector being its largest consumer [5].
Brazilian climatic conditions in association with harvest, storage and transport issues, can cause fungal growth and mycotoxin production [6-8]. Corn is widely attacked by fungi and mycotoxins because it is a highly nutritious substrate for their development [9-11]. The main mycotoxins found in Brazilian corn are those of the Aspergillus genus that produce aflatoxins (AFBs), and those of the Fusarium genus which produce fumonisins (FUM), zearalenone (ZEN) and deoxynivalenol (DON) [12,13]. Several studies have investigated these toxic substances due to their global economic impacts and toxic effects in humans and animals [14].
Mycotoxins can cause several deleterious health effects, mainly due to their anabolic, estrogenic, carcinogenic, mutagenic and teratogenic properties [15]. There are approximately two dozen known FUM; however, FB1, FB2 and FB3 stand out for their toxic effects in humans and animals [16,17]. FB1 is the most toxic and abundant of them all, representing about 70% of the total concentration of FUM in naturally contaminated food and raw materials, followed by FB2 and FB3 [18]. In horses, FUM cause hemorrhagic‐liquefactive brain lesions (equine leuko encephalomalacia) [19], while in swine they trigger pulmonary edema [20]. In humans, these toxins are associated with eso phageal cancer [21,22].
AFBs (AFB1, AFB2, AFG1 and AFG2) are currently the most important mycotoxins [23] for inducing a drop in animal performance, in addition to their carcinogenic, teratogenic, hepatotoxic and immunosuppressive risk [24,25]. As a result, AFB1 was classified in class 1 of human carcinogens by International Agency for Research on Cancer (IARC) [26]. ZEN and its biotransformation products are well known for their impact on reproduction parameters, especially in sows [27,28]. Growing animals may show flaws in reproductive parameters and decreased semen quality [29]. DON is associated with digestive problems, causing vomiting, refusal to eat and lesions in the gastrointestinal tract, as well as interference with zootechnical parameters [30,31].
Due to their negative impacts, monitoring of these toxic substances must be continuous. There are several sensitive, specific and reliable analytical methods used in the detection of mycotoxins in feed and food, such as Liquid Chromatography coupled to mass spectrometry (LC-MS/MS) and enzyme-linked immunosorbent assays (ELISA) [32,33]. Currently, optical methods, such as Near Infrared Spectroscopy (NIR) [34,35], have made great headway for being agile and non-destructive technologies [34]. In view of the above, the present investigation aimed to assess the prevalence and average of mycotoxins in Brazilian corn through NIR prediction along 2019.
Materials and Methods
Three thousand and sixty-nine corn samples from ten states of Brazil were predicted throughout 2019. The spectra originated from routine samples predicted through the Olimpo platform, a web service of Pegasus Science Lt da [36], connected to different NIR equipment located in various Brazilian laboratories and industries. The samples were previously ground in a sampler miller with a sieve size of 1mm, homogenized and then read on the NIR equipment.
Subsequently, the corn samples were predicted for the presence and concentration of FUM (B1 and B2), AFB1, DON and ZEN. These assessments resulted in 6,134 predictions of FUM (B1 and B2), 3,069 of AFB1, 3,029 of DON and 2,971 of ZEN, amounting to 15,203 analyses. The LOQ (in μg kg-1) for FB1, FB2, AFB1, DON and ZEN were 200, 200, 5, 350 and 30, respectively. The statistical evaluations were carried out by applying descriptive statistics (mean, range and prevalence) using the Stat graphics® Centurion XV software (Statgraphics Centurion 15.2.11, Manugistics Inc., Rockville, MD).
Results and Discussion
Fumonisins B1+B2 (FUM)
The most prevalent mycotoxin was FUM, being detected in 98.2% of the samples. Its annual average was 2,092 μg kg-1, and the average in positive samples was 2,130 μg kg-1. FUM levels were slightly lower in May and December, around 1,700 μg kg-1, when compared to June and July, around 3,000 μg kg-1 (Figure 1).
In Goiás and Rio Grande do Sul states, the highest average concentrations were identified in the positive samples: 2,950 and 2,898 μg kg-1 in 69 and 691 samples, respectively (Figure 2).
The climate in Brazil is particularly favorable to the development of fungi of the Fusarium genus, which grow and produce FUM still in the field, with its high prevalence known from previous years [37,38]. FUM have received constant attention from researchers and Brazilian agribusiness; although not as toxic as AFBs, they have a higher prevalence in corn. Several studies have reported 90-100% prevalence of FUM in Brazilian raw corn [39-42]. The present data show that more than 90% of the Brazilian corn was contaminated by FUM in 2019. Nonetheless, variations in concentration levels were observed throughout the year.
Aflatoxin B1 (AFB1)
The second most incident mycotoxin was AFB1, being detected in 20.3% of the samples. The mean AFB1 concentration and its weekly prevalence are shown in Figure 3. The annual mean was 1.8 μg kg-1, and the average in positive samples was 8.9 μg kg-1. The prevalence was slightly lower in winter (from June 21 to September 23), but the average concentration did not decrease significantly (Figure 3).
Figure 4 illustrates the average concentration in positive samples with different origin by state and their respective prevalence. The highest prevalence was detected in Mato Grosso state: 263 samples had a positivity of 61.4% with average and positive mean of 5.1 and 8.3 μg kg-1, respectively. The prevalence of AFB1 was inconstant in 2019, with occasional occurrence in the samples of some clients for a few weeks (Figure 4).
The current results are in agreement with earlier reports for Brazilian corn and corn-based products, in which a low frequency of aflatoxin contamination was detected [43-46]. So, this mycotoxin has historically had a low prevalence. AFB1 is produced by fungi of the Aspergillus genus, which has the characteristic of producing the toxin in the grains during the physiological maturation phase [47], harvest, transport, pre-cleaning, drying and storage, when the conditions of humidity, temperature and oxygen concentration are favorable (24). Infrastructure and care during the storaging stage have significantly improved in Brazil, which has caused aflatoxin levels to drop dramatically in the past two decades.
Deoxynivalenol (DON)
DON was detected in 9.6% of the samples, being the third most common mycotoxin in this survey. Its annual average was 39 μg kg-1, and the average in positive samples was 411 μg kg-1. In some weeks of September and December, the concentration was greater than 100 μg kg-1, and there was a prevalence of 20% (Figure 5).
The highest prevalence was identified in the Federal District and in Santa Catarina state: 75 and 61% in 4 and 20 samples, respectively. The average concentration in all samples of these two states was 310 and 238 μg kg-1, respectively (Figure 6).
The low prevalence, ranging from 0 to 20% in more than 90% of the weeks of 2019, is normal for Brazilian corn; according to several studies, DON does not usually affect this cereal at concentrations above 1000 μg kg-1 [46,48]. A higher prevalence was occasionally identified in certain weeks in the samples of some clients. Reports using quantification limits below 350 μg kg-1 have shown a higher prevalence of DON, unlike other institutions that use official methodologies in which the prevalence of DON in Brazilian corn is generally in the range of 10% [49].
The low prevalence, ranging from 0 to 20% in more than 90% of the weeks of 2019, is normal for Brazilian corn; according to several studies, DON does not usually affect this cereal at concentrations above 1000 μg kg-1 [46,48]. A higher prevalence was occasionally identified in certain weeks in the samples of some clients. Reports using quantification limits below 350 μg kg-1 have shown a higher prevalence of DON, unlike other institutions that use official methodologies in which the prevalence of DON in Brazilian corn is generally in the range of 10% [49]. Brazilian winter cereals such as wheat, barley and its derivatives [50].
Zearalenone (ZEN)
The annual mean of ZEN and the average in positive samples were 6 and 58 μg kg-1, respectively, so it was the least prevalent mycotoxin in this survey (5.9%). Its prevalence was greater than 20% in some weeks of January and August. The highest average concentration was in the week between June and July (Figure 7).
In Rondônia, Mato Grosso and Santa Catarina states, 28, 263 and 20 samples were analyzed, respectively; no concentration of ZEN above 30 μg kg-1 was identified. Minas Gerais state had a higher prevalence (33%), but only 6 samples were analyzed (Figure 8).The prevalence of ZEN may be associated with colder climate conditions, as fungi producing ZEN grow at higher temperatures but need oscillations with mild temperatures to activate their secondary metabolism and produce the toxin [51,52]. Historically, ZEN has a higher prevalence in Brazilian corn, ranging from 20 to 30%; however, a lower prevalence was observed in 2019. Toxicologically, ZEN is especially important in pigs and cattle; its occurrence is often associated with reproductive disorders in these species [53,54], so its monitoring is required.
Conclusion
Mycotoxins’ monitoring in corn must be permanent, as heterogeneity of the concentration may vary widely among batches of grains. The use of NIR to predict mycotoxins allows for a quick feedback, and a larger and more frequent amount of analyses may be performed, ensuring greater safety in the use of the cereal in animal and human nutrition.
The most important and prevalent mycotoxins in Brazilian corn presented different profiles of occurrence in 2019. The main findings of the present survey were the high prevalence of FUM, the fluctuating prevalence of AFB1, the point prevalence of DON, and the low prevalence of ZEN. The risk that each mycotoxin offers to the production system can be measured through continuous monitoring of the raw materials used in feed and food production. Besides the average concentration and prevalence of the mycotoxins, aspects related to each animal species such as sensitivity to a given mycotoxin, age and sex, as well as environmental, sanitary, genetic and nutritional factors, must be taken into account.
To read more about this article:
https://irispublishers.com/gjnfs/fulltext/survey-of-mycotoxin-in-brazilian-corn-by-nir-spectroscopy-year.ID.000552.php
Indexing List of Iris Publishers: https://medium.com/@irispublishers/what-is-the-indexing-list-of-iris-publishers-4ace353e4eee
Iris publishers google scholar citations:
https://scholar.google.co.in/scholar?hl=en&as_sdt=0%2C5&q=irispublishers&btnG
1 note
·
View note
Text
Iris publishers-Global Journal of Nutrition & Food Science (GJNFS)
Turmeric
Authored by Çagla Ayer*

Abstract
Abbreviations: HDL: High Density Lipoprotein, SOD: Superoxide Dismutase, CAT: Catalase, GPx: Glutathione Peroxidase, LDL: Low Density Lipoprotein, MetS: Metabolic Syndrome, IL-6: Interleukin 6
Introduction
“Turmeric” or “Indian saffron”, a member of the Curcuma longa L Zingiberaceae family, is a large-leaved, long-lasting herbaceous plant with yellow flowers. Turmeric’s homeland is South Asia; It is widely located in the tropical areas of China, Indonesia, India, Thailand and Africa. Curcumin is a yellow pigmented substance of Curcuma longa. It is generally used as a coloring agent in foods, it is odorless, heat-resistant and contains tetra-hydrocumin, an antioxidant compound. Curcuminoids (curcumin, demetoxicurcumin, bisdemetoxicurcumin) are the main ingredients of turmeric. Curcumin has been reported to have many other pharmacological properties, including anti-inflammatory, antioxidant and antiapoptotic effects [1,2].
Effect on Insulin Resistance
There is clinical evidence that supplementation with curcuminoids improves glucose homeostasis parameters and insulin resistance, and positively alters serum adipokine levels, such as adiponectin and resistin [3]. Curcumin has recently been reported to inhibit the development of diabetes, reduce insulin resistance in vivo, and improve β-cell function. The potential of curcumin therapy against various diabetic complications such as nephropathy, retinopathy and neurochemical changes in the brain stem caused by diabetes has been reported [2]. According to the study conducted with curcumin in individuals with type 2 diabetes, it was determined that lipoprotein A decreased and HDL cholesterol increased after 12 weeks of treatment, and it was determined that it can be used in the treatment of dyslipidemia in individuals with type 2 diabetes [4].
Effect on Obesity
Curcumin has been shown to be an anti-adipogenic dietary bioactive component that is most effective in the early stage of adipocyte differentiation [5]. Ejaz, et al. [6] in a study found that curcumin reduced body weight, inhibited angiogenesis, in adipose tissue, differentiated preadipocytes, reduced hepatic cells and adipocyte fat accumulation. Another study has shown that curcumin inhibits the increase in body weight and total fat mass as a result of a high-fat diet [7]. It has been shown that the animal model of Calebin A, one of the bioactive components of turmeric, inhibits adipogenesis and hepatic steatosis in both in vitro and high-fat diet induced obesity [8].
Antioxidant Effect
With its phenolic structure and β diketone derivative, curcumin has been shown to have protective effects against oxidative stress and its harmful consequences. Curcumin, the antioxidant property of which is almost the same compared to vitamin C and vitamin E; helps to reduce lipid peroxidation by protecting antioxidant enzymes such as SOD, CAT, GPx. In addition, curcumin has been found to be effective in lipid peroxidation as good as α-tocopherol in liposomes [1]. Tripathy, et al. [9] have shown that curcumin protects rats from middle cerebral artery occlusion. In a study carried out by Rattah, et al. [10] rats were given a high fat diet and turmeric extract was given to one of the groups turmeric extract have prevented atherosclerosis, reduced LDL cholesterol. In a meta-analysis study, it has been shown that curcuminoids have an important effect in reducing serum SOD and CAT activities, GSH concentrations and serum lipid peroxides [11]. In another study supporting this result, it was clearly demonstrated that curcumin supplementation improves systemic antioxidant capacity, lipid peroxidation and inflammation biomarkers in individuals with metabolic syndrome (MetS). Similarly, in a previous study in obese individuals with high risk of MetS, it was found that supplementation of curcuminoids with piperine reduced the rate of proxidant/antioxidant levels. Another study in patients with tumors found that an eight-week supplementation with a lecithinised curcuminoid preparation (180 mg / day) have improved serum SOD activities, as well as other antioxidant indices, including serum CAT activities and reduced concentrations of glutathione and thiobarbituric acid reactive species [3].
Anti-Inflammatory Effect
As a result of the inhibition of cycloxygenase and lipoxygenase enzymes in the colonic mucosa with the addition of curcumin to the diet, arachidonic acid metabolism was inhibited and antiinflammatory activity was observed. Studies have shown that turmeric delays the occurrence of inflammatory chemicals such as leukotriene, prostaglandin, tumor necrosis factor and interleukin and reduces their negative effects [1]. In one study, the combined anti-inflammatory effect of powdered turmeric and linden was reported to be as effective as cortisone in carrageenan induced edema [12]. Chuengsmarn et al. [13] have observed that curcumin reduces inflammatory markers, improves glucose metabolism, and in addition reduces weight and waist circumference. The results of a significant reduction of IL-6 with curcumin supplement support the idea that this nutraceutical agent may play a role in suppressing pro-inflammatory pathways associated with different diseases [14]. Curcumin can be used as an immunotherapeutic agent in the treatment of tumor and infectious diseases [15].
Anti-Cancer Effect
Extracts of turmeric plant have been shown to prevent the growth and spread of cancerous cells. In a study, the use of turmeric extracts have been found to have a certain inhibitory effect on prostate cancer cells with high metastases [16]. It has been stated that curcumin causes apoptosis in cancerous cells without damaging healthy cells and prevents tumor growth in animal models and prolongs life in cancerous animals. It has been reported that curcumin has antitumor effect in many cancer types such as mouth, esophagus, stomach, liver, breast, duedenum, colon, prostate cancers. In studies in vivo and in vitro, curcumin has been shown to inhibit carcinogenesis in three stages; it blocks the initiation of the tumor by blocking the metabolic activation of carcinogenic compounds or by stimulating its detoxification. It is also stated that it inhibits the development and progression of the tumor by increasing apoptosis, inhibiting the progression of the cell cycle, enabling control of transcription factors, suppressing the inflammatory response, inhibiting angiogenesis and metastasis, which are important for the nutrition of the tumor [1]. It shows that Calebin A, a component found in turmeric, has a strong anticancer activity against leukemic, myeloid and other cancer cells [17].
As a result, regarding to its anti-inflammatory, antioxidant and anticancer activities, turmeric is a food that has several health benefits. Therefore, it should be included in our daily diet to benefit from its positive effects on health including preventing from diseases and even treatment.
To read more about this article: https://irispublishers.com/gjnfs/fulltext/turmeric.ID.000556.php
For more Open Access Journals in Iris Publishers please click on: https://irispublishers.com/pdf/peer-review-process-iris-publishers.pdf
Indexing List of Iris Publishers: https://medium.com/@irispublishers/what-is-the-indexing-list-of-iris-publishers-4ace353e4eee
Iris publishers google scholar citations: https://scholar.google.co.in/scholar?hl=en&as_sdt=0%2C5&q=irispublishers&btnG
0 notes
Text
Iris publishers-Global Journal of Nutrition & Food Science (GJNFS)
Prevalence of Stunting in Children and Adolescents from Bankura District of West Bengal, India
Authored by Sudip Datta Banik*

Abstract
Under nutrition in children is an important public health issue in India, particularly from the rural areas. The objective of the present study was to evaluate height and prevalence of stunting among school-going children and adolescents. A cross-sectional study was undertaken among schoolgoing children and adolescents from Purulia district in West Bengal, India. The participants were 6 to 9-year-old children (76 boys, 64 girls) and 10 to 17-year-old adolescents (289 boys, 175 girls). Girl children were taller (118.44 cm) than boys (115.72 cm). However, adolescent boys showed higher mean value of height (141.15 cm) than that recorded among girl peers (136.94 cm) with significant sex difference. High prevalence of stunting has been recorded among children (boys 46.10%, girls 43.8%) and adolescents (boys 77.2%, girls 72.0%).
Introduction
Low height-for-age (stunting) in children and adolescents is an indicator of chronic energy deficiency and growth failure [1] that is related to Social-Economic-Political-Emotional (SEPE) inequalities and insecurities [2]. Poor socioeconomic background, inadequate diet, and unhealthy living conditions may cause under nutrition in children and adolescents [3]. The objective of the present study was to evaluate height and prevalence of stunting among school-going children and adolescents from Purulia district in West Bengal, India.
Keyword: Height; Under nutrition; Stunting; Children; Adolescents
Methods
The study was carried out in 2008 in some selected schools at Kashipur in Purulia district of West Bengal. The sampling was not probabilistic. The study has been approved by the institutional committee before the commencement of work as part of a master’s thesis. The parents of the participants gave permission to record anthropometric data from the minors who gave verbal assent. The participants were 6 to 9-year-old children (76 boys, 64 girls) and 10 to 17-year-old adolescents (289 boys, 175 girls). Age of the participants has been recorded from the birth certificate issued by the local government authority and decimal age was estimated from the date of survey. Height was measured to the nearest tenth of a centimeter using a standard stadia meter (Seca, Germany), following standard procedure [4]. Height-for-age Z-scores (HAZ) were calculated using the WHO Anthro and WHO Anthro Plus software and stunting was defined as reported earlier [1]. Data analysis was done using Microsoft ® Excel. Descriptive statistics of age and height (mean values and standard deviation) were calculated and sex difference of characteristics was estimated using Student’s t-test. Prevalence of stunting has been estimated. Statistical significance was set a priori at p < 0.05.
Results
Age (years) and height (cm) showed significant sex differences in children and adolescents except for height in children (Table 1). Girl children were taller than boys. However, adolescent boys were taller than the girl peers. High prevalence of stunting has been recorded among children (boys 46.10%, girls 43.8%) and adolescents (boys 77.2%, girls 72.0%).
Discussion
The present study shows very high prevalence of stunting in children and adolescents from Kashipur in Purulia district of West Bengal. Prevalence of stunting in children from India has been reported to be high [5]. Previous studies from different districts of West Bengal State also reported high prevalence of stunting in children and adolescents. Studies were cross-sectional in nature. Rate of stunting was 51.7% and 48.4% in boys and girls respectively in Barasat and Madhya gram regions near Kolkata [6]. Among Santals (a scheduled tribe) from Birbhum district, children aged 6-10 years were found to be stunted (>60%) [7]. Remarkable stunting (26%) was also recorded among 1 to 14-year-old children from Lodha community (a scheduled tribe) in Paschim Medinipur [8]. Nearly 50% children were stunted among Kora Mudi tribal community in Paschim Medinipur [9]. In Purba, Medinipur district, 9 to 13-year-old Bengali children were stunted (14.6%) [10]. From Hooghly district, a study reported prevalence of stunting (27%) among 11 to 18-year-oldadolescent girls [11]. In Puruliya district, frequency of stunting was also high among 5 to 12-year-old Santal boys (22%) and girls (14%) [12]. Among 5 to 12-year-old children from Darjeeling district, boys had higher rate of stunting (37%) than girls (34.59%) [13]. Another study from Darjeeling district also reported majority of 11 to 19-year-oldboys (55.4%) were stunted and the prevalence was much higher than that recorded among girl (25%) [14]. In conclusion, high prevalence of stunting recorded in the present study shows similar pattern of high-degree under nutrition in school-going children and adolescents reported from other districts of West Bengal that calls for nutrition intervention program.
To read more about this article: https://irispublishers.com/gjnfs/fulltext/prevalence-of-stunting-in-children-and-adolescents-from-bankura-district-of-west-bengal.ID.000559.php
For more Open Access Journals in Iris publishers please click on: https://irispublishers.com/pdf/peer-review-process-iris-publishers.pdf
0 notes
Text
Iris publishers-Global Journal of Nutrition & Food Science (GJNFS)
Review of Salt Reducing and Fertility Improvement in Vegetable Facilities in Saline-alkali Land
Authored by Dong Xiaoxia*

Abstract
High salinity, low soil organic matter content and poor soil structure severely limited vegetables production in saline-alkali area. In vegetable facilities, drip irrigation could significantly induce salt content, improve water and nutrition utilization rate though forming “desalinized soil layer”. Application of organic manure could alleviate salt stress by increasing soil organic matter content, promoting the formation of soil aggregate structure, decreasing pH and increasing nutrients in saline-alkali soil. Application of conditioner on saline-alkali soil could partly improve soil physicochemical properties with decreasing salt content.
Keyword: Desalinized soil layer; Drip irrigation; Organic manure; Soil conditioner; Saline-alkali land; Vegetable facility
Introduction
Saline-alkali area distributed in China was the 3rd largest on earth which is about 99 million hectares (ha). Most of that is distributed at arid area in northwest China (13 million ha) and sea coastal area (8 million ha) [1]. Saline-alkali soil at sea coastal area is disadvantage for the production of vegetables. Soil basic characteristics including high water soluble salt content, low soil organic matter content (<20 g/kg), viscous structure, crusting heavy clay, poor ventilation and high soil density, which induce low soil temperature, water release speed and permeability rate, strong capillarity, inactivity soil aerobic microorganisms [2-3]. Salt tolerance of vegetables planted in facilities is weak that growth of most vegetables would be inhibited when soil salt content is more than 2g/kg. Negative effect on germination rate, seedling time, flowering and fruiting rate, production quality were observed when soil salt content is 2-5 g/kg, and the plants were prone to premature aging, growth point atrophy, poor photosynthesis with smaller leaf area at the later stage [4]. When soil salt content is 6-10 g/kg, symptoms such as nutrient deficient, root growth inhibition appeared and in severe case, roots decay or stems and leaf wither by high salt content. Soil salinity generally results in reduction of 20%-30% on vegetable production, and sometimes more than 50% [5].
Otherwise, lack of freshwater resources is another major limit factor for the development of agriculture in coastal saline areas. Irrigation techniques, such as drip irrigation can effectively enhance yield while save water and fertilizer. Due to the soil types and vegetables species, micro-irrigation and fertilization techniques should be formula according to vegetables uptake water and nutrient.
Discussion
Drip irrigation to leach salt
Field experimental results showed that drip irrigation continuously drips water to form high frequency and small amount of water to leach soil salts, therefore the pulse gradually pushed the salts outward, resulting in the concentration of salt at the edge of the wetting edge. In case of multiple drip heads, the wetting fronts overlap each other that causing the lateral movement of salt to move downward and forming a whole plane of downward leaching salt, so 0-20cm soil become “desalinized soil layer”. After the formation of “desalinized soil layer”, vegetables that requires high amount of fresh water was chosen to plant. The appropriate soil water content should be 20-40 Kpa (close to field water-holding capacity). Through drip irrigation to reduce salt, the salt content in the 0-20 cm soil layer with heavy salinity can be reduced from 7.10 g/kg to 1.64 g/kg, forming the “desalinized soil layer” that can plant vegetable without inhibition [6]. Drip irrigation under plastic mulch in long term avoided salt accumulation caused by chemical fertilizers with flooding irrigation. Na+, Ca2+, Mg2+, SO42-, and Clin soil decreased in negative exponential power function curve with the extension of drip irrigation years and uptake rate of water and nutrients improved significantly in saline areas [7].
Organic manure application
Application of organic manure could alleviate salt stress by increasing soil organic matter content, promoting crumb aggregate formation and decreasing soil pH in saline-alkali soil. Studies showed that application of organic manure was an effective method to improve saline-alkali soil fertility as it could increase soil organic matter, promote the formation of soil aggregates, improve soil structure [8], and reduce soil pH [9]. The result of field experiments and pot trials showed that soil pH significantly decreased and soil salt-exchangeable ion components significantly altered after application of organic manure, while soil organic matter, total nitrogen, total phosphorus and total potassium contents significantly increased on soda saline-alkali soil [10]. Long-term application of organic manure can change the composition of soil aggregate and improve the soil physicochemical properties [11].
Soil conditioner supplication
Soil conditioner could partly improve the soil physicochemical properties and decrease soil salt content on saline-alkali area. It is pivotal to choose best type and amount of soil conditioner for economical and ecological benefits [12-14]. Application of sulfurcontaining conditioner with suitable amount significantly relieved soil hardening and salinity to ameliorate the soil environment for vegetable growth and improve vegetables yield and quality in Tianjin city. Comprehensive input-output was best with applying soil conditioner of 2.25-3 t/ha [15].
It was utilized to saline-alkali soil amelioration by spraying the compound microorganism based on the coordinated degradation of organic matrix. With 5:1 ratio of organic fertilizer to soil, application with compound microorganism composed by bacillus licheniformis, pseudomonas, flavobacterium and sphingomonas with ratio of 1:3:3:1 in 0.5% concentration could enhance the utilization capacity of soil organic matter and significantly increase the number and diversity index of soil microorganisms. Vegetables biomass increased by 30.2% compared to organic fertilizer treatment after 50d growth experiment [16].
Conclusion
Saline-alkali land are back-up resources for arable land to guarantee increasing food demand of increased population, therefore, it is worthy to systematic study in future. Saline-alkali soils in vegetables facilities formed “desalinized soil layer” through drip irrigation. Vegetable yield could be increased through application of organic manure, soil conditioner containing mineral or microorganism by increasing soil organic matter content, promoting soil aeration and crumb aggregate formation, and reducing soil pH. Furthermore, studies is necessary on soil salt reducing, fertility improvement and integrating approaches on water and fertilizer in vegetable facilities at coastal saline-alkali land.
To read more about this article:https://irispublishers.com/gjnfs/fulltext/review-of-salt-reducing-and-fertility-improvement-in-vegetable-facilities-in-saline-alkali-land.ID.000557.php
For more Open Access Journals in Iris Publishers please click on: https://irispublishers.com/pdf/peer-review-process-iris-publishers.pdf
Indexing List of Iris Publishers: https://medium.com/@irispublishers/what-is-the-indexing-list-of-iris-publishers-4ace353e4eee
Iris publishers google scholar citations:
https://scholar.google.co.in/scholar?hl=en&as_sdt=0%2C5&q=irispublishers&btnG
0 notes
Text
Iris publishers-Global Journal of Nutrition & Food Science (GJNFS)
Perspective Application of the Circular Economy in the Blue Biotechnology: Microalgae as Sources of Health Promoting Compounds
Authored by Igor Fernandes*

Introduction
Algae belong to a wide range of photosynthetic organisms that grow in aquatic environments (rivers, oceans and lakes) [1- 3]. They are commonly classified into microalgae (unicellular and simple multicellular structures) and macroalgae (complex multicellular structures) depending on their size and cellular organization. Microalgae are microscopic single cells which may be prokaryotic (e.g. cyanobacteria) or eukaryotic (e.g. green algae) [1- 3]. Furthermore, they are photoautotrophic microorganisms with the ability to use solar energy, reduce inorganic carbon to organic matter and producing biomass simultaneously [4].
Additionally, they are a good source of biochemical compounds, such as, polysaccharides, lipids, proteins, vitamins and pigments, which can be extracted through several conventional techniques (e.g. maceration, aqueous and Soxhlet extraction) [1,3,5]. Finally, the existence of natural products with strong antioxidant activity augments the economical and nutritional potential for food, pharmaceutical, and nutraceutical industry [1].
The trend in microalgal market is the production of biomass as a source of added value compounds [1,2]. The biomass can be used in several fields, like development of cosmetics for the treatment of skin disorders (e.g. aging and tanning), production of bioactive compounds in pharmaceuticals (e.g. vaccines that can be administered orally), production of low-cost natural-based biofertilizers and manufacture of biofuels (e.g. biodiesel, bioethanol and biohydrogen) [1,2]. Microalgae are crucial for human health as they are a source of polyunsaturated fatty acids (PUFA), which have shown to be effective in the prevention and treatment of several diseases [6]. PUFAs, especially omega 3 PUFAs (α-linolenic acid: C18:3n-3; EPA: C20:5n-3 and DHA: C22:6n-3), are widely used in the prevention and treatment of cancer, type 2 diabetes and several cardiovascular diseases [6].
Agro-Industrial Residues
Nowadays, there is a worldwide interest in the production of microalgae combined with agro-industrial residues, to reduced costs and promote circular economy, however this is an area that requires further development [7]. Additionally, the exhaustion of fossil fuels and the effects of global warming has increased the interest in renewable sources that could replace non-renewable energy (e.g. cropping residues, sugar beet bagasse, cardoon-waste, tomato-waste, spent coffee-grounds, [8] cheese whey and corn steep liquor [9]).
Agro-industrial residues consist of lignocellulose, a compact and partly crystalline structure, which is a combination of linear crystalline polysaccharides (e.g. cellulose), branched non-cellulosic and non-crystalline heteropolysaccharides (hemicelluloses) and branched lignin (non-crystalline) [10]. The agro-industrial residues can be used by several industrial fields since they are cheap, abundant and can provide environmental and economic benefits [10]. When discarded in the environment, these by-products release a large amount of nutrients (considered inorganic pollutants), such as, nitrogen and phosphorus [9]. These environmental disposal problems can be used as an alternative culture medium in the production of microalgae [10,11]. Furthermore, it is possible to obtain algal biomass with significant added value that could be used in the manufacture of several pharmaceuticals, cosmetics and nutritional supplements [9,13]. One of the limitations is that most microalgae cannot directly ingest and assimilate these residues, because of their complex composition (e.g. polysaccharides, proteins and fatty acids) [14]. Therefore, the transformation and modification of these agro-industrial residues may be required, which is fulfilled through physical (e.g. milling [10]and muffle furnace [15]) chemical (e.g. use of organic solvents [16]) and enzymatic processes [13,17] resulting in easy to-assimilate hydrolysates [14].
Several studies have the purpose of determining the efficiency of agriculture and industry residues on the growth of different species of microalgae. For example, Chlorella vulgaris was cultured in cheese whey (CW, 10 gL-1 lactose), 1% corn steep liquor (CC) and 2% vinasse (CV) under autotrophic (CA) and mixotrophic conditions to determinate the biomass, protein and carbohydrates content [9]. C. vulgaris cultivated in a culture medium supplemented with 1% CC showed the maximum biomass concentration (2.10 gL- 1), whereas in a culture medium supplemented with CW vinasse exhibited a significant decrease in biomass (1.60 gL-1 and 0.77 gL- 1, respectively) [9].
C. vulgaris cultured with CC has achieved the highest protein content (43.33%) whereas with the other by-products obtained a half-protein content (CW: 23.20%; CV: 22.23%) [9]. Conversely, C. vulgaris cultured with CW obtained a higher carbohydrates content (44.85%) than CA and CV (39.34% and 36.50%, respectively) and a double the amount of carbohydrates compared to CC (25.41%) [9].
Additionally, C. vulgaris was cultivated under photoautotrophic and mixotrophic conditions using a hydrolysed cheese whey powder solution to evaluate the maximum biomass production and the content of lipids, carotenoids and pigments [13]. Results shown that C. vulgaris cultivated under mixotrophic conditions presented biomass content with a 2.9-fold increase compared to photoautotrophic conditions (3.58 gL-1 and 1.22 gL-1, respectively) [13]. On the other hand, C. vulgaris cultivated under photoautotrophic conditions has given higher levels of lipids, pigments and carotenoids (42%, 0.74% and 0.23%, respectively) [13].
The potential of industrial cane molasses as a carbon source for the growth of Chlorella zofingiensis was studied under heterotrophic conditions to determinate the lipids, ketocarotenoid astaxanthin content, and fatty acid profile [18]. According to the results, C. zofingiensis cultured with different concentrations of pre-treated molasses achieved a biomass, lipid and astaxanthin productivities of 1.55 gL-1 day-1, 0.71 gL-1 day-1 and 1.7 mgL-1 day-1, respectively [18]. Besides the fatty acid profile of C. zofingiensis has higher levels of polyunsaturated fatty acids then monounsaturated fatty acids and the highest percentage of polyunsaturated fatty acids (49.16%) was obtain with the concentration of 5 gL-1 sugar [18]. Furthermore, palmitic acid, hexa-decadienoic acid, oleic acid, linoleic acid and α-linolenic were the major fatty acids presented in C. zofingiensis profile and represented more than 85% of total fatty acids [18].
The efficiency of two organic carbon sources, residual corn crop hydrolysate and corn silage juice on the growth, were studied (biomass and lipids content and fatty acids profile) under heterotrophic, photoautotrophic and mixotrophic conditions in a bacteria-Chlorella sp. Consortium [14]. Results shown that maximum microalgal biomass (0.8 gL-1) was obtained with 1 gL-1 of residual corn crop hydrolysate whatever the trophic conditions [14]. Under mixotrophic conditions, the use of residual corn crop hydrolysate led to an increase of 21 and 22% in the biomass produced in comparison to silage juice [14]. Additionally, this increase varied between 11 and 28% under heterotrophic conditions [14].
Chlorella sp. cultured under photoautotrophic conditions accumulated almost 30% of total lipids, which was higher than under heterotrophic and mixotrophic conditions (7% and 15%, respectively) [14]. According to the fatty acid profile, Chlorella sp. presented the highest concentration of fatty acids under mixotrophic conditions in residual corn crop hydrolysate (15.5 mg g-1 dry weight) whereas the lowest was under heterotrophic conditions with silage juice (0.21 mg g-1 dry weight) [14]. Under photoautotrophic conditions, the major classes of lipids in Chlorella sp. fatty acid profile were palmitic, gamma-linolenic and α-linolenic fatty acids, which represented almost 90% of the total fatty acids measured [14]. In mixotrophic and heterotrophic cultures the relative composition of the major fatty acids diversified, as palmitoleic, stearic and oleic acids were not detected [14].
In another study, Chlorella vulgaris and Scenedesmus quadricauda were grown in absence and presence of different humic-like substances extracted from agro-industrial wastes (digestate from the waste of an agro-livestock farm (D-HL), oil extraction residues from rape B-HL, Brassica napus and tomato residues (T-HL)) to evaluate their biomass, lipids, carbohydrates, chlorophylls content and fatty acid profile [14]. The cultivation of C. vulgaris and S. quadricauda in a culture medium supplemented with 100 mgL-1 of D-HL led to an increase in the biomass compared to BG11 (control) culture medium with 41% and 31% for C.vulgaris and S. quadricauda, respectively [16]. On the other hand, the cultivation in 100 mg L-1 of T-HL produced 29% and 21% fold increase for C. vulgaris and S. quadricauda and all other cases the biomass production was not significantly different [16]. The total lipid content of both species increased in the presence of HLs under all experimental conditions [16]. Besides that, C. vulgaris cultured with B-HL (both concentrations) and D-HL2 presented a 10% decrease in comparison with the control [16].
In S. quadricauda, the presence of the HLs induced an increase of the lipid content, with significant higher values than observed for the control [16]. Furthermore, for both species, B-HL (both doses) led to an increase of the total carbohydrate content compared with the control [16]. Regarding the monosaccharides, in C. vulgaris the treatment with B-HL1 and B-HL2 induced an increase in the glucose content (19.18% and 17.79%, respectively) compared with control (15.27%).and a large increase in galactose content [16].
Moreover, the treatment with B-HLs led to a similar behaviour at both concentrations regarding glucose, whereas an increase in galactose and xylose was obtained only at the lowest and highest concentrations, respectively [16]. Furthermore, B-HLs led to an increase in both chlorophylls a and b in both species, in comparison with the control [16]. Contrarily, treatment with D-HLs and T-HLs induced, in general, a decrease in the total carbohydrates and chlorophylls content for both microalgae [16].
Regarding C. vulgaris cultivated in BG11, the fatty acid profile contained mainly palmitic (34.5%), oleic (11.7%), stearic (7.6%), linoleic (5.87%), elaidic (5.47%) and alpha-linoleic (4.41%) acids [15]. The treatment with D-HLs and T-HLs led to a reduction in the palmitic, stearic and oleic acids and simultaneously increased the quantity of linoleic and alpha-linoleic acids [16]. On the other hand, treatment with B-HLs induced an increase in linoleic acid content and a decrease in palmitic and stearic acids [16].
With respect to S. quadricauda cultivated in BG11, it contained mainly palmitic (23.44%), oleic (12.42%), alpha-linoleic (10.86%) and linoleic (8.85%) acids [16]. In S. quadricauda, the treatment with D-HLs increased the unsaturated fatty acids (gamma-linolenic, alpha-linolenic and linolenic acids) relatively with the control [16]. Moreover, with the addition of B-HL1 it was observed an increase of the saturated fatty acids, particularly palmitic (24.01%), behenic (2.41%), myristic (1.93%) and stearic (1.37%) acids [16].
Conclusion
Nowadays there is an increasing demand to produce microalgae due to the production of high value compounds. Furthermore, these microorganisms can assimilate, in some extend, inorganic pollutants that are produced by agronomical industry and therefore promote a circular economy. Agro-industrial residues are considered one of the largest sources of wastes in the world, which could release a large amount of inorganic pollutants that promote the deterioration of the environment and the loss of potentially valuable materials. These residues are constituted by several minerals, such as, magnesium, iron and potassium which are important to human health.
The production of microalgae using agro-industrial wastes can be considered as a feasible strategy to mitigate the environmental problems caused by the disposal of these residues and decreasing the production costs of microalgae biomass. Furthermore, agroindustrial residues are widely abundant and inexpensive, making them an ideal material to increase the nutritional potential of microalgae for the food, pharmaceutical and nutraceutical industries.
To read more about this article:
https://irispublishers.com/gjnfs/fulltext/perspective-application-of-the-circular-economy-in-the-blue-biotechnology.ID.000551.php
Indexing List of Iris Publishers: https://medium.com/@irispublishers/what-is-the-indexing-list-of-iris-publishers-4ace353e4eee
Iris publishers google scholar citations:
https://scholar.google.co.in/scholar?hl=en&as_sdt=0%2C5&q=irispublishers&btnG
0 notes
Text
Iris publishers-Global Journal of Nutrition & Food Science (GJNFS)
Prospects and Challenges of Postharvest Losses of Potato (Solanum Tuberosum L.) in Ethiopia
Authored by Abebe Chindi Degebasa*

Abstract
Potato is known as a semi-perishable commodity and storage of both seed and ware potatoes which is problematic for most producers and consumers. The losses could be occurred during harvesting, sorting, cleaning, handling and packing, transportation, storage, distribution or marketing and processing. In Ethiopia most of the potato produced is mainly consumed as boiled, salad and stew preparations. Use of alternative recipes like french fries, crisps, flakes, flours, starches, pre-peeled potatoes and various snack food items has not developed well. Thus, the study was conducted to evaluate improved seed and ware potato storage, local farmers’ practices such as; storing under bed, storing in pit and extended harvesting for resource poor potato growers in central highlands of Ethiopia. The experimental design was complete randomized design (CRD) with three replications using two improved potato varieties. Improved ware potato storage diffused light store (DLS) were demonstrate to farmers through farmers field school (FFS) and farmers research group (FRG) participatory research approaches. FFS and FRG were organized from four districts and regular assessments were done for 105 days of storage period. From this study non-significant storage losses were observed. However, for the qualitative data, there were significant difference between the improved and the farmer’s/local storage practices in terms of taste, color change, sprouting and pest infestation.
The result revealed that storing potato on the ground under beds exposes the tubers for rapid sprouting, color and taste changes within few days. Especially in Haramaya district the tubers stored in the ground pits, according to the farmers practice, have rotten and excessively sprouted almost totally unlike the ones put in improved structures. On the other hand, extended harvesting has exposed the tubers for pest infestation. Even though, it is possible to use potato for ware through extended harvesting for some months, the losses due to pest infestation was extremely high. Thus, extended harvesting and other farmers’ practices are not effective for handling ware potato for long-term storage. It seems that the introduced improved seed and ware potato storage were the only effective option for potato grower farmers in central highlands where the temperature and relative humidity are suitable using locally constructed storage structure. Therefore, it was with great enthusiasm that the participated farmers highly interested with this improved practice and accepted to use the improved seed and ware potato storage structures for prolonged time and exploits the potential of this crop for food and nutrition security.
Keywords: Postharvest; Farmers field school; Farmer research Group; Ware potato storage
Introduction
Potato (Solanum tuberosum L.) ranked as the third most important food crop following rice and wheat and is consumed by over a billion people throughout the world [1,2]. Potato serves as a food and income security source and provides important nutrients. Potato has a high content of carbohydrates, significant amounts of quality protein, and substantial amounts of vitamins, especially vitamin C [3]. Potato production is expanding strongly in many developing countries accounting for more than half of the global harvest [4]. In Ethiopia, root and tuber crops are the third largest national food commodity, after maize and wheat, in terms of production [5,6]. Potato promises higher calorie per unit area production potential than any grain and can be produced, stored, and consumed without major technological inputs. Recent trends indicate that potato production in densely populated developing nations is on the rise [7]. According to [1] half of the total production occurs in developing countries that makes potato the third most important food crop globally [8,9] suggested that the high yield potential of potato per hectare of arable land, good nutritive value, and cooking versatility have resulted in a threefold per capita potato consumption in the developing world, from 6 kg capita_1 year_1 in 1969 to 18 kg capita_1 year_1 in 2009. The crop’s short cropping cycle allows it to serve as a hunger-breaking crop, and makes it suitable for intercropping and double cropping, especially in cereal-based production systems in Africa and Asia [10,11].
However, production of potato tuber is constrained by pre-harvest factors and postharvest losses, which in turn limit the volumes of good quality, produce reaching consumers [12] reported that potato is a source of food and cash income, playing an important role in the rural livelihood system of the densely populated highlands of sub-Saharan Africa. Ethiopia is one of the major potato producing countries in Africa as 70% of its arable lands in the highlands are suitable for potato production [13]. Potato being cultivated for more than 150 years in Ethiopia, it grows dominantly in the Northern Central and Eastern highlands of the country [12] and the recent reports of [14] stated that its production area has reached about 0.3 million ha producing more than 3.66 million tons in both Meher and Belg seasons.
According to [15], in 2017, potato yielded up to 20 tons/ha worldwide on average, whereas maize, rice and wheat had an average yield of 5.7 tons/ha, 4.7 tons/ha and 3.5 tons/ha, respectively. Potato is one of the most productive food crops, producing more dry matter (food) per hectare than cereals or any other cultivated plant. As such, it can significantly contribute to food and nutrition security. A hectare of potatoes provides up to four times the calories of a grain crop and up to 85% of the plant is edible human food, compared to around 50% in cereals. Potato produces more food per liter of freshwater used through irrigation than cereals and thus is more sustainable to mitigate the effects of climate change. Over the past 20 years, potato production has significantly increased in developing countries in Asia, Africa and Latin America by 89, 14.5, and 4 million tons, respectively. In Africa, the potato production and harvested areas more than doubled over the last 20 years. Average potato consumption in East Africa has grown by approximately 300% over the past two decades, yet yields are low. The major bottlenecks to higher potato yield and reliable supplies in Africa are limited or no access of farmers to high quality seed tubers of improved varieties, poor crop husbandry practices (e.g. disease and soil fertility management), and poor post-harvest management [16]. A promising alternative to traditional clonal propagation of tetraploid potatoes is the production of hybrid true potato seeds: planting 10 hectares, for instance, takes just 200 grams of easily transported true seeds, compared with 25 tons of perishable seed-tubers. It was introduced in Africa at the end of the 17th century by Christian missionaries through the formation of small plantations. Soon after, potatoes quickly became part of the feeding habits of both rural and urban populations. As in Europe, potato production could contribute in the fight against food insecurity in the sub-Saharan African countries [17].
So far, different attempts have been made to come up with an appropriate agronomic and pre-harvest management to increase potato tuber productivity in Ethiopia [18-20]. The major constraint of potato production in Ethiopia includes poor quality seed, poor agronomic practices, poor pre and post-harvest handling, marketing and transportation systems. The percentage losses of potato due to post harvest handling are estimated to be 20-25% [21]. Potato production is seasonal, and it lack proper storage methods such as cold storage. In agriculture sector, a lot of emphasis has been put on research and development of agriculture production and fewer resources in post-harvest development. Potato is a bulky and fleshy crop with a short storage life therefore needs careful handling, packaging and storage. In Ethiopia, post-harvest losses of horticultural crops may be estimated for about 15 to 70% at various stages [18]. Potato is known as a semi-perishable commodity and storage of both seed and ware potatoes which is problematic for most farmers, as storage losses can reach 50% and sometimes higher [22]. Lack of proper storage systems are among the main factors contributing to the low yield of potato in the region, which is the case at the country level also [23]. Furthermore, market price of the product and marketing systems are also problematic [24]. According to [25] unavailability of proper potato seed storage forces the farmer to sell immediately during harvest with low price, whereas availability of proper storage facilities allow farmers to sell their potato tuber as a seed during planting or in the later season with higher price compared to the immediate sell.
Farmers stored potato either for seed or ware using various traditional storage mechanisms. These traditional storage facilities do not allow the growers and consumers to store potato not more than three and half months without deterioration [24]. However, farmer requires good storage either to use tubers of their own harvest as a seed source to postpone sales to get better market price and for household consumption in the later season. Hence, improving food security requires a comprehensive approach towards post-harvest managements using new strategies and/or technologies to ensure the higher value of post-harvest produces. Therefore, the major post-harvest losses of potato and its strategy to mitigate the problem were described.
Major potato post-harvest losses
In the absence of storage technologies for seed and ware potatoes, farmers keep potato harvest in the field for extended period in Ethiopia. This practice exposes the tubers for insect attack which reduces tuber yield and quality significantly. A study on extended harvesting period in Alemaya revealed that yield of marketable tubers was reduced by 60% when tubers were harvested at 210 days after planting as compared to a harvest at 120 days [26]. Similarly, [27] reported significant yield reductions (70-100%) when harvesting was delayed from about 125 days to 230 days after planting. Estimates of the production losses in developing countries are hard to judge; but some estimate the losses of potatoes, sweet potatoes, plantain, tomatoes, bananas and citrus to be very high. About 30-50% of the total produce (1.3 million tons) is lost after harvest. Globally, horticultural crops postharvest losses have been reported at 19% for the USA at an estimated annual loss of $18 billion [28]. Higher losses have been reported for African countries ranging between 15%-30% of the harvested product [29].
Post-harvest losses are mainly caused by different physical, environmental and biological factors which include mechanical injuries, extreme temperatures and pathogens [30]. According to [31], the causal factors enhance post-harvest losses through changes in the chemical composition and physical properties of the tuber in the process of respiration, loss of moisture from the tuber, sprouting, and spread of diseases. In the light of the little information generated on the major factors of post-harvest losses in Ethiopia, some of the principles in post-harvest management and the basic environmental and physiological causes of post-harvest loss are discussed as below.
Physical, biochemical and physiological losses
Physical losses include the various responses of tuber to excessive or insufficient heat, cold, or humidity. Proper storage is required to allow ventilation and heat exchange to maintain proper temperature level, to reduce the air and gas exchange (oxygen, carbon dioxide, and ethylene) and to minimize water loss. Losses caused by mechanical injury are usually overlooked. Physical injury is a loss by itself, and it can result in secondary physiological and pathological losses. Mechanical injury can occur at hilling, harvesting, and handling operations such as grading, transporting and marketing. Among tubers from the same cultivar, the degree of damage is influenced by the dry matter content and turgidity of the tubers [32]. High dry matter content causes higher braising. Good level of care is needed during harvesting and handling operations to minimize damage caused on tubers. The damaged tuber always has a shorter post-harvest life than the undamaged tubers [32].
Respiration
Potato tubers respires using sugars converted from starch. Therefore, respiration reduces the starch content of the tuber. During respiration, the tubers use oxygen from the air and produces water, and carbon dioxide and heat. The most important effect of tuber respiration is the production of heat and its subsequent effect on storage temperatures and the action required to control it [32]. If the respiratory heat is not removed, the temperature of the potatoes rises by 0.25 °C per 24 hours. The rate of respiration is dependent on the temperature and is minimum at about 5 °C. Tubers that are stored at relatively higher temperature lose their moisture after some time and become unfit for consumption or for prolonged storage as seed for the coming season planting. The problem was observed in seed potatoes stored in diffused light store (DLS) at Shashemene area. Fresh weight of tubers is considerably reduced in storage both due to respiration and water loss. It was observed that mean tuber weight loss as high as 23% was recorded when potatoes were stored in naturally ventilated storage for 120 days (Table 1). The tubers were dry due to excessive moisture loss and they were not suitable for planting after 6 months. This was due to relatively higher temperatures and dry air that enhances respiration and consequently desiccates the stored tuber.
Loss of moisture
Water is lost from tubers by evaporation. The rate of loss of water is highly affected by the weather condition of the location and it is proportional to the water vapour pressure deficit, i.e. the drying power of the surrounding air [32]. The potato can lose moisture rapidly if it is immature, wounded and unhealed and sprouted. Immature tuber loses water more rapidly because of its more permeable skin and increase in water loss when sprouting starts because the surface of sprouts is more permeable to water vapour
Loss in dry matter content
Tuber respiration during storage results in dry matter losses. This amounts to 1-2% of fresh weight in the first month and about 0.8% per month thereafter until sprouting is well advanced when dry matter loss will amount to 1.5% per month [32]. Temperature and humidity of storage have an effect on the dry mater in relation to the water content and changes in specific gravity of the tubers. Potatoes stored at relative humidity of 83-84% show increase in specific gravity during storage at both 4.4 and 12.8 °C. At 90% relative humidity, however, the specific gravity of tubers remain practically unchanged in storage up to 6.5 months at 4.4 °C and 10 °C [33]. Similar result was obtained in ventilated ware storage with internal temperature for 120 days ranging between 3.6 and 7.8 °C and relative humidity of 86.6-87.0% at Holetta (Table 2). Nevertheless, respiration, sprouting, loss of moisture from the tuber and pathogenic losses have mostly a direct influence on the dray matter content and thus on the use or processing quality of the tuber [34].
Sprouting
Generally, tubers are dormant at harvest. A very important point related to successful storage is an understanding of dormancy and sprouting. The tuber has a definite life cycle. Following field maturity, the tuber remains dormant for a specific period of time which varies with variety and the influence of the crop growing and storage conditions. Maturity at harvest time influences the degree of sprouting. Stresses at any of these stages reduce tuber natural dormancy. Damaged and diseased tubers sprout sooner than healthy ones. It has already been noted that once dormancy ends, sprout growth leads to increased respiration and moisture loss from the tuber via sprout tissue. The higher the temperature over a range of about 4°C to 21°C, the shorter the dormancy period. The most critical temperatures are between 4°C and to 10 °C. However, it is possible that tubers stored first at low temperature followed by storage at 10 °C, could have a shorter dormant period than following continuous storage at 100°C.
The number of sprouts per tuber, which determines the number of main stems per plant, is influenced by variety, tuber size and the degree of apical dominance [35]. In a given variety, the degree of apical dominance is influenced by storage conditions, particularly temperature (Table 3). Sprouting directly affects quality of ware potato presumably due to its enhancing effect on water and respiratory loss.
Pathogenic losses
Post-harvest attack by microorganisms can cause a serious loss. Post-harvest diseases can start prior to harvesting in the field, at or following harvesting through wounds. Insects and rodents may cause additional pathogenic losses. The potato tuber moth causes the most serious damage in the store. The larval damage causes direct weight loss and the wounds lead to secondary infection by microorganisms. During storage, aphids can attack the young sprouts and shoots, and they can disseminate certain virus diseases, especially potato leaf roll virus (PLRV). Quantitative pathogenic losses result from the frequently rapid and extensive breakdown of tissue for example, fungal and bacterial attack which is followed by massive attack by secondary organisms. This mostly is the prime importance in storage and can cause substantial damage.
Storage Methods
Traditional storages
In Ethiopia potatoes are basically stored for two reasons: ware and seed. Farmers use different traditional potato storage system depending on the use. However, these storage facilities are not proper to keep the quality of tuber for more than 1-2 months. As a result, farmers are forced to sell their potatoes at low prices during harvest. They buy seed potatoes at a very high price at planting. Some farmers store seed potatoes either in burlap sacks or in dark rooms, which result in the formation of long and etiolated sprouts that break easily while handling and during planting. Storing seed potatoes in diffused light stores (DLS) results in the formation of shorter and sturdier sprouts than storing in the traditional dark storage method or in burlap sacks. Potato seeds stored in DLS have better emergence, more uniform growth and better plant establishment, resulting in higher tuber yield than seed stored in the traditional storage.
At Holetta, potatoes stored in burlap sack produced smaller sprouts and lost higher weight than those stored in either 2, 3 or 4 layers on shelves of DLS. Potatoes stored in multi-layered burlap sacks produced less number of sprouts per tuber. These results were confirmed by research carried out at Alemaya where storage of seed tubers in dark resulted in a higher weight loss than storage
in DLS. Field (underground) storage is commonly used in the highland area. Farmers leave their potatoes underground for prolonged use by piece-meal harvest which also helps regulate the low market price they often encounter at peak times and improve their use for consumption. This is the most common storage system of farmers both for ware and seed potatoes, but it is preferred most for ware due to high dry matter. It can keep up to 4 months in cool highlands. However, this extended method is challenged by untimely rainfall that hastens tuber rotting, tuber moth problems causing considerable yield loss, and tuber infectious diseases that degenerate the tubers. Floor storage (piling potatoes in the room on the floor) is used both for ware and seed purpose which helps to keep the potato up to 2-3 months in cooler areas. Storage on raised bed, locally called ko’t or alga, is usually used to keep potatoes for seed. Storing potatoes in pit in which the wall is made from mud and roofed with straw is exercised to keep ware potato for 1-2 months.
All the methods used by farmers had considerable quantity and quality loss (Table 4) to ware and seed potatoes. Nearly all the major physical, physiological and disease problems that cause loss were not effectively controlled or regulated adequately. The problem is very critical in affecting seed quality and subsequent performance of the crop in the field. The seed quality is thus the most pressing factor in the potato enterprise. In general, farmers have no appropriate facility for package, transport, and storage. Thus, they cannot keep stock to reduce post-harvest loss and reduce price fluctuation in order to obtain better price.
Diffused light stores (DLS)
The potato tuber which is to be used as seed has to be stored and prepared for planting so that it retains its vigor, remains healthy and in insect-free condition up to the time of planting. Although this can be done in costly refrigerated storage, the need of the household and small-scale producer or enterprise demand a low -cost alternative technology. After complete growth of the potato crop in the field and before ready for planting, the tuber enters a period of rest known as dormancy. During dormancy the tuber is relatively easy to store. However, once dormancy ends and sprouts growth commences, unless planting is done shortly after wards, sprouting must be controlled to protect the tuber from becoming exhausted, infecting with virus and damage by insect. Seed tuber storage must include, therefore, a way of controlling the growth of the sprouts and other pests.
The diffused light storage is a very simple and low cost structure which allows the diffusion of daylight and free ventilation (air circulation) inside the storage that helps to suppress the elongation of sprouts as opposed to dark storage. It helps to maintain seed quality for a long time in areas where prolonged storage is a must. Observations made at Holetta indicated that tubers could be stored a long as 7 months without considerable depreciation of seed quality. The storage performance, however, was noted to vary depending on variety [36]. According to the results, tuber weight loss, time of dormancy break (sprout initiation), sprout number and length varied depending on variety (Tables 5&6). In general, decisions and actions on whether or not to store potatoes and how to store them must depend up on circumstances of individual cases. Therefore, the choice or recommendation of a given method should better be made using research information and knowledge on the influence of storage variables on the quality of the stored potatoes and on storage losses in the desired storage time. Therefore, the low-cost diffused light store (DLS) for seed tubers developed by CIP has been evaluated under the Ethiopian condition. It was found to be very useful and efficient storage technique. Consequently, it has been adopted by many potato farmers’ in many parts of the country [37] reported that, 87% of the central part and 25% in the north and western are using DLS to store their improved potato variety seed. The authors reported that, in DLS tubers can be stored 8-9 months without much loss. It can also produce 3-4 sprouts, which are green and strong consequently that will produce high yield.
Ware potato storages
The effect of sun and radiant heat on the storage interior should be avoided by including resistance to these effects so that the desired cool condition is maintained. This is because consumption potatoes (ware potatoes) must be kept in dark to prevent greening of tubers. The high-water content and rich carbohydrate is conducive for spoilage through respiration and pathogen attack. Therefore, the inside temperature is maintained at low level. All specialized stores or storage structures should have a roof space of not less than 1 m wide to shade walls from high hot sun. Buildings should be placed, if possible, with the long axis east to west. This can be modified by the need to place a long side across the prevailing night wind so as to allow natural ventilation.
The above describe naturally ventilated ware potato storage has two compartments. Potatoes are stacked at the height not exceeding 1.5m. The wall is made up of mud with a thickness of not less than 10cm. To avoid crack formation, the mud must be well fermented and stabilized with straw. Following the night wind direction, the stores are constructed with air inlet and outlet openings. These are opened during the night from sunset to sunrise to allow air circulation, exhausting the day’s heat due to respiration of the stacked potatoes and cooling it with the lower night temperature. The roof slope in one direction and covered with straw.
Matured potatoes are much more desirable for home consumption as well as processing than less matured ones. Therefore, ware potato should be harvested at full maturity stage when the soil is slightly moist to prevent tuber abrasion and to avoid tuber damage. All potatoes showing greening, any decay or damage are rejected for storage. Tubers showing disease symptom and any other mechanical damage are unfit for storage; therefore, such tubers are carefully separated and avoided. The harvested potatoes must be cured to repair any skin injuries and to promote the formation of stronger epidermis to reduce water loss. Good quality potato tubers, that are suitable for storage can then be kept and stored. Evaluation of ware quality of potatoes stored in locally made household level naturally ventilated ware potato storage with 2m x 1.5m x 2m size was made for eight potato varieties with stack height (1.5m) recommended for naturally ventilated ware potato stores at Holetta. The walls were made up of mud having a thickness of not less than 10 cm and roofed with grass to protect temperature build-up and direct sunlight. The cool night wind of the highland is employed using an air inlet and outlet openings which remained opened at night (from sun set to sun rise) to avoid the entrance of hot air into the stored potatoes.
The result (Table 7) showed that potatoes from both main and off-season production could be stored for about four months (120 days) with losses ranging 5-17.5% depending on the potato variety and the internal and external storage temperature and relative humidity. At Holetta, with temperatures and relative humidity presented (Table 8), potatoes could be stored for four months. Variety Digemegn had got the minimum and Menagesha the maximum storage weight losses (Table 9). The other potatoes varieties showed storage weight losses between 10-15%. Potato produced in the off-season and stored from May to August showed the lowest storage weight loss. The evaluation included quality changes in terms of tuber firmness, emaciations, crisp quality and sprouting from storage sample every 15 days. The results related to processing and utilizations are discussed in the following section.
Processing and Utilization
In Ethiopia most of the potato produced is consumed as boiled potato and frequently prepared in local dishes sauced or mixed with other vegetables and spices. The per capital consumption of potato in Ethiopia is probably the lowest in Africa [38]. The main reasons for the low consumption of potato are poor post-harvest handling and supply, unavailability of processing industries, lack of improved varieties with appropriate processing quality (chips, crisps, dehydrated potatoes and several potato-based snack food products), and lack of awareness of the different uses of the crop [39].
In recent years, the demand for potato chips and crisps is increasing very rapidly in urban areas. However, the focus of the variety improvement in the last two decades was more on improving productivity. Therefore, evaluation of existing potato varieties for their processing quality like chips and crisps has since recently been an important exercise. Although the overall tendency to the processing qualities of potato is a heritable varietal character, it is also influenced by storage environment such as period of storage [40]. Quality assessment of released potato varieties for crisps, chips, dry matter content, and specific gravity was made to study seasonal and varietal effects.
The results of the study showed that potatoes produced during the off-season had higher dry matter content and specific gravity than from the main season potatoes for most of the varieties. During the main season, variety Digemegn followed by Jalenie, Zengena and Tolcha had the highest dry matter and specific gravity whereas for the off-season production, variety Digemegn, Jalenie and Tolcha showed the highest dry matter content, 25.5%, 24.7% and 23.97%, respectively. Both in the main and off-season production variety Digemegn gave the highest dry matter content and specific gravity, while Menagesha had the lowest (Table 10). The result indicated that even if there was a difference among varieties and seasons, except for Menagesha, stored potatoes from main and off-season production had acceptable dry matter and specific gravity for processing. In line with this study, high tuber specific gravity, dry matter and starch content are important for processing by enhancing chip yield, crispness and reduces oil uptake in fried products [41,42]. Potato cultivars are significantly different in tuber specific gravity, dry matter content, and starch content [43-45]. Moreover, specific gravity and tuber dry matter content are influenced by both the environment and cultivars [46]. These quality traits are genetically controlled and also influenced with growing locations and seasons [43,44,47].
The specific gravity of the tubers was calculated using the formula:
Specific gravity = Weight in air x 100
(Weight in air – weight in water)
(Table 11) Potatoes with a dry matter content of 20-24% are ideal for making French fries, while those with a dry matter of up to 24% are ideal for preparing crisps [48]. Moreover, good quality potatoes should have a specific gravity value of more than 1.080. Potato tubers with specific gravity values of less than 1.070 are generally unacceptable for processing [49]. Potatoes stored at relative humidity of 83-84% increase in specific gravity during storage at both 4.4°C and 12.8 °C. At 90% relative humidity, the specific gravity of tubers remained unchanged in storage to 6 and half months at 4.4°C and 10°C [33]. Trained panellist evaluation was also made for quality of chips and crisps using characters colour, flavour, color, flavor, texture and overall acceptability. The results indicated that in main season production variety Jalenie followed by Tolcha, Zengena, Guassa and Wechecha were highly preferred for their crisping; but all varieties had acceptable quality (Table 11). For chips in the main season production, the most preferred potato variety was Jalenie, followed by Zengena, Guassa and Tolcha. Jalenie from both main and off-season production had the most preferred crisps and chips. As noted above, Jalenie was also the second, next to Digemegn, in its dry matter content and specific gravity both in the main and off-season production. Varieties Tolcha, Zengena, Guassa and Wechecha were equally preferred for their crisping quality. Variety Digemegn, although it had the highest dry matter and specific gravity, was not preferred as much as Jalenie.
To read more about this article: https://irispublishers.com/gjnfs/fulltext/prospects-and-challenges-of-postharvest-losses.ID.000550.php
Indexing List of Iris Publishers: https://medium.com/@irispublishers/what-is-the-indexing-list-of-iris-publishers-4ace353e4eee
Iris publishers google scholar citations:
https://scholar.google.co.in/scholar?hl=en&as_sdt=0%2C5&q=irispublishers&btnG
0 notes
Text
Iris publishers-Global Journal of Nutrition & Food Science (GJNFS)
Global Scenario of Malnutrition: A Review
Authored by Faizul Hassan Shah*

Abstract
Billions of people in the world are suffering from malnutrition. Malnutrition is widely prevalent in under-develop world especially South Asia and Africa where more than half of the world’s malnourished children are found. There are variety of nutritional deficiency outcomes such as stunting, wasting, low birth weight and overweight. Consequently, low productivity, poverty and low standard of living are widespread. This review provides an overview of global scenario of malnutrition.
Introduction
Malnutrition is a pathological state resulting from relative or absolute deficiency of one or more nutrients. It is a physiological imbalance that arises because of non-optimal eating of food as a function of quantity and quality” [1]. Malnutrition is primary when the food is not available or secondary when food is available, but the body cannot assimilate it for one or another reason [2]. Malnutrition resulted in number of diseases characterized by cellular imbalance between nutrients supply and body’s demand to ensure good health. Primary malnutrition may be due to poverty, high birth rate, poor lactation, improper knowledge about weaning food, food prohibitions, illiteracy and high maternal deaths. Furthermore, secondary malnutrition is mainly due to malabsorption of nutrients, infections, metabolic disorders and failure to have immunization against deadly diseases [3]. Although, the world has progressed technologically and economically, still in 2016, globally there were 155 million children (age < 5 years) stunted, 52 million wasted and 41 million overweight. About 50% of the child deaths around the world are due to the malnutrition. This situation demands united call and efforts to lower human sufferings for quality life [4].
Malnutrition is a global apprehension affecting vulnerable segments of the population i.e. children, pregnant and/or lactating females, old age people and calamity-stricken people. About 795 million people in the world do not have enough food to lead a healthy active life. The vast majority of the world’s hungry people live in developing countries, where 12.9% population is undernourished. Poor nutrition causes nearly half (45%) of deaths in children under five i.e. 3.1 million children each year. Worldwide, one out of six children are underweight [5]. Approximately, 66 million primary school aged children attend classes hungry across the developing world. It is estimated that about US$ 3.2 billion per year is needed to feed 66 million hungry school aged children under the school nutrition programs initiated by The World Food Program (WFP) [6].
Stunting
Stunting is defined as the percentage of children (age < 5 years) whose height for age is below minus two standard deviation’s (moderate and severe stunting) and/or minus three standard deviations (severe stunting) from the median of the WHO Child Growth Standards [7]. Growth and development are very critical in the early period of the life especially 0 to 59 months. Worldwide, more than 26% of the children (age < 5 years) were stunted in 2011. However, the distribution is not equal in all parts of the world as 75% of them reside in Africa (40%) and South Asia (39%). Fourteen countries are home of about 80% of the world’s stunted children. The countries in order of global burden are; India (38%), Nigeria (7%), Pakistan (6%), China (5%), Indonesia (5%), Bangladesh (4%), Ethiopia (3%), Democratic Republic of the Congo (3%), Philippines (2%), United Republic of Tanzania (2%), Egypt (2%), Kenya (1%), Uganda (1%) and Sudan (1%) [8]. The prevalence of stunting has reduced about 36% since 1990 with an average yearly decline of 2.1%. Maximum decline was observed in East Asia and in Pacific regions (70%). China has worked a lot in the past two decades and set an example to fight against malnutrition by reducing 20% malnutrition from 1990 to 2010. However, much work still needs to be done to reduce stunting in sub-Saharan Africa, North Africa, South Asia and Middle East [9].
Wasting
Wasting is a condition which refers to acute under nutrition. It is defined as the percentage of children (age < 5 years) whose weight for height is below minus two standard deviations (moderate and severe wasting) and/or minus three standard deviations (severe wasting) from the median of the WHO Child Growth Standards [7(a)]. This is the most devastating condition because it can ultimately lead to the death. Worldwide, 52 million children (age < 5 years) are moderately or severely wasted. During 1990 to 2011, 11% decline in wasting was observed globally. The hardest hit segment of the world is South Asia, where approximately 16% of the children are wasted, which mean that one in six children would have been affected by moderate or severe wasting. India contribute to the burden of wasting more than any other country where 25 million wasted children are living. In Africa, almost 1 in 10 children (age < 5 years) (9%) were wasted. Significant correlation was found between the countries having high prevalence of wasting and food insecurity or experiencing climatic emergencies more frequently. The major reasons behind this correlation is more spread of infectious diseases as well as social and cultural limitations [10].
Under weight
Under weight is a form of malnutrition which includes both the elements of wasting as well as stunting. It is defined as the percentage of children (age < 5 years) whose weight for age is below minus two standard deviations (moderate and severe underweight) and/or minus three standard deviations (severe underweight) from the median of the WHO Child Growth Standards [7(b)]. Worldwide, almost 101 million children are underweight. The condition is worst in South Asia where 59 million (33%) underweight children are living followed by Sub-Saharan Africa were the prevalence is more than 30 million (21%) children. Global indicators have shown 37% reduction in the last two decades. Maximum decline have been attained by Europe and the independent states of Commonwealth, where it has declined up to 87% followed by East Asia and the Pacific countries (73%). Progress in the remaining areas of the world remained slow where it has declined only 26% [10(a)].
Low birth weight
Babies having birth weight less than 2.5kg are considered as low birth weight children. Globally, more than 20 million infants (15%) are low birth weight. Approximately, 33% of these children were born in India making it biggest contributor of this burden. One in four newborns children in South Asian region has low birth weight [11]. Five countries account for more than half of the global low birth weight burden. These countries include India (7.5 million), Pakistan (1.5 million), Nigeria (0.8 million), Bangladesh (0.7 million) and Philippines (0.5 million) [12]. The biggest challenge in estimation is the unavailability of the data. In 2011, almost 50% of the children were not measured for their birth weight. So, the actual number may be even much higher in the less developed world where even the data collection is a difficult task [13]. Some new methods have been introduced recently to fix this problem of underreporting of birth weight, but the numbers are still likely to be less than the actual. The World Health Assembly has set a new target to reduce low birth weight up to 30% from 2010 to 2025, which still looks to be a great challenge [14].
Overweight
Overweight is defined as the percentage of children (age < 5 years) whose weight for height is above two standard deviations (overweight and obese) and/or above three standard deviations (obese) from the median of the WHO Child Growth Standards [15]. In the past, overweight was linked merely to developed countries, but the data collected in 2011 by WHO has shown a strange connection of overweight and low to middle income countries where 69% of the world’s overweight reside. Still, 8% higher prevalence was observed in the developed countries than less developed countries [16]. Worldwide, almost 43 million children (7% of the world children age < 5 years) are overweight in 2011 as estimated by WHO [8(a)]. The number has been increased (3%) from the last two decades in the Africa. Similar increasing trend was reported for the rest of the regions of the world [2(a)].
Conclusion
Current dietary practices in the developing countries are not enough to cope up the nutritional requirements of the population. The world is facing the problem of double burden of malnutrition i.e. undernutrition as well as overnutrition. There is a great need to develop efficient nutritional strategies to tackle this issue. Moreover, the outcomes deduced from present review is supportive for the researchers, stakeholders and technologists dealing with malnutrition for better understanding of the situation for future planning.
To read more about this article: https://irispublishers.com/gjnfs/fulltext/global-scenario-of-malnutrition-a-review.ID.000549.php
Indexing List of Iris Publishers: https://medium.com/@irispublishers/what-is-the-indexing-list-of-iris-publishers-4ace353e4eee
Iris publishers google scholar citations:
https://scholar.google.co.in/scholar?hl=en&as_sdt=0%2C5&q=irispublishers&btnG
0 notes
Text
Iris publishers-Global Journal of Nutrition & Food Science (GJNFS)
Covid-19 Vaccination Side Effects and Foods That Can Help
Authored by Dr. Diane Best*
Introduction
The year 2020 was awash with Covid-19 (also known as the corona virus) contraction numbers, details, and death tolls. As a country, we are now moving into a new stage as more people receive the Covid-19 vaccine. There have been lots of myths and fallacies regarding the vaccine such as “when a person gets vaccinated a microchip is implanted with spying capabilities” or “the vaccine will give you the virus.” I am happy to say that none of these urban legends are true. However, with all the talk about Covid-19 vaccines and how one will feel afterward, focusing on foods that sooth the body and make you feel better after being vaccinated is a positive, proactive way to help your body recover and perhaps ease your mind just a little. Food does not just nourish the soul; it also has many healing properties that can give your body a boost and may help to prevent and manage some symptoms [1].
Effects of Covid-19 Vaccinations
First, let us try to understand the Covid-19 vaccine a little more. According to Dr. Marlene Millen, Chief Medical Information Officer, Ambulatory & Primary Care Physician at UC San Diego Health, the vaccine cannot cause contraction of Covid-19, no more than the flu vaccine can give you the flu. Your first Covid-19 vaccination will likely cause you to have soreness in the vaccination area, perhaps a low-grade fever or chills. Acetaminophen (Tylenol©) is a sufficient pain reliever and will cause one to feel better overall. Dr. Millin suggests that these symptoms will last approximately 24-48 hours [2].
The Center for Disease Control and Prevention states that the second round of the Covid-19 vaccine has aftereffects that are somewhat stronger. They stated that “people who get the second dose of the COVID-19 vaccine experience more frequent and severe side effects as opposed to when they receive the first dose. That includes sometimes headache, sometimes fever or even body malaise or kind of fatigue [3].” The CDC also made clear that younger people are more impacted by the side effects after the second dose than older people are [3].
Dr. Emmanuel Sarmiento, MD is an Allergy & Immunology Specialist in Greenville, SC. He explained that you “should not do any strenuous activities, stay rested, hydrate and take your Tylenol.” He also stated that “the first dose is given to have the body build up the immune response, while the second dose is given to boost that response.” This means that your body is reacting and the symptoms you are experiencing are in response to the vaccine. Dr. Sarmiento also stated that “you may have more symptoms from the second dose because that’s when you are producing a lot of antibodies.” He also states that while the first 30 minutes after the shot is when most severe allergic reactions could take place, he also adds that while temporary and manageable, the other side effects could last for 24-48 hours [4].
Dr. Greg Poland, Director of the Mayo Clinic’s Vaccine Research Group, said he suffered five hours of shaking chills, fever up to 101 degrees, severe headache, nausea, ringing in his ears and a sore arm after getting his booster dose of the Moderna vaccine. Poland explained that the second dose is amplifying the lessons of the first dose, which taught your body how to recognize the coronavirus as an enemy. “We should stress it doesn’t mean that anything’s going wrong or that something bad is happening. It is an expected reaction to the vaccine, and it will be different between different people. It is evidence of a vigorous immune response, which doesn’t mean that people who have less of a response are not developing an immune response. They are,” Poland added. “But for some of us, for whatever reason, our immune system sees this and really reacts to it” Poland said [5].
According to the U.S. Food and Drug Administration, both Moderna and Pfizer noted a more intense reaction to the second dose in their volunteers. Moderna specifically noted that “Grade 3” side effects swelling, pain, body aches, headache and fever were more frequently reported after the second dose than the first [6]. Now that we understand how the vaccine works and how it can potentially affect us, lets discuss ways to mitigate some of the symptoms and reactions associated with the Covid-19 vaccines.
Foods That Will Sooth Symptoms
According to the World Health Organization (WHO), the immune system requires the support of many nutrients. It is recommended to consume a variety of foods for a healthy and balanced diet, including whole grains, legumes, vegetables, fruits, nuts, and animal source foods [7]. There is no food that will stop anyone from catching Covid-19. There are, however, some foods that have been known to help one feel better after getting the second vaccine. Inflammation is one of the main culprits when it comes to the kind of discomfort one feels after the Covid-19 vaccines. According to verywellhealth.com, “inflammation is the immune system’s natural response to injury or illness. When you are injured or become sick, your white blood cells release inflammatory chemicals into the blood and affected tissues to protect the body from foreign invaders, such as bacteria and viruses [8]. Based on this information, after the vaccine is administered, the body goes into “fight” mode as something foreign has been introduced. There are foods that help to diminish inflammation and in turn, can make you feel much better.
Blueberries
Blueberries are an excellent source of antioxidants and while they can also sooth your sweet tooth, they also fight inflammation. Adding these to your unsweetened yogurt makes for a snack that will not only change your mood as they are known to also increase serotonin which is the hormone that balances your mood. The decrease in inflammation will help to make you feel much better after your vaccine [9,10].
Bone Broth
Bone broths and clear soups have plenty of nutrients and have been known to have major soothing effects. Because of this, bone broths will most certainly will make you feel better after your second Covid-19 vaccine. Consumer Health Digest tells us that bone broths help improve joint health due to the increased level of collagen it contains and gives the immune system a boost. Inedible animal parts such as bones and marrows along with tendons, ligaments, skin, and feet of beef, chicken, lamb, fish, and pork are boiled then simmered with fresh vegetables for an extended period. The result is a broth that is rich in nutrients and flavor and is easily digestible [11].
According to WebMD, A clear broth is warm and soothing, making it a great source of hydration while you are sick. Broths made with chicken are also high in tryptophan, which causes your body to produce serotonin, a mood enhancer and give you the feeling of comfort [12]. Jada Murray, a registered and licensed dietitian and instructor at Jacksonville State University in Jacksonville, Alabama states that “broths that are made with vegetables like carrots, onions and celery have vitamin K and vitamin C, and other minerals and antioxidants. These helps decrease inflammation, relax your muscles, and soothe the discomforts of cold or flu like symptoms, as well as build up a person’s immune system to help fight off viruses and help your body recover from illness more quickly [13].
Green Tea
Green tea is known as a superfood that offers an array of benefits. As one of the healthiest beverages on the planet, its most prevalent benefit is that is overflowing with polyphenol antioxidants that are known to reduce inflammation in the body. This is the very reason why green tea is a good bet for making your second Covid-19 vaccine easier to manage. According to Health.com these antioxidants proactively protect cells from damage which makes it a superfood that offers a wide range of health protections and benefits. Green tea antioxidants also offer antibacterial, antifungal, and antiviral effects that support immunity [14].
Turmeric
Turmeric is another superfood that can go a long way to ease the symptoms of the Covid-19 vaccinations. Curcuma longa better known as Turmeric, is a spice used for cooking, however, it has gained enormous popularity as one of a handful of powerful herbs for fighting various diseases. According to News-Medical. net, Betsaida B. Laguipo, a nutritionist who discusses the health benefits of turmeric, states that “turmeric contains more than 100 chemical compounds that contribute to its healing abilities. The best-known health benefit of turmeric is its anti-inflammatory and antioxidant properties, giving it the power to alleviate swelling and pain. Inflammation is a very common cause of pain and discomfort” [15]. The National Library of Medicine-National Institutes of Health says that turmeric “has been shown to be one of the best foods to maintain, protect, and boost immunity, reducing the risk of falling ill. It also has antiviral, antibacterial, and antimicrobial properties and can be used for pain relief. The curcumin that is found in turmeric is a potent antioxidant that can help neutralize free radicals and boost the activity of antioxidant enzymes in the body [16]. It can be added to tea, smoothies, soups, and salads.
Salmon, particularly wild caught salmon has lots of properties that can assist you in feeling better after your Covid-19 vaccines. While salmon is a great source of protein and Vitamin B as well as others, it also is one of the best sources of the long-chain omega-3 fatty acids EPA and DHA. Farm raised salmon is also a good source of these acids, but wild salmon contains at least 0.3 additional grams. Omega-3 fats can only be received via your diet as the human body cannot create them. Salmon as well as other fatty fish can help lower inflammation significantly, which helps to curtail risk factors for a few diseases and boost recovery in people with inflammatory conditions [17].
Green Vegetables
Another reason to eat your green vegetables is because the antioxidants in them could make your recovery from the Covid-19 vaccines much easier. Making sure we eat our vegetables is something parents have been preaching for decades, but with good reason. According to Jada Murray, a registered and licensed dietitian and instructor at Jacksonville State University in Jacksonville, Alabama, green vegetables (such as kale, broccoli, collards, and spinach) have high levels of antioxidants that help greatly to fight bodily inflammation. An antioxidant called sulforaphane, which is found in broccoli, helps to combat inflammation. Green vegetables are tremendous sources of beta-carotene, vitamin A, vitamin C, vitamin K, magnesium, potassium, as well as a host of other vitamins that are helpful. Ms. Murray also added that green leafy vegetables help your body in various ways such as boosting immunity, preventing infections, weight control and others.
Conclusion
While quite a few people experience no side effects from the Covid-19 vaccine, there are those that have reported some reactions like fatigue, aches, headaches, chills, and some even report fevers. The CDC says that that “you may have some side effects, which are normal signs that your body is building protection. These side effects may affect your ability to do daily activities, but they should go away in a few days [18]. Based on the information we have, the best way to get through the vaccine side effects will be to soothe the inflammatory immune response by focusing on foods that eliminate inflammation.
To read more about this article: https://irispublishers.com/gjnfs/fulltext/covid-vaccination-side-effects-and-foods-that-can-help.ID.000563.php
For more Open Access Journals in Iris publishers please click on: https://irispublishers.com/pdf/peer-review-process-iris-publishers.pdf
0 notes
Text
Iris publishers-Global Journal of Nutrition & Food Science (GJNFS)
Obesity Paradox in Kidney Diseases
Authored by Cagla Pinarli*

Abstract
Obesity is one of the most important health problem in the world. Elevated mortality risk can be seen with obesity, diabetes, hypertension, glomerular hyperfiltration, chronic kidney disease, and cardiovascular diseases. However, it has been observed that obesity positively affects survival especially in people with chronic kidney disease, elderly people, chronic heart failure, chronic obstructive pulmonary disease, cancer, acquired immune deficiency syndrome and rheumatoid arthritis. This situation has been called the obesity paradox. Studies are showing that the obesity paradox is valid in dialysis patients. Examinations have shown that the obesity paradox is affected by many factors such as ethnic origin, fat-muscle mass, and body mass index (BMI). The hypothetical pathophysiology of the obesity paradox reveals how obesity improves survival in chronic kidney disease.
Keyword: Obesity paradox; Obesity; Kidney diseases
Abbreviations: BMI: Body Mass Index, CKD: Chronic Kidney Disease, ESRD: End-Stage Renal Disease
Introduction
People with chronic kidney disease (CKD) have an increased mortality rate with end-stage renal disease (ESRD) and dialysis treatment. Mortality reaches up higher in the first months of dialysis therapy [1]. The mortality level seen in patients with chronic kidney disease is even higher than the risk of death seen in many types of cancer [2]. According to the results of randomized clinical studies, no significant benefit was found between improvement in CKD-related specific factors (anemia, iron deficiency, hyperphosphatemia, hyperparathyroidism, vitamin D deficiency, hypercalcemia, and dialysis dose) and survival [3,4]. At this point, it has been observed that the obesity paradox has a significant relationship with survival [5,6].
Obesity and CKD
Studies show that obesity, in general, has an accelerating effect on the risk of CKD [7]. According to the results of a study, it is thought that weight loss may have an anti-CKD effect. As a consequence of some bariatric surgery operations, a reduction in EGFR has been observed. It has been stated that this situation can prevent glomerular hyperfiltration and decrease the risk of CKD [8]. On the other hand, if CKD occurs, increased BMI is paradoxically related to survival [9].
Hypothetical Pathophysiology of the Obesity Paradox
The pathophysiology of protein-energy deficiency in CKD occurs with inflammation. Thus, inflammatory cytokines (interleukin-6, tumor necrosis factor-α) repress appetite, cause hypoalbuminemia and muscle destruction. By the loss of muscle and fat mass, inflammation, increased cardiovascular disease, and death result. Obesity has a potential protective effect against protein-energy deficiency. Obesity defends against inflammation and reduces the risk of cardiovascular disease and death. For example, patients with excess adipose tissue are at a lower risk for protein-energy deficiency because they have more energy and protein reserves. Therefore, a lower risk of death is observed in dialysis patients with high BMI or creatine concentration [10,11]. On the other hand, obesity is related to short-term hemodynamic stability. Fluid accumulation and heart failure are seen in many CKD patients on dialysis. In contrast to similar pulmonary capillary occlusion pressure, increased systolic blood pressure is seen in obese and overweight subjects. This provides better tolerance to the ultrafiltration rate and high volume occurring during dialysis [12]. The change in cytokines provides better results in obese individuals. Adipose tissue produces tumor necrosis factor-α receptor. Increased number of receptors play a cardioprotective role. Body fat and weight loss boost the release of lipophilic hexachlorobenzene and other chlorinated hydrocarbons. This demonstrates the enhanced risk of mortality in ESRD patients. Obese cases have an increased lipid and lipoprotein combination. This can calm the circulating endotoxins. Eventually, cardiovascular diseases and death occur [13,14]. Importantly, it should be emphasized that enhanced BMI level due to increased muscle mass was found to be more effective in the obesity paradox (compared to fat mass) [15].
Ethnicity and Obesity Paradox
There are also studies showing how ethnicity affects the obesity paradox. The obesity paradox was found to be stronger in African Americans in a study conducted on dialysis patients [16]. In another study, the stronger relationship was observed between elevated BMI and survival in African Americans, Asian Americans, Caucasians and Hispanics [17].
Conclusion
Obesity paradox is common in chronic diseases, especially in conditions such as advanced CKD, where weight loss is common. Studies show that obesity, in general, has an increasing effect on the risk of CKD disease, but on the other hand, if CKD occurs, the increased BMI is paradoxically associated with survival. It has been observed that weight loss leads to an increased risk of death in dialysis patients. Weight loss, primarily in the earliest months, is linked to increased mortality. An improvement in fat and muscle mass is generally associated with improved survival in people with CKD. The increase in muscle mass has an extra protective effect. Studies on the relationship between ethnicity and the obesity paradox show that the obesity paradox is observed in some ethnicity more powerfully.
To read more about this article: https://irispublishers.com/gjnfs/fulltext/obesity-paradox-in-kidney-diseases.ID.000564.php
For more Open Access Journals in Iris publishers please click on: https://irispublishers.com/pdf/peer-review-process-iris-publishers.pdf
0 notes
Text
Iris publishers-Global Journal of Nutrition & Food Science (GJNFS)
A Double Hit: COVID-19 and Childhood Obesity
Authored by Courtney N Haun*

Introduction
It is evident that childhood obesity is a significant public health issue that is associated with various health morbidities [1]. Globally speaking, as of 2019, it was estimated that 38.2 million children under the age of 5 years were overweight or obese (World Health Organization, 2020). Additionally, over 340 million children and adolescents aged 5-19 were overweight or obese in 2016 (World Health Organization, 2020). Adding to this issue are the implications of the COVID-19 pandemic on children’s physical activity and nutrition across the world. Childhood obesity and COVID-19 is a “double hit” on adolescents’ health and their learning outcomes, exacerbating the issue of obesity even further.
Background
A prior study by Haun, et al. (2017) [2] revealed how school health programs and parental knowledge on health and nutritional issues plays a role in children’s health outcomes. Within many school systems, there are clear policies surrounding adequate physical activity and nutritional guidelines. However, due to COVID-19, many school systems chose to move to an online format to mitigate health risks from the virus. Parents and guardians were then tasked to accommodate these changes, where many children began learning primarily from home and outside of the school system [3]. Studies are already showing the negative effects this change is having on childhood obesity rates [4]. With the lack of physical education in the school system and stay-at-home orders, many children have experienced physical activity decline and weight gain.
Discussion
Now, while school systems are tittering between the in-person and online learning format, health interventions are urgently needed to help promote children’s physical activity at home. Recommendation from Rundle, et al. (2020) [5] suggest that there is a need for innovative approaches to address food insecurity within environments where children will continue to learn from home. The authors also recommend that school systems should build on their remote teaching capacity by making physical education a priority. The COVID-19 pandemic has also highlighted the need to timely, comprehensive healthcare for children and their families [6]. Solutions are still being explored and how the long-term effects from the interruption of children’s daily routine from in-person learning to online learning.
Conclusion
School health programs have a responsibility to promote environments where children are receiving adequate nutrition and physical activity, whether that is within the school walls or in the student’s homes. Childhood obesity and COVID-19 are both international pandemics, otherwise creating an increased risk for children to develop obesity. Parents and guardians now bear part of the responsibility to ensure a healthy environment for their children. Educators, healthcare providers, and communities must work to reduce the negative impact of obesity and COVID-19 with effective solutions.
To read more about this article: https://irispublishers.com/gjnfs/fulltext/a-double-hit-covid-and-childhood-obesity.ID.000562.php
For more Open Access Journals in Iris publishers please click on: https://irispublishers.com/pdf/peer-review-process-iris-publishers.pdf
0 notes
Text
Iris publishers-Global Journal of Nutrition & Food Science (GJNFS)
Prevalence of Malnutrition and Stunting in Under Five Creche of a Rural Private School in Owerri North, Imo State
Authored by EN Onyeneke*

Abstract
The prevalence of malnutrition and stunting in under five Creche of any rural private school in Owerri North L. G. A was investigated. Owerri North is made up of seven districts namely Egbu, Emekuku, Emii, Ihitte/Ogada/Oha, Naze, Obibi-Uratta and Orji. A random selection of four schools were made and the schools include; Oxford Foundation Academy, Ulakwo, Rhema Kiddies School, Amaorie, Noble Star Academy, Orji and St. Carols Nursery and Primary School, Ulakwo. These schools were selected because they meet the set out standard and quality for Nursery Education. The study adopted a cross-sectional design involving 250 pupils from four schools. Simple random selection by balloting was used to select the children from the schools. The questionnaire was validated and pre-tested by lecturers in the Nutrition and Dietetics Department, and data on anthropometric indices- weight and height, BMI and MUAC; socio-demographic status, dietary pattern and frequency of food consumption were collected. Results obtained showed that one hundred and twelve (44.8%) under five were males while 138 were females (55.2%). About 209 (83.6%) were from Imo state and of the Igbo ethnic group240 (96%). Five (2%) of the respondents were between the ages of 6 to 12 months, 114 (45.6%) were aged between 1 to 3 years, and 130 (52%) were aged 3 to 5 years. The socio-demographic data of the respondents showed that the 70 (28%) of the respondents’ fathers were civil servant, 94 (37.6%) were traders and 27 (10.8%) were farmers. Fifty (20%) of the respondents’ mothers were civil servants, 134 (53.6%) were traders and 25 (10%) were farmers, while 41 (16.4%) were of other occupations. Monthly income distribution of the children’s parents showed that 29 (11.6%) earned ₦10,000-50,000, 119 (47.6%) earned ₦50,000 – 100,000, 96 (38.4%) earned above ₦100,000. Data from living condition showed that 154 (61.6%) live in a bedroom flat, 44 (17.6%) live in one room apartment and 39 (15.6%) live in public yard. Data on the dietary practices of the children’s care givers showed 221 (88.4%) prepared food at home to feed the children, (78.4%) eat three times in a day, 214 (85.6%) took in-between meals and 173 (69.2%) took snacks as in-between meals. About 243 (97.2%) consumed fruits and vegetables, of which (55.2%) were frequent, 66 (26.4%) twice in a week and 36 (14.4%) occasionally. Data from the frequency of food consumption from various food groups showed that 97 (38.8%) of the children consumed cereals and their products on a daily basis, 92 (36.8%) consumed cereals 3 to 4 times in a week. Starchy roots and tubers consumption showed that 98 (39.2%) consumed roots and tubers three to four times weekly, 88 (35.2%) once to twice weekly. One hundred and seven (42.8%) consumed legumes and its products once to twice weekly, 83 (33.2%) three to four times weekly, while 119 (47.6%) consumed vegetables daily, and 82 (32.8%) consumed fruits once to twice per week with additional 79 (31.6%) daily. Data on milk and milk products consumption showed that 92 (36.8%) consumed milk three to four times weekly and 62 (24.8%) daily. The prevalence of wasting among the under-five was 2.8%, stunting 3.2%, and underweight was 1.6%. The mid-upper arm circumference measurement showed that only 3 (1.2%) of the children were malnourished, while 242 (96.8%) were normal. This study shows that stunting, underweight and wasting results from a complex interaction of factors. Poor Socioeconomic and environmental conditions are important determinants of nutritional status. Poor nutrition knowledge as a re3sult of limited access to nutrition education also leads to poor food choice by the mothers. Therefore, education of women should be treated with utmost priority because it will help raise the standard of living of the family and pave way for a better socio-economic status and healthier food choice.
Keyword: Anthropometric indices; Feeding habit; Health; Nutritional status; Private schools; Nigeria
Introduction
The concept of malnutrition and stunting in under five kids is not foreign to the ear. Theoretically, malnutrition is a term that refers to both under nutrition and over nutrition. People are malnourished if the calories and protein they take through their diet are not sufficient for their growth and maintenance due to ill health, they are not able to make complete use of the food they eat (under nutrition) or if they consume too many calories (over nutrition). In this paper, we consider under nutrition and malnutrition equivalently [1]. The physical and /or mental development of children can be hampered by poor nutrition during childhood which consequently may lead to a greater risk of casualty from communicable diseases or additional critical infection which ultimately end in a bigger economic burden of a society. Evidently, malnutrition among children and mothers adversely affect the growth of development in both national and international economic arena as well as health and sustainable developments. Malnutrition is the salient source of 3.5 million deaths globally and responsible for 35% of the morbidities among children under five which undoubtedly, defines malnutrition as a prime cause for critical health and development disorders faced by people, mostly children in developing countries Characteristics of children suffering from malnutrition include stunting or chronic malnutrition (low height for age), wasting or acute malnutrition (low weight fit height ) or being underweight for their age (United Nations 4th report ,2000). Stunting is the impaired growth and development that children experience from poor nutrition, repeated infection, and inadequate psychosocial stimulation. Children are defined as stunted if their height -for-age is more than two standard deviations below the WHO Child Growth Standards median (WHO, 2019).
Many of us use the words Daycare, Crèche, Educare, Nursery school and Pre-primary fairly interchangeably. However, some mother’s become quite upset when they realise the type of care their toddler or pre- schooler is receiving is not what they had been expecting. A crèche or day care facility offers supervised play for babies and young toddlers. The staff may have certificates in childcare but won’t necessarily have degrees in early childhood development. There are toys and lots of fun and the needs of your child is being taken care of with meal, snacks, naps, changing times and some even do potty training at a set stage (though there is much debate around this ,as many believe that potty training when children are ready is more successful) [2].
Globally, prevalence of stunning amongst school age children typically varies from place to place ranging from 9.3-24.0% in Latin America and Carribean to as high as 20.2-48.1 in Africa. In South Africa the prevalence for stunting is 18.0% whereas it is as high as 42.0% and 50.0% in mid and Eastern Africa respectively. Nationally, prevalence of stunting among primary school children ranges from 11.5% in Anambra, 11.8% in Onitsha to as high as 60% in Kebbi State. In Nigeria, the progress towards halving the proportion of people suffering from hunger under the Millennium Development Goals (MDGs) has hitherto been slow and daunting. Stunting has profound effects on the health of children. It predisposes to heightened risks of severe infection as a result of immune compromised responses. Stunting has also been implicated in increased morbidity and mortality, reduced physical, neurodevelopmental and economic capacity and an elevated risk of metabolic diseases diseases adulthood. Under nutrition significantly interferes with a number of bodily functioned such as immunity (cell -mediated immune responses) antibody responses and cytokine production that as a result provoke poor health outcomes in early infancy and childhood. Most importantly, the high prevalence of bacterial and parasitic diseases in poor and developing countries have continued of exacerbate the effect of stunting in children.
Risks of stunting are high in children as a result of heightened vulnerabilities to low dietary intake, inaccessibility to food, inequitable distribution of food within the household, improper food storage and preparation, dietary taboos and infectious diseases. Significant associations have been established between early childhood stunting and late onset adulthood depression with elevated self - reported conduct problems. The consequences of stunting iterated above demonstrate the need to investigate and implement interventions to address the problem amongst school children. Furthermore, the ‘double burden of malnutrition’, (in which households have a stunted child and an overweight mother) makes stunting as a form of under nutrition quite worrisome. Numerous studies have investigated and provided broader national estimates of stunting, even though key health-related targets in the Millennium Development Goals and the Sustainable Development Goals supports concerted calls to eradicate poverty and hunger whilst also bridging inequities in health. Bearing this in mind, there is a dire need for comparative statistics across wealth quintiles and vulnerable populations that can inform formulation and adoption of feasible policies at the strategic and operational levels of government in order to curtail the effects of stunting in Nigeria. The prevalence of malnutrition and stunting occurs mainly in children especially the under five. In Nigeria, the economic situation of the country has led to malnutrition and stunting. Hence, the knowledge of the effects of malnutrition will aid in the consumption of adequate diet to increase the healthiness of the population. It was therefore important to study how malnutrition affects the health of an individual and may lead to chronic health effect. The general objective of the study is to examine the prevalence of malnutrition and stunting in Under five (5) creche in rural private Nursery Schools in Owerri North L.G.A.
The benefits that could be deprived from the outcome of the research work are as follows:
1. Identification of the causes of poor nutrition on children and the implementation of the recommendation suggestions by various nutritional bodied which will lead to better and healthy generation,
2. Provides useful information on the alarming rate of malnutrition in the country and how it will be reduced and
3. The result of the work can be used as models by government and all health workers on child right and wellbeing.
Materials and methods
Study area
Owerri is located within the Southeast Part of Nigeria and lies at Latitude 50 27-50 31’N and longitude 6055-7003’E, it is the capital of Imo State. Owerri North is made up of seven districts namely Egbu, Emekuku, Emii, Ihitte/Ogada/Oha, Naze, Obibi-Uratta and Orji. The 12 wards in Owerri North L.G.A are Agbala/Obube/ Ulakwo, Awaka/Ihitte Ogada, Egbu, Emekuku i, Emekuku ii, Emii, Ihitte Oha, Naze, Obiibi Uratta I, Obiibi Uratta ii, Obibiezena, Orji. A random selection of four schools were made and the schools include; Oxford Foundation Academy, Ulakwo, Rhema Kiddies School, Amaorie, Noble Star Academy, Orji and St. Carols Nursery and Primary School, Ulakwo. These schools were selected because they meet the set out standard and quality for Nursery Education.
Survey design
A cross sectional study of 250 pupils from four schools.
Sample selection
Simple random selection by balloting was used to select the children from the schools.
Sample size determination
The formula of YaroYahmen (1974) as presented in equation (1) was used for the samples size determination.
Where n = sample size; N = population size = 100; 1 = constant; e= margin of error (5% or 0.05) and by solving the equation (1), N = 518 and from calculation, n = 250
Data collection
The instruments used include;
Questionnaire: The questionnaire was validated and pre-tested by lecturers in the Nutrition and Dietetics Department, it was done for reliability and validity of the study. The questionnaire was made to pass round and get to every child, taken home to be filled by their parents or caregiver then returned the next day. I took their anthropometric measurement before the questionnaires were taken home.
Anthropometry: Anthropometric measurement and BMI of each child was calculated.
Height measurement: The height was measured barefooted to the nearest 0.01m, a standard deliberate stadiometer was used with the subject (child), standing erect and the feet parallel and held buttocks, shoulders and back of the child upright. Then with the head held comfortably erect with both hands hanging by the side.
Body Mass Index (BMI): BMI is a number that associates a person’s weight with his or her height/length. The formula used to calculate BMI is as follows: weight in kg divided by length in metres squared (Weight in kg ÷ height in metres m²). A BMI over 18.5 indicates adequate nutrition; below 16 is an indication of energy deficiency, BMI between 25 and 30 indicates over nutrition, whereas >30 BMI indicate obesity. The weight categories for children are defined as follows; Under weight is BMI of less than the 5th percentile ; Normal weight is a BMI from the 5th percentile to below the 85th percentile; Overweight is a BMI above the 85th percentile to below the 95th percentile and Obese is a BMI greater than or equal to the 95th percentile.
Mid Upper Arm Circumference (MUAC): The MUAC gives an indication of the degree of wasting and stunting and is a good predicator of mortality. Research shows that it is equally good, than other measurement for screening young children. The MUAC was measured using a MUAC tape. MUAC is the circumference of the left upper arm and is measured at the midpoint between the tip of the shoulder and elbow.
Data analysis
The data was collected according to the children’s age. Weight and height parameters was used to obtain their BMI; Statistical package for social science version 20.0 was used. Frequency and percentage was also used.
Statistical analysis
Statistical package for social sciences was used to analyse the data. Descriptive statistic including frequencies and percentage was used to analyse socio economic data and standard deviation was used to analyse anthropometry measurement of the children.
Results
Personal data of the under five
Table 1 showed the personal data of the under-five. One hundred and twelve (44.8%) under five were males while 138 were females (55.2%). About 209 (83.6%) were from Imo state while 41 (16.4%) were from other states of the country. Majority 240 (96%) were of the Igbo ethnic group, 1 (0.4%) Yoruba, and 4 (1.6%) Hausa. Five (2%) of the respondents were between the ages of 6 to 12 months, 114 (45.6%) were aged between 1 to 3 years, and 130 (52%) were aged 3 to 5 years (Table 1).
Socio-demographic data of the respondents
The socio-demographic data of the respondents showed that the 70 (28%) of the respondents’ fathers were civil servant, 94 (37.6%) were traders and 27 (10.8%) were farmers. Fifty (20%) of the respondents’ mothers were civil servants, 134 (53.6%) were traders and 25 (10%) were farmers, while 41 (16.4%) were of other occupations. Monthly income distribution of the children’s parents showed that 29 (11.6%) earned ₦10,000 – 50,000, 119 (47.6%) earned ₦50,000 – 100,000, 96 (38.4%) earned above ₦100,000, while only 6 (2.4%) earned a million plus. Data on the number of siblings the children have showed that 17 (6.8%) have one, 55 (22.0) have two, 92 (36.8%) have three, while others 86 (34.4%) have more than three. Data from living condition showed that 154 (61.6%) live in a bedroom flat, 44 (17.6%) live in one room apartment, 39 (15.6%) live in public yard, and 13 (5.2%) live in other kind of houses (Table 2).
Dietary practices of the respondents
Data on the dietary practices of the children’s care givers showed 221 (88.4%) prepared food at home to feed the children, while 29 (11.6%) purchased food outside the home. Majority of the children (78.4%) eat three times in a day, 15 (6.0%) eat twice daily, only 9 (3.6%) eat once in a day and 30 (12.0%) eat more than three times per day. Two hundred and fourteen (85.6%) took in-between meals, while 36 (14.4%) did not. Data on the choice of in-between meals showed that 173 (69.2%) took snacks, 28 (11.2%) took beverages, 22 (8.8%) took a full course meal, while 27 (10.8%) took other things as in-between meals. About 243 (97.2%) consumed fruits and vegetables, and 7 (2.8%) did not. One hundred and thirty eight (55.2%) consumed fruits and vegetables frequently, 66 (26.4%) twice in a week, 36 (14.4%) occasionally and 7 (2.8%) rarely (Table 3).
Food frequency of the respondents
Data from the frequency of food consumption from various food groups showed that 97 (38.8%) of the children consumed cereals and their products on a daily basis, 92 (36.8%) consumed cereals 3 to 4 times in a week, 33 (13.2%) once to twice weekly, 20 (8.0%) twice to three times monthly, and only 8 (3.2%) once in a month. Starchy roots and tubers consumption showed that 98 (39.2%) consumed roots and tubers three to four times weekly, 88 (35.2%) once to twice weekly, 48 (19.2%) daily, 11 (4.4%) two to three times per month. One hundred and seven (42.8%) consumed legumes and its products once to twice weekly, 83 (33.2%) three to four times weekly, 27 (10.8%) daily, 19 (7.6%) two to three times per month, and 14 (5.6%) once in a month. Data on vegetables consumption showed that 119 (47.6%) consumed vegetables daily, 72 (28%) three to four times weekly, 35 (14%) once to twice weekly, 14 (5.6%) two to three times per month, while only 10 (4.0) consumed vegetables once in a month. Eighty two (32.8%) consumed fruits once to twice per week, 79 (31.6%) daily, 59 (23.6%) three to four times per week, 23 (9.2%) twice to thrice monthly, and only 7 (2.8%) once in a month. 96 (38.4%) of the children consumed nuts and seeds two to three times monthly, 74 (29.6%) consumed one to two times in a week, 37 (14.8%) three to four times weekly, 23 (9.2%) twice to three times, and only 20 (8.0%) daily. Eggs, meat and poultry consumption showed that 95 (38%) consumed eggs, meat and poultry three to four times weekly, 93 (37.2%) daily, 48 (19.2%) 0nce to twice weekly, 11 (4.4%) two to three times per month and 3 (1.2%) once in a month. Eighty seven (34.8%) consumed beverages daily, 84 (33.6%) three to four times weekly, 54 (21.6%) one to two times weekly, 13 (5.2%) two to three times per month, and 12 (4.8%) once in a month. Data on milk and milk products consumption showed that 92 (36.8%) consumed vegetables three to four times weekly, 62 (24.8%) daily, 41 (16.4%) once to twice weekly, 33 (13.2%) two to three times per month, while only 22 (8.8%) consumed milk and milk products once in a month (Table 4).
Nutritional status of the under 5 children by sex
Table 5 showed the nutritional status of the under-five children. The weight for age of the children showed that 7 (2.8%) were wasted, 175 (70.0%) were normal or at low risk and 68 (27.2%) were slightly above normal. The height – for – age, status showed that 8 (3.2%) were stunted, 192 (76.8%) were normal or at low risk, while 50 (20%) were above normal. For weight for age, 4 (1.6%) were underweight, 200 (80.0%) were normal or at low risk, while 46 (18.4%) were above normal. The mid-upper arm circumference measurement showed that only 3 (1.2%) of the children were malnourished, 5 (2.05%) were at risk, while 242 (96.8%) were normal (Table 5).
Table 6 presents the mean and standard deviation for anthropometric measurements of the children. The mean height of the under-five children was 1.02±0.09 for the males and 1.02±0.08 for the females. The mean weight of the under-five children was 16.51±3.48 for the males and 17.01±2.79 for the females. The mean mid-upper arm circumference of the under-five was 15.15±2.12 for the males and 15.36±1.87 for the females (Table 6).
Discussion
Personal and socio-demographic data of the under five
Data obtained from the research showed that children aged 6 to 59 months were studied, of which 112 (44.8%) were males while 138 (55.2%) were females. Majority, 209 (83.6), of the respondents were indigenes of Imo State where the study was carried out and are Igbos 240 (96.0%). A greater percentage of the respondents aged 3 to 5 years 130 (52.0%). About 37.6% of the respondents fathers were traders, 28% were civil servants and 23.6% represented other occupational distribution. The high percentage of traders in the study revealed that trading is the major occupation of the fathers in the geographical location of the study. Similar trend was repeated among mothers of which 53.6% where traders, and 20% were civil servants. According to Mosley and Chen (2014) [3], maternal education affects children’s health and nutritional outcomes through its effect on improving women’s socioeconomic status. A higher level of maternal education leads to increased knowledge about health and nutrition, which, in turn, leads to an increase in the quality of the diets consumed by children [4]. If maternal education is to play a significant role in reducing child malnutrition, women need to be educated beyond the primary school level. Monthly income distribution of the respondents’ parents showed that a greater percentage earned between ₦50,000-100,000 which corresponds with recent study by Olodu et al. (2019) [5] on a higher monthly income more than ₦20,000, while 38.4% earned above ₦100,000. This is in accordance with reports by Mathieson and Koller, (2016) [6] who stated that healthy eating habits are largely determined by social, economic and cultural factors (such as place of residents) that influence access, availability and uptake. The number of siblings the respondents had gave a little insight on the probable family size of the respondents. Smaller family sizes (one 6.8%, two 22.0% and three 36.8% siblings) could be exposed to better care and access to healthy foods and adequate diet which can promote good health and reduce risk of diseases [5]. More than half (61.6%) of the respondents live in better houses which indicates good hygiene and sanitation, better living conditions and less overcrowding. Akombi et al. (2017) [7] reported that children from poor households are at a greater risk of being stunted and severely stunted than children from richer households. This may be attributed to the fact that with less income to spend on proper nutrition, children from underprivileged households are more prone to growth failure due to in-sufficient food intake, higher risk of infection as well as lack of access to basic health care services. Present study is supported by a study carried out in Zambia where children from poorer households reported a lower nutritional status than those from richer households [8]. Therefore, to improve child health in poor households, an establishment of properly functioning economic and financial structures which supports children from underprivileged households is needed so as to improve food security and access to basic health care services. The child’s well-being is affected by his/ her environment (including the home) which is largely influenced by the family structure, composition and relationship to members in the household [9].
According to WHO (2018) [10], Brazil experienced a sharp reduction of socioeconomic inequalities from 1996 to 2007 which resulted in child stunting dropping from 37% in 1974 to 7% in 2006–2007. Two thirds of the decline could be attributed to improvements in maternal schooling, family purchasing power, maternal and child health care, and coverage of water supply and sanitation services [11]. More girls were enrolled in and completed primary school in the 1990s which increased overall maternal schooling in adulthood. As a result of the education received, the women also had fewer children. The purchasing power of, and the minimum wage received by, unskilled workers increased, unemployment decreased, and cash transfer programmes for low-income families were expanded. Sanitation services also increased and severe food insecurity was reduced by 27% between 2004 and 2006–2007. Thus, income redistribution and universal access to education, health, water supply and sanitation services impacted child nutrition [11].
Dietary practices of the respondents
Data on the dietary practices of the children’s care givers showed 221 (88.4%) prepared food at home to feed the children, while 29 (11.6%) purchased food outside the home. Food is the fuel necessary to get through a normal day. Calories in food provide energy to carry out regular day-to-day activities. Without an adequate amount of this energy, pupils may fall asleep in school or lack the energy to pay attention to an entire day of classes [12]. Home prepared meals are better and more hygienic for a growing child since adequate food condiments are added and there is a regulated rate of seasoning and processed ingredients going into the food [12]. It is also healthier and cheaper than purchased meals from fast foods. Greater percentage (78.4%) of the respondents observed the routine three square meal per day, while 12.0% east more than three times daily. Regular eating practices and healthy food choices ensure individuals meet their nutritional requirements for growth and health maintenance [8]. About 85.6% had in-between meals, of which 69.2% had snacks, 11.2% had beverages and 8.8% had a full course meal. According to Gregory et al. (2010) [13] the consumption of snacks is a worldwide issue among children and adolescents regardless of where they live, whether in urban or rural areas or in developed or developing countries. However, snacking is a key characteristic of a children’s diet, and it is not a bad practice on its own. Snacks, if chosen wisely, can contribute positively to nutrient intake. In another study, Hackett et al. (2007) [14] opined that snacks should provide one fourth to one third of the daily energy intakes for children [14]. Majority of the children (97.2%) had access to fruits and vegetables, with about 55.2% on frequent consumption of fruits and vegetables, while 26.4% consumed twice weekly. This showed that their mothers are aware of the benefits of micronutrients to their baby’s foods.
Food frequency of the respondents
Table 4 showed the frequency of food consumption of the respondents. A greater percentage, 36.8%, consumed cereals and cereal products on a daily basis. This showed that cereals constitutes the bases of food consumption of the respondents. Maize pap is one of the major cereal incorporated as complementary feeding and given to babies at 6 months of age by individuals of low socio-economic strata. Most times, milk, soybean, boiled eggs and/or sugar are added to enhance the nutrient content of the food. Other cereal based complementary foods included Cerelac and SMA gold. The children are also introduced to foods eaten at home that normally go down well with the cereal, such as beans, moi-moi and akara with pap, rice; jollof, white with stew etc. These meals contain higher energy than the infant formular and help get the children acquainted with the meals prepared at home. Another food group mostly consumed by the children was starchy roots and tubers, evidenced by 39.2% on a consumption basis of three to four times weekly. Roots and tuber crops mainly consumed are mashed potatoes, yam, pounded yam and cassava products such as semovita etc. Some low income families introduce garri to their children which is normally cooked until it gels and given with soups such as okro, ogbono and vegetable soups. Cereals and starchy roots and tubers provide the needed energy for daily activities. Previous study by Ajao et al., (2012) [15] on influence of family size, household food security status, and child care practice on nutritional status of under- five children in Ile-Ife, Southern Nigeria showed that the energy food and body building food forms the bulk dietary intake (45% and 38% respectively) while protective and refined foods were consumed in small quantity (about 8% and 9%).
Legume products are consumed by almost half of the respondents (42.8%). They contain protein of low biological value which are also essential for growth and development of the young child. The most frequently consumed legumes were beans and soybeans. Soybeans contain protein of low biological value and it is being added to pap, cerelac and other formular for the children. Beans were also consumed mainly in mashed beans porridge, akara, moi-moi, and boiled rice with beans. Beans, groundnuts and soya beans are good sources of protein and cheaper than animal products. The respondents purchased more of these as a result of their poor socio- economic status and the rigid economy of the nation. A second reason is that soybean has a variety of usage and is regarded as the “magic food”. Previous studies reported that children consume vegetables mostly in soups and stew prepared at home than in-between meals [12]. With respect to vegetables, tomatoes, onion, pepper, green leafy vegetable, garden eggs and okro were consumed on a daily basis by almost all the respondents mainly in soups, stews and sauces as accompaniments to staple dishes like wheat meal, gari, cooked cereals, tubers and plantains.
Fruits and vegetables are good sources of vitamins, minerals and fiber. Vitamins help to build the body’s immune system in order to fight diseases and infections. They also assist metabolism of nutrients and can be converted to amino acids for use by the body (niacin to tryptophan). Watermelon, pineapple, banana and pawpaw were consumed by respondents on weekly basis. Because some fruits are seasonal, mangoes, avocado pear and local pear were consumed occasionally. The children consumed fruits regularly because of the knowledge of its nutritional benefits their mothers possessed. Frequency of nuts and seeds consumption showed that the children consumed lesser quantities throughout the week, evidenced by only 8.0% daily consumption, 14.8% three to four times weekly and 29.6% once to twice weekly. Nuts contain omega 3 fatty acids which help in brain development, and for healthy blood vessels.
The responses obtained from eggs, meat and poultry revealed that eggs, meat, and frozen fish were the main sources of animal protein consumed daily by most of the children. This is evidenced by a consumption rate of 38.0% three to four times weekly and 37.2% on a daily basis. These were mainly consumed in soups, stews, rice as well as eggs used in preparing breakfast for the children and lunch packs in school. Eggs, meat and poultry are good sources of protein of high biological value. They are good for growing children since they contain the essential amino acids needed for good health. One hundred and eight (43.2%) of the respondents consumed fish and fish products on a daily basis, 84 (33.6%) three to four times weekly and 17.2% once to twice every week. This is quite encouraging since fish is one of the most important protein sources in our diet. It contain both omega 3 and omega 6 fatty acids which help to combat pro inflammatory substances such as cytokines, prostaglandins and the eicosanoids.
The response obtained from milk and milk products consumption showed that 24.8% consumed milk products daily, 36.8% three to four times weekly and 16.4% once to twice in a week. This is quite encouraging and could be attributed to the fact that there is adequate knowledge of the nutritional benefits of milk. Secondly, the economic condition of the families were high which made it possible to provide such for their children. Most of the milk consumed by the children below 12 months were Peak 123, Pre-Nan and Nutri Start 2. Among the fats and oils, palm oil and refined vegetable oils were the most frequently consumed. About 79.2% of the children consumed fat and oil products daily. This is encouraging since fats improve the palatability of food, improves heart health and contributes the highest energy in the body. Palm oil was used mainly in soups and also served as an accompaniment to cooked beans. This is encouraging since palm oil is a rich source of pro-vitamin A which is crucial for vision and maintaining healthy cells, especially skin cells.
Nutritional status of the under 5 children by sex
Child malnutrition occurs when a child’s intake of nutrients (fat, protein, vitamins and minerals, etc.) is insufficient to sustain the needs of her body. Childhood malnutrition persists as a public health problem in developing countries. It is estimated that less than 5% of children in developing nations are wasted [16]. The main factors associated with stunting in the study were: sex of the child, wealth index and geopolitical zone. Akombi et al. (2017) [7] reported that the factors associated with severe stunting included: sex of the child, wealth index, geopolitical zone and maternal BMI. In this study, we observed that male children had a significantly higher risk of being stunted and severely stunted than their female counterpart. The prevalence of wasting in the current study is a little above this estimate. The current study indicates that 8% of the study population was stunted and this falls within the WHO estimate for developing countries [16]. The prevalence of underweight, stunting, and wasting from this study is lower than what was reported by Manjunath et al. (2008) [17]. It is also consistent with the estimate from the 2013 national demographic and health survey, except for stunting [18]. Stunting in this population is lower than the national estimate. Stunting and underweight in the current study is slightly lower than the prevalence in South Eastern Nigeria. However, the prevalence of wasting reported by Ezeama et al. (2015) [19] (18.1%) from south eastern Nigeria is higher than prevalence in the study population (7%). The Government should sustain and scale up existing interventions that will reduce malnutrition. Prevalence of PEM is 1.2%. This is lower than the prevalence reported by Andy et al. (2016) [20].
Several factors are associated with PEM and vary from place to place. According to Andy et al. (2016) [20], the prevalence of PEM among male children is higher than in female children and the relationship between PEM and gender is statistically significant. This finding is similar to that obtained from the present study and the position of Ubesie et al., (2012) and Yalew (2014) [21,22]. This underlines the need to give special attention to mothers of male children when counselling women about the nutrition of their children. This gender based health inequality may be as a result of community specific cultures in Nigeria which reflect a historical pattern of preferential treatment of females due to the high value placed on women’s agricultural labor [23]. Also, male children tend to be more physically active and expend large amounts of energy which should have been channelled into increasing growth. On the other hand, females are culturally expected to be less active and stay at home with their mothers near food preparation. This finding is consistent with results from other cross-sectional studies carried out in Kenya [24], Tanzania [25] and Ghana [26]. In Jayatissa (2012) [27] study on assessment of nutritional status and associated factors; there were no consistent differences between sexes regarding occurrence of stunting but a higher prevalence of wasting and underweight was seen among males. The MUAC also shows that 1.78% males and 0.72% females were malnourished. Akorede and Abiola (2013) [28] stated that since the present condition (nutritional status) have a lot of effect on the future then adequate care should be given to the children at that tender age [29-36]. The best way to achieve optimal nutritional status is to improve on the socioeconomic conditions of children and teach nutrition education to mothers, most especially on the best practices to care for their children.
Conclusion and recommendation
This study shows that stunting, underweight and wasting results from a complex interaction of factors. Hence at the individual level, interventions to prevent stunting, underweight and wasting should focus on improving women’s nutrition and education to reduce low birth size, improve household hygiene and promotion of appropriate complementary food and feeding practices. Poor Socioeconomic and environmental conditions are important determinants of nutritional status. Educated and employed mothers have control over the purchase of the dietary items and will be more qualified and capable of taking care for their children properly. Mothers should be adequately educated on how best to imbibe nutrition knowledge to the care of their baby so as to reduce child malnutrition in Imo State. Education of women should be treated with utmost priority because it will help raise the standard of living of the family and pave way for a better socio-economic status. Government and nutrition policy makers should enact policies that will enhance food security, and promote programs like operation feed the nation, food bank and cash remission. Further research can be carried out on the above study, more especially in the Northern parts of the country where child malnutrition has wrecked much havoc.
To read more about this article: https://irispublishers.com/gjnfs/fulltext/prevalence-of-malnutrition-and-stunting-in-under-five-creche-of-a-rural-private-school.ID.000561.php
For more Open Access Journals in Iris publishers please click on: https://irispublishers.com/pdf/peer-review-process-iris-publishers.pdf
0 notes
Last Seen Blogs

eclecticstarlightblogger
not another blog

hawk-boy
Sultry Siren of the Sonic Smackdown

vizmarathon-blog
Visualizing Global Marathon

hootiebanoonie
Whoms’t?

corventi
Corventi