#Japan ASTER Science Team
Text
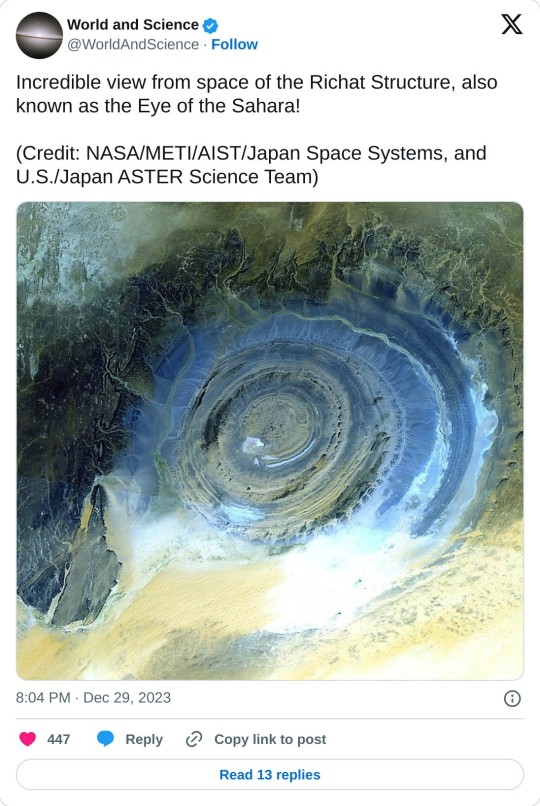
#Eye of the Sahara!#NASA#METI#AIST#Japan Space Systems#U.S#Japan ASTER Science Team#Richat Structure
1 note
·
View note
Text
Summary of the Fifty-Second U.S.Japan ASTER Science Team Meeting
Michael Abrams, NASA/Jet Propulsion Laboratory/California Institute of Technology, [email protected] Yasushi Yamaguchi, Nagoya University/Japan Science and Technology Agency, [email protected] Introduction The Advanced Spaceborne Thermal Emission and Reflection Radiometer (ASTER) Science Team (ST) organized a three-day workshop that took place September 11–13, 2023, at the offices of Japan Space Systems (JSS) in Tokyo. Over 40 people from […]
from NASA https://ift.tt/o8lR3YW
0 notes
Text
Terra Observes Shark Bay, Australia: Hamelin Pool Marine Nature Reserve image acquired December 30, 2010. Hamelin Pool Marine Nature Reserve, seen here in an image from the Advanced Spaceborne Thermal Emission and Reflection Radiometer (ASTER) on the Terra spacecraft on Dec. 30, 2010, is a special site. Located in the Shark Bay World Heritage Site in Western Australia, it is one of the very few places in the world where we can find living stromatolites—the first living examples of structures built by cyanobacteria. Photosynthetic cyanobacteria are thought to have changed the course of life’s evolution on Earth by playing an important role in the oxygenation of Earth’s atmosphere roughly 2.3 billion years ago. Also, NASA and other federal agencies monitor levels of cyanobacteria, as toxic levels of the blue-green algae can have negative effects on health.
ASTER is one of five Earth-observing instruments launched Dec. 18, 1999, on Terra. With its 14 spectral bands from the visible to the thermal infrared wavelength region and its high spatial resolution of 15 to 90 meters (about 50 to 300 feet), ASTER images Earth to map and monitor the changing surface of our planet. The instrument was built by Japan's Ministry of Economy, Trade and Industry. A joint U.S./Japan science team handles validation and calibration of the instrument and data products.
Image Credit: NASA/GSFC/METI/ERSDAC/JAROS, and U.S./Japan ASTER Science Team :: [Robert Scott Horton]
* * * *
“Humanity is deeply asleep and is walking towards the edge of a precipice that it does not see.
But an individual can realise that he is on the edge of a precipice; and if he opens his eyes to it, he would see that there is a rope above his head, and he can climb: but to reach this rope he has to jump.
When we are at the level where we imagine we can be helped as we are, no help can reach us. For something better to exist, it is necessary to change ourselves. Personal satisfaction, vanity, ignorance, these and all other things, prevent the help from reaching us.
Originally, prayer was a request for help to rise to a higher level of consciousness.”
~ Maurice Nicoll
[Ian Sanders]
[via 'alive on all channels']
#from above#NASA#Robert Scott Horton#Shark Bay Australia#Alive on all Channels#Maurice Nicoll#Ian Sanders#quotes#higher consciousness
6 notes
·
View notes
Photo
The Anti-Atlas Mountains of Morocco formed as a result of the collision of the African and Eurasian tectonic plates about 80 million years ago. This collision destroyed the Tethys Ocean; the limestone, sandstone, claystone, and gypsum layers that formed the ocean bed were folded and crumpled to create the Atlas and Anti-Atlas Mountains. In this ASTER image, short wavelength infrared bands are combined to dramatically highlight the different rock types, and illustrate the complex folding. The yellowish, orange and green areas are limestones, sandstones and gypsum; the dark blue and green areas are underlying granitic rocks. The ability to map geology using ASTER data is enhanced by the multiple short wavelength infrared bands, that are sensitive to differences in rock mineralogy. This image was acquired on June 13, 2001 by the Advanced Spaceborne Thermal Emission and Reflection Radiometer (ASTER) on NASA's Terra satellite. With its 14 spectral bands from the visible to the thermal infrared wavelength region, and its high spatial resolution of 15 to 90 meters (about 50 to 300 feet), ASTER images Earth to map and monitor the changing surface of our planet. ASTER is one of five Earth-observing instruments launched December 18, 1999, on NASA's Terra satellite. The instrument was built by Japan's Ministry of Economy, Trade and Industry. A joint U.S./Japan science team is responsible for validation and calibration of the instrument and the data products. The broad spectral coverage and high spectral resolution of ASTER will provide scientists in numerous disciplines with critical information for surface mapping, and monitoring of dynamic conditions and temporal change. Example applications are: monitoring glacial advances and retreats; monitoring potentially active volcanoes; identifying crop stress; determining cloud morphology and physical properties; wetlands evaluation; thermal pollution monitoring; coral reef degradation; surface temperature mapping of soils and geology; and measuring surface heat balance. Dr. Anne Kahle at NASA's Jet Propulsion Laboratory, Pasadena, California, is the U.S. Science team leader; Bjorn Eng of JPL is the project manager. The Terra mission is part of NASA's Earth Science Enterprise, a long- term research effort to understand and protect our home planet. Through the study of Earth, NASA will help to provide sound science to policy and economic decision-makers so as to better life here, while developing the technologies needed to explore the universe and search for life beyond our home planet. Size: 28.7 x 29.4 km (17.8 x 18.2 miles) Location: 29.4 deg. North lat., 8.9 deg. West long. Orientation: North at top Image Data: ASTER bands 4,6 and 8. Original Data Resolution: 30 m Date Acquired: June 13, 2001
3 notes
·
View notes
Video

flickr
Terra's view of Teshekpuk Lake, Alaska by NASA on The Commons
Via Flickr:
Teshekpuk Lake is on Alaska North Slope, within the National Petroleum Reserve. Up to 90,000 geese nest in this area in the summertime, and up to 46,000 caribou use the area for both calving and migration. The Advanced Spaceborne Thermal Emission and Reflection Radiometer (ASTER) on NASA’s Terra satellite took this picture on August 15, 2000. In this image, green indicates vegetation and blue indicates water. Some bodies of water also appear in off-white or yellowish, probably due to different amounts of sediment in the water and/or the sun angle. The Beaufort Sea is at the top of the scene, while Teshekpuk Lake is at lower left. The land here is a lacy, lake-dotted expanse of tundra. The large image covers an area of 58.7 by 89.9 kilometers, and is centered near 70.4 degrees North latitude, 153 degrees West longitude. NASA Media Usage Guidelines Credit: NASA/GSFC/METI/ERSDAC/JAROS, and U.S./Japan ASTER Science Team Image Number: PIA01909 Date Acquired: August 15, 2000
0 notes
Link
Sediment from Canada’s Mackenzie River empties into the Beaufort Sea in milky swirls in this 2017 satellite image. Scientists are studying how river discharge drives carbon dioxide emissions in this part of the Arctic Ocean.NASA Earth Observatory image by Jesse Allen using Landsat data from USGS Runoff from one of North America’s largest rivers is driving intense carbon dioxide emissions in the Arctic Ocean. When it comes to influencing climate change, the world’s smallest ocean punches above its weight. It’s been estimated that the cold waters of the Arctic absorb as much as 180 million metric tons of carbon per year – more than three times what New York City emits annually – making it one of Earth’s critical carbon sinks. But recent findings show that thawing permafrost and carbon-rich runoff from Canada’s Mackenzie River trigger part of the Arctic Ocean to release more carbon dioxide (CO2) than it absorbs. The study, published earlier this year, explores how scientists are using state-of-the-art computer modeling to study rivers such as the Mackenzie, which flows into a region of the Arctic Ocean called the Beaufort Sea. Like many parts of the Arctic, the Mackenzie River and its delta have faced significantly warmer temperatures in recent years across all seasons, leading to more melting and thawing of waterways and landscapes. In this marshy corner of Canada’s Northwest Territories, the continent’s second largest river system ends a thousand-mile journey that begins near Alberta. Along the way, the river acts as a conveyor belt for mineral nutrients as well as organic and inorganic matter. That material drains into the Beaufort Sea as a soup of dissolved carbon and sediment. Some of the carbon is eventually released, or outgassed, into the atmosphere by natural processes. Scientists have thought of the southeastern Beaufort Sea as a weak-to-moderate CO2 sink, meaning it absorbs more of the greenhouse gas than it releases. But there has been great uncertainty due to a lack of data from the remote region. To fill that void, the study team adapted a global ocean biogeochemical model called ECCO-Darwin, which was developed at NASA’s Jet Propulsion Laboratory in Southern California and the Massachusetts Institute of Technology in Cambridge. The model assimilates nearly all available ocean observations collected for more than two decades by sea- and satellite-based instruments (sea level observations from the Jason-series altimeters, for example, and ocean-bottom pressure from the GRACE and GRACE Follow-On missions). Like a conveyer belt of carbon, the Mackenzie River, seen here in 2007 from NASA’s Terra satellite, drains an area of almost 700,000 square miles (1.8 million square kilometers) on its journey north to the Arctic Ocean. Some of the carbon originates from thawing permafrost and peatlands.NASA/GSFC/METI/ERSDAC/JAROS, and U.S./Japan ASTER Science Team The scientists used the model to simulate the discharge of fresh water and the elements and compounds it carries – including carbon, nitrogen, and silica – across nearly 20 years (from 2000 to 2019). The researchers, from France, the U.S., and Canada, found that the river discharge was triggering such intense outgassing in the southeastern Beaufort Sea that it tipped the carbon balance, leading to a net CO2 release of 0.13 million metric tons per year – roughly equivalent to the annual emissions from 28,000 gasoline-powered cars. The release of CO2 into the atmosphere varied between seasons, being more pronounced in warmer months, when river discharge was high and there was less sea ice to cover and trap the gas. Ground Zero for Climate Change Scientists have for decades studied how carbon cycles between the open ocean and atmosphere, a process called air-sea CO2 flux. However, the observational record is sparse along the coastal fringes of the Arctic, where the terrain, sea ice, and long polar nights can make long-term monitoring and experiments challenging. “With our model, we are trying to explore the real contribution of the coastal peripheries and rivers to the Arctic carbon cycle,” said lead author Clément Bertin, a scientist at Littoral Environnement et Sociétés in France. Such insights are critical because about half of the area of the Arctic Ocean is composed of coastal waters, where land meets sea in a complex embrace. And while the study focused on a particular corner of the Arctic Ocean, it can help tell a larger story of environmental change unfolding in the region. Since the 1970s, the Arctic has warmed at least three times faster than anywhere else on Earth, transforming its waters and ecosystems, the scientists said. Some of these changes promote more CO2 outgassing in the region, while others lead to more CO2 being absorbed. For example, with Arctic lands thawing and more snow and ice melting, rivers are flowing more briskly and flushing more organic matter from permafrost and peatlands into the ocean. On the other hand, microscopic phytoplankton floating near the ocean surface are increasingly taking advantage of shrinking sea ice to bloom in the newfound open water and sunlight. These plantlike marine organisms capture and draw down atmospheric CO2during photosynthesis. The ECCO-Darwin model is being used to study these blooms and the ties between ice and life in the Arctic. Scientists are tracking these large and seemingly small changes in the Arctic and beyond because our ocean waters remain a critical buffer against a changing climate, sequestering as much as 48% of the carbon produced by burning fossil fuels. News Media Contacts Andrew Wang / Jane J. LeeJet Propulsion Laboratory, Pasadena, Calif.626-379-6874 / [email protected] / [email protected] Written by Sally Younger 2023-185 Share Details Last Updated Dec 21, 2023 Related TermsClimate ChangeCarbon CycleEarthGreenhouse GasesJet Propulsion LaboratoryOceans Explore More 5 min read NASA’s Tech Demo Streams First Video From Deep Space via Laser Article 3 days ago 4 min read Armstrong Flight Research Center: A Year in Review Article 7 days ago 6 min read NASA’s NEOWISE Celebrates 10 Years, Plans End of Mission Article 1 week ago
0 notes
Text
Namib-Naukluft National Park is an ecological preserve in the Namib Desert in southwest Africa, thought to be Earth's oldest desert. The park is the largest game park in Africa, and a surprising collection of creatures manages to survive in the hyper-arid region, including snakes, geckos, unusual insects, hyenas, and jackals. More moisture comes in as a fog off the Atlantic Ocean than falls as rain, with the average 63 millimeters of rainfall per year concentrated in the months of February and April.
The winds that bring in the fog are also responsible for creating the park's towering sand dunes, whose burnt orange color is a sign of their age. The orange color develops over time as iron in the sand is oxidized (like rusty metal); the older the dune, the brighter the color. These dunes are the tallest in the world, in places rising above the desert floor more than 300 meters (almost 1000 feet). The dunes taper off near the coast, and lagoons, wetlands, and mudflats located along the shore attract hundreds of thousands of birds.
This perspective view was created by draping an ASTER color image over an ASTER-derived Digital Elevation Model of the topography. The image was acquired October 14, 2002.
Credit: NASA/GSFC/MITI/ERSDAC/JAROS, and U.S./Japan ASTER Science Team

0 notes
Photo

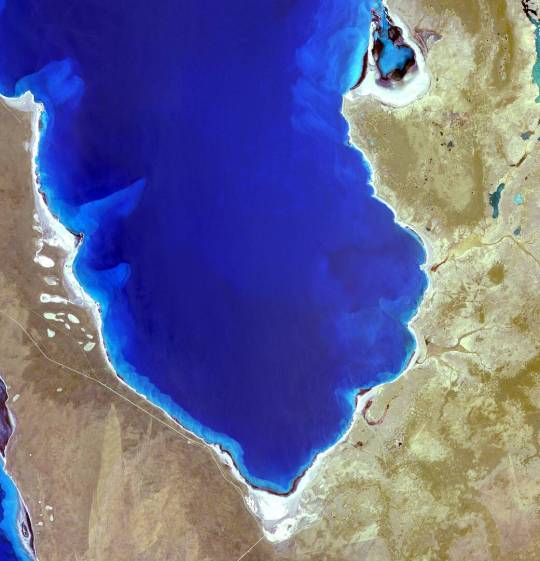
Satellite image of the Maldives
North and South Maalhosmadulu Atolls are in the Maldives, an island republic in the northern Indian Ocean, southwest of India. Maldives is made up of a chain of 1192 small coral islands that are grouped into clusters of atolls. It has a total area of 298 sq km and a population of about 330,000. The capital and largest city is Malé, with a population of about 80,000. Arguably the lowest-lying country in the world, the average elevation is 1 m above sea level. Waves triggered by the great tsunami of December 2004 spilled over sea walls to flood Malé with sand-clouded water and then swept out just as suddenly. Residents fear this was a foreboding of disasters to come from sea-level rise due to global warming. The simulated natural color ASTER image was acquired 22 December 2002, covers an area of 50.8 x 90.4 km, and is centered near 5.3 degrees north latitude, 73.9 degrees west longitude.
Credit: NASA/GSFC/METI/ERSDAC/JAROS, and U.S./Japan ASTER Science Team
189 notes
·
View notes
Photo

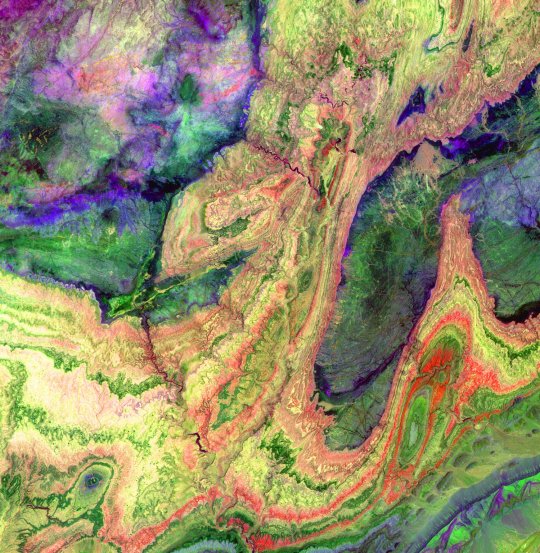
Great Dyke
Running through the heart of Zimbabwe and easily visible from above is this remarkable line, a 550 kilometer long, 3 to 12 kilometer wide intrusion of igneous rock.
The Great Dyke is a 2.5 billion year old igneous intrusion in the middle of the Zimbabwe Craton, one of the ancient crustal slices that assembled to make the Gondwana supercontinent. A feature this long and this linear probably requires that the craton was being pulled apart by tectonic forces at the time, opening a huge fissure that molten rock could flow into.
The igneous rock in the dyke is called a “layered mafic intrusion”. There is so much volume in this dyke that it required large amounts of molten rock supplied from below in multiple pulses. As the craton was being pulled apart, molten rock rose out of the mantle and filled a magma chamber. That magma chamber sent pulses of magma up in-between large faults to form the dyke. As the batches of magma entered the dyke, it lost heat and crystallized. The crystals then sank, forming layers that were each made of distinct mineral groups. Another batch of magma would then enter the dyke, causing the cycle to repeat and forming a sequence of repetitive layers.
Basaltic magmas also carry elements that don’t easily go into the early-forming minerals. They will remain in the melt until a mineral begins forming that takes up those elements. Layers that are enriched in chromium and platinium in the Great Dyke are particularly valuable and are mined as major natural resources in Zimbabwe.
-JBB
Image credit: NASA/GSFC/MITI/ERSDAC/JAROS, and U.S./Japan ASTER Science Team
https://asterweb.jpl.nasa.gov/gallery-detail.asp?name=Dyke
Read more:
https://earthobservatory.nasa.gov/images/46341/great-dyke-of-zimbabwe
http://bit.ly/1f0pkBg
https://africaincmag.com/2020/09/07/great-dyke-investments-set-to-raise-us500m-funding-for-first-phase-of-its-mining-project/
https://academic.oup.com/petrology/article-abstract/33/3/611/1422110
https://academic.oup.com/petrology/article-abstract/23/2/240/1469121
#Great dyke#geology#igneous#gondwana#zimbabwe#precammbrian#layered mafic intrusion#science#magma#crystal#chromium#platinum#pge#the earth story
101 notes
·
View notes
Photo

NASA/GSFC/METI/ERSDAC/JAROS, and U.S./Japan ASTER Science Team
1 note
·
View note
Text
We probed Santorini's volcano with sound to learn what's going on beneath the surface
by Emilie Hooft

Sound waves let researchers visualize what’s happening below the surface. Emilie Hooft, CC BY-ND
The island of Santorini in the Mediterranean has attracted people for millennia. Today, it feels magical to watch the sun set from cliffs over the deep bay, surrounded by cobalt blue churches and whitewashed houses. This mystical place attracts about 2 million tourists per year, making it one of the top destinations in Greece.

The Greek islands of Santorini form the perimeter of a volcano whose last major explosion happened about 3,400 years ago. Now the center of the crater-like caldera is filled with seawater. NASA/GSFC/METI/ERSDAC/JAROS and U.S./Japan ASTER Science Team, CC BY
Not all those visitors recognize that Santorini is an active volcano. In 1630 B.C., the volcano exploded and collapsed leaving behind an almost circular hole. This is the caldera – visible today as a bay filled with seawater and lined by cliffs. The large explosion covered a Bronze Age town, burying buildings in volcanic ash two stories deep.
The latest lava flows erupted in 1950 and expanded the islands that have grown at the center of the caldera. Recently, in 2011-2012, the volcano went through a period of unrest. The ground bulged up and out, and many small earthquakes occurred. Scientists concluded that a small amount of magma was injected about 2.5 miles (4 kilometers) under the northern portion of the caldera.
What attracted me to this iconic place is that most of the volcano is submerged under water. I am a geophysicist interested in how magma moves deep in the Earth. Over the past decade, I’ve been using advanced technology to improve how we “see” magma’s otherwise hidden pathways below volcanoes around the world.
youtube
Get a glimpse of how researchers conducted their seismic experiment to understand the volcano of Santorini.
Using sound to see what’s beneath the surface
In the 1780s, French scientist Ferdinand Fouquet traveled to Santorini to view an ongoing eruption. He was the first to realize how the volcanic surface depression known as a caldera was formed. As magma emptied out of its underground reservoir during the eruption, the roof of rock that had been covering it collapsed. The flanks of the volcano that remained form the ring of islands visible above water today.
My research project aimed to delve deeper, literally, than what we can see from the surface to figure out what’s going on within this still active volcano. A blanket of water over everything except the very top of the Santorini volcano meant I could use deep-penetrating marine sound sources to “illuminate” the subsurface structures. My international collaborators and I wanted to find the location and depth where magma was collecting and how much magma there is right now.

R/V Marcus Langseth within the Santorini caldera with an ocean-bottom seismometer floating in front of the ship. Doug Toomey, CC BY-ND
We conducted our work from the R/V Marcus Langseth, an American marine seismic ship. It is the only academic ship with a sound source capable of imaging the deep insides of a volcano. This technology is controversial because of the potential impact of loud sounds on marine wildlife and its intensive use by oil exploration companies.
We spent months doing environmental permitting and finding the optimal design for the experiment. The ship carried a team of experienced biological observers who surveyed the sea both above and below water for sound-sensitive or endangered species. If any were observed at a distance, we were to follow a prescribed set of actions to ensure they wouldn’t be disturbed. After all this preparation, though, we saw almost no wildlife during the expedition.

One of the airguns. It has a volume of 180 cubic inches and is about 18 inches long. Emilie Hooft, CC BY-ND
Our “active source seismic imaging” method is like making a CAT-scan picture of the inside of the Earth. Instead of building an image using X-rays, though, we use sound waves generated by 36 heavy, metal canisters – called airguns – that are towed deep in the water behind the ship. When the airguns open, compressed air pushes on the seawater, creating a sound wave that travels through the Earth.
In this instance, the sound travels through the rocks beneath the volcano. Then seismic sensors resting on the seafloor on the other side of the volcano record when the sound reaches them. The team installed 65 of these stations on land, across Santorini and the nearby islands, and dropped another 90 stations to the seafloor.

The team installing one of the land seismometers on Anafi. Joanna Morgan, Imperial College London, CC BY-ND
We have to use very accurate timing to measure how long it takes the sound energy to go through the different parts of the volcano. The energy from the sound source will travel more slowly through rocks that are broken or that are hot and contain magma. When we probe the structure from many different directions and at many different depths, we can recover a detailed picture of the interior of the Earth.

University of Oregon graduate student Brandon VanderBeek capturing an ocean-bottom seismometer after it resurfaces. The caldera cliffs of Santorini are in the distance. The black fresh lavas of the island inside the caldera are in front, on the left. Emilie Hooft, CC BY-ND
To get the data back from the seafloor, we send a special sound signal to the sensor – like a bird call – that commands the instrument to drop its anchor. Then everyone scans the sea looking for the instrument. During the day we search for a cheerful orange flag, at night a strobe light makes this task easier. Our ship maneuvers alongside the instrument and a crew member leans over the side, hooks the instrument on a long pole and pulls it back on board. The data is in hand.

Scientists gather around the map table in the R/V Langseth’s main laboratory. PROTEUS Science Team, CC BY-ND
Filling out the subsurface picture
Analysis of the seismic data is an enormous task. It required experienced inspection by Ph.D. student Ben Heath and master’s student Brennah McVey. We then used seismic tomography to make the first detailed “photographs” of Santorini’s subsurface structure. The term tomography comes from the Greek words “tomos” for slice and “graphos” for draw. Basically sophisticated computer code makes a three-dimensional digital model of the object of interest based on the speed sound waves traveled through it.

The grey volume is the column of porous rock beneath the northern caldera. This is the zone of the initial collapse during the Bronze age eruption. As the plumbing system refills, magma (red in this schematic) accumulates directly beneath this region. Brennah McVey, University of Oregon, CC BY-ND
Surprisingly, we found a narrow zone of collapsed rock hiding within the broad caldera at Santorini. Geological studies of the eruptions at Santorini hadn’t led us to expect there would be a confined volume of rocks in the northern part of the caldera that sound traveled through more slowly. Rather we thought the entire caldera would be filled with this type of broken rock at shallow depths. Our finding meant that the collapsed portion of the caldera was much narrower and deeper than it appears from the surface.
This column of disrupted rock is less than 2 miles (3 km) across – small compared to the size of the 6-mile-wide (10 km) caldera. The structure goes down into the ground 2 miles (3 km) below the bottom of the bay. These rocks must contain lots of water-filled gaps to have sufficiently slowed the seismic energy we recorded.
youtube
3D visualization of Santorini’s caldera and magma plumbing system.
To figure out how this unique volume of disrupted rock formed, we drew on existing knowledge of Santorini’s most recent large explosion, the Late Bronze Age eruption in 1630 B.C. As magma erupted from the subsurface, it caused the overlying rocks to break up. At the same time, underground explosions fractured the rocks when magma and water came into contact. Then, above this collapsing column, the seafloor depression filled with porous volcanic deposits from the eruption itself. Finally, the entire bay dropped down and rapid flooding formed a tsunami wave.
What is particularly interesting about our findings is that magma continues to accumulate directly beneath the column of disrupted rock – thousands of years after the explosion that originally created the caldera. My colleagues and I think the rising magma comes to a halt beneath the reduced weight of the broken rock in the collapsed column.
Our research helps explain how magma systems are reset and regrow after major volcanic episodes.

About The Author:
Emilie Hooft is an Associate Professor of Earth Sciences, Volcanology Cluster of Excellence, & Oregon Hazards Lab at the University of Oregon
This article is republished from The Conversation under a Creative Commons license.
8 notes
·
View notes
Photo

The face of the earth
par
Jessika Kenney & Eyvind Kang
https://www.youtube.com/watch?v=7nKgX5LyIp8&list=PL-iw--mMCQ3ICKeG7ZMXVfoTrTZF_TXYs
https://ideologicorgan.bandcamp.com/album/the-face-of-the-earth
Photos NASA/GSFC/METI/ERSDAC/JAROS, and U.S./Japan ASTER Science Team; courtesy NASA/JPL-Caltech.
1 note
·
View note
Photo


From NASA Earth Observatory Image of the Day; March 16, 2018:
Iceland’s Caldera of Hot Springs
If you ever have an urge to hike—or even bathe—inside a volcano, you may want to visit Torfajökull. While this volcano has not had a large eruption since 1477, its 18-kilometer by 12-kilometer caldera is home to one of Iceland’s largest geothermal areas—an exotic landscape dotted with steaming sulfur and mud pools, hot springs, and gas vents.
The Operational Land Imager (OLI) on Landsat 8 acquired this image of Torfajökull’s caldera on Sep 20, 2014. Calderas, large circular volcanic depressions, form in the wake of major eruptions when the land surface slumps down into an empty or partially empty magma chamber. In Torfajökull’s case, geologists think the caldera formed in stages, with the first collapse happening about 600,000 years ago.
Most of the light gray, brown, and pink domes and ridges within the caldera are the product of lava flows. Torfajökull is notable among Iceland’s volcanoes for discharging relatively rare rhyolitic lava, which is rich in silica. The high silica content gives the resulting rock its light color. (In contrast, silica-poor mafic lavas produce dark rocks.)
Thick ice covered Torfajökull when many of its past eruptions occurred, meaning it was a subglacial volcano. When such volcanoes erupt, they usually generate enough heat to melt the overlying ice and form lakes that immediately quench and cool emerging lava. This creates conditions similar to those found at underwater volcanoes and produces distinctive rock formations. The presence of flat-topped features known as tuyas are one such feature. Likewise, the many domes and ridges made of hyaloclastite—a rock type that includes many fragments of volcanic glass—are also signs of Torfajökull’s icy past.
Most of Torfajökull’s fast-retreating ice cap is gone (except for an area on the southeastern rim of the caldera), but the second image highlights two active subglacial volcanoes to the south with plenty of ice remaining—Katla, which is beneath the Mýrdalsjökull ice cap, and Eyjafjallajökull.
While geothermal activity can be found in several parts of the caldera, some of the most concentrated activity is in Hrafntinnusker, a remote area along the popular Laugavegur hiking trail. Fumaroles and warm streams in Hrafntinnusker have melted intricate caves into glacial ice—a rare phenomenon found in few other places in Iceland. On the northern edge of the caldera, the hot springs at Landmannalaugar—with temperatures of 36 to 40 degrees Celsius (99 to 104 degrees Fahrenheit)—are a popular stop for hikers exploring the colorful rhyolite hills nearby.
References
Bjornsson, H. (2017) Glaciers of Southern Iceland. Atlantis Advances in Quaternary Science, vol. 2. (Atlantis Press: Paris)
Catalogue of Icelandic Volcanoes Torfajökull. Accessed March 15, 2018.
Global Volcanism Program Torfajökull. Accessed March 15, 2018.
Gunnerson, B. et al. (1998) Generation of Icelandic rhyolites: silicic lavas from the Torfajökull central volcano. Journal of Volcanology and Geothermal Research, 38 (1-2), 1-45.
Saemundsson, K. et al. (2009) Torfajökull, Iceland—a rhyolite volcano and it’s geothermal resource. Accessed March 15, 2018.
United Nations Educational, Scientific, and Cultural Organization (2013) Torfajökull Volcanic System / Fjallabak Nature Reserve.Accessed March 16, 2018.
NASA Earth Observatory image by Mike Taylor and Joshua Stevens, using Landsat data from the U.S. Geological Surveyand data from NASA/GSFC/METI/ERSDAC/JAROS, and U.S./Japan ASTER Science Team. Story by Adam Voiland. Instrument(s): Terra - ASTER; Landsat 8 - OLI
#earth observatory#satellite photo#long post#geology#volcano#caldera#Torfajokull#Hrafntinnusker#Landmannalaugar#Iceland#landsat 8
10 notes
·
View notes
Photo
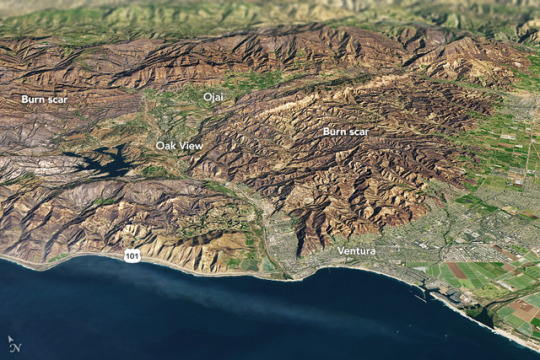
California’s December Inferno
It is rare for large wildfires to burn in California in December, which is usually a wet month for the state. In most years, a few hundreds acres might burn. The 2006 Shekell fire in Ventura charred 13,600 acres, making it the largest December fire in the state between 2000 and 2016.
In 2017, the Thomas fire shattered the record for December and may soon eclipse the worst blaze in any month. After burning for 16 days, the massive fire had scorched 272,000 acres (110,000 hectares or 425 square miles) and was just 60 percent contained. That made it the second largest fire on record in California, trailing only the Cedar fire, which burned 273,246 acres in 2003.
The Operational Land Imager (OLI) on Landsat 8 captured an image of the Thomas fire scar on December 18, 2017. The natural-color Landsat 8 image was draped over an ASTER-derived Global Digital Elevation Model, which shows the topography of the area. The fire raged first near Ventura, then burned the hills around communities of Ojai and Oak View. Firefighters put up a fierce fight and managed to prevent flames from descending into the valley towns. Flames then pushed west toward Summerland, Montecito, and Santa Barbara. As of December 20, the fire was still spreading along the northern edge of the burn scar.
Authorities reported that more than 1,200 structures—most of them in Ventura County—have been destroyed. Several factors came together to make the blaze difficult to control. An usually wet winter and spring in early 2017 caused vegetation to flourish. Then the dry season turned out to be excessively dry, and rains also have been scarce in the typically wetter months of November and December. All of that vegetation dried out and was primed to burn. Once the fire started, warm temperatures and unusually fierce Santa Ana winds caused the fire to spread rapidly.
After nearly two weeks of red flag conditions, a break in the weather has allowed firefighters to beat back the flames in the past few days. But fire officials still do not expect the Thomas fire to be completely contained until January 2018.
References
AccuWeather (2017, December 20) Why the devastating California wildfires have been so unusual, extreme this December. Accessed December 20, 2017.
InciWeb (2017) Thomas Fire. Accessed December 20, 2017.
Los Angeles Times (2017, December 30) Another day of reckoning: Return of powerful winds make Thomas fire dangerous again. Accessed December 20, 2017.
NBC (2017, December 19) Map: How the Thomas Fire Grew Into One of California's Largest Wildfires. Accessed December 20, 2017.
The Wrap (2017, December 11) How They Saved Ojai: A Letter From a Town to Its Firefighters. Accessed December 20, 2017.
NASA Earth Observatory image by Joshua Stevens, using Landsat data from the U.S. Geological Survey and ASTER GDEM data from NASA/GSFC/METI/ERSDAC/JAROS, and U.S./Japan ASTER Science Team. Story by Adam Voiland.
Instrument(s): Terra - ASTERLandsat 8 - OLI
12 notes
·
View notes
Photo

Finney County, Kansas, USA http://ift.tt/2C7w8h4 . http://ift.tt/1WCSb2p . Finney County in southwestern Kansas is now irrigated cropland where once there was shortgrass prairie. Common crops are corn, wheat and sorghum. Green areas in the image are healthy vegetation. Light colored cultivated fields are fallow or recently harvested. The image shows center-pivot irrigation systems that are 800 and 1,600 meters in diameter (think football pitch!). This area utilizes irrigation water from the Ogallala aquifer, that underlies an area from Wyoming to Texas. . Image Credit:NASA/GSFC/METI/Japan Space Systems, and U.S./Japan ASTER Science Team . #earthimages #earthimage #upintheair #abovetheclouds #satelliteimage #satelliteimages #EarthOverhead #overview #overvieweffect #finneycounty #finney #kansas #usa #cropirrigation #irrigaion #circularcrop http://ift.tt/2C8P9zM
6 notes
·
View notes
Video
Impact of Northern California Fires Seen in New NASA Satellite Image by NASA's Marshall Space Flight Center
Via Flickr:
As firefighters continue to work toward full containment of the rash of wildfires burning in Northern California, a new image from the Advanced Spaceborne Thermal mission and Reflection Radiometer (ASTER) instrument on NASA's Terra satellite shows the growing fire scar on the landscape. In this ASTER image, acquired Oct. 21, 2017, vegetation is red, while burned areas appear dark gray. The image covers an area of 38 by 39 miles (60.5 by 63 kilometers) and is located near 38.5 degrees north, 122.4 degrees west. Image credit: NASA/METI/AIST/Japan Space Systems, and U.S./Japan ASTER Science Team Read more NASA Media Usage Guidelines
#NASA#Marshall#Space#Flight#Center#MSFC#JPL#Jet#Propulsion#Laboratory#Earth#Terra#satellite#wildfires#California#Now Playing#27th#October#2017#October 27th 2017
4 notes
·
View notes
Last Seen Blogs

shreyaguptabligs
Untitled

touchandgorp
touch & go !

letstripcycletours-blog
LETS TRIP


willgrey59666
Untitled