#SQL Server Monitoring Tools Market
Explore tagged Tumblr posts
Visit Tumblr Blog
Explore Tumblr blogs with no restrictions, modern design and the best experience.
Last Seen Tumblr Blogs


Fun Fact
Forty percent of Tumblr users are between the ages of 18 to 25.
Text
Why Tableau is Essential in Data Science: Transforming Raw Data into Insights

Data science is all about turning raw data into valuable insights. But numbers and statistics alone don’t tell the full story—they need to be visualized to make sense. That’s where Tableau comes in.
Tableau is a powerful tool that helps data scientists, analysts, and businesses see and understand data better. It simplifies complex datasets, making them interactive and easy to interpret. But with so many tools available, why is Tableau a must-have for data science? Let’s explore.
1. The Importance of Data Visualization in Data Science
Imagine you’re working with millions of data points from customer purchases, social media interactions, or financial transactions. Analyzing raw numbers manually would be overwhelming.
That’s why visualization is crucial in data science:
Identifies trends and patterns – Instead of sifting through spreadsheets, you can quickly spot trends in a visual format.
Makes complex data understandable – Graphs, heatmaps, and dashboards simplify the interpretation of large datasets.
Enhances decision-making – Stakeholders can easily grasp insights and make data-driven decisions faster.
Saves time and effort – Instead of writing lengthy reports, an interactive dashboard tells the story in seconds.
Without tools like Tableau, data science would be limited to experts who can code and run statistical models. With Tableau, insights become accessible to everyone—from data scientists to business executives.
2. Why Tableau Stands Out in Data Science
A. User-Friendly and Requires No Coding
One of the biggest advantages of Tableau is its drag-and-drop interface. Unlike Python or R, which require programming skills, Tableau allows users to create visualizations without writing a single line of code.
Even if you’re a beginner, you can:
✅ Upload data from multiple sources
✅ Create interactive dashboards in minutes
✅ Share insights with teams easily
This no-code approach makes Tableau ideal for both technical and non-technical professionals in data science.
B. Handles Large Datasets Efficiently
Data scientists often work with massive datasets—whether it’s financial transactions, customer behavior, or healthcare records. Traditional tools like Excel struggle with large volumes of data.
Tableau, on the other hand:
Can process millions of rows without slowing down
Optimizes performance using advanced data engine technology
Supports real-time data streaming for up-to-date analysis
This makes it a go-to tool for businesses that need fast, data-driven insights.
C. Connects with Multiple Data Sources
A major challenge in data science is bringing together data from different platforms. Tableau seamlessly integrates with a variety of sources, including:
Databases: MySQL, PostgreSQL, Microsoft SQL Server
Cloud platforms: AWS, Google BigQuery, Snowflake
Spreadsheets and APIs: Excel, Google Sheets, web-based data sources
This flexibility allows data scientists to combine datasets from multiple sources without needing complex SQL queries or scripts.
D. Real-Time Data Analysis
Industries like finance, healthcare, and e-commerce rely on real-time data to make quick decisions. Tableau’s live data connection allows users to:
Track stock market trends as they happen
Monitor website traffic and customer interactions in real time
Detect fraudulent transactions instantly
Instead of waiting for reports to be generated manually, Tableau delivers insights as events unfold.
E. Advanced Analytics Without Complexity
While Tableau is known for its visualizations, it also supports advanced analytics. You can:
Forecast trends based on historical data
Perform clustering and segmentation to identify patterns
Integrate with Python and R for machine learning and predictive modeling
This means data scientists can combine deep analytics with intuitive visualization, making Tableau a versatile tool.
3. How Tableau Helps Data Scientists in Real Life
Tableau has been adopted by the majority of industries to make data science more impactful and accessible. This is applied in the following real-life scenarios:
A. Analytics for Health Care
Tableau is deployed by hospitals and research institutions for the following purposes:
Monitor patient recovery rates and predict outbreaks of diseases
Analyze hospital occupancy and resource allocation
Identify trends in patient demographics and treatment results
B. Finance and Banking
Banks and investment firms rely on Tableau for the following purposes:
✅ Detect fraud by analyzing transaction patterns
✅ Track stock market fluctuations and make informed investment decisions
✅ Assess credit risk and loan performance
C. Marketing and Customer Insights
Companies use Tableau to:
✅ Track customer buying behavior and personalize recommendations
✅ Analyze social media engagement and campaign effectiveness
✅ Optimize ad spend by identifying high-performing channels
D. Retail and Supply Chain Management
Retailers leverage Tableau to:
✅ Forecast product demand and adjust inventory levels
✅ Identify regional sales trends and adjust marketing strategies
✅ Optimize supply chain logistics and reduce delivery delays
These applications show why Tableau is a must-have for data-driven decision-making.
4. Tableau vs. Other Data Visualization Tools
There are many visualization tools available, but Tableau consistently ranks as one of the best. Here’s why:
Tableau vs. Excel – Excel struggles with big data and lacks interactivity; Tableau handles large datasets effortlessly.
Tableau vs. Power BI – Power BI is great for Microsoft users, but Tableau offers more flexibility across different data sources.
Tableau vs. Python (Matplotlib, Seaborn) – Python libraries require coding skills, while Tableau simplifies visualization for all users.
This makes Tableau the go-to tool for both beginners and experienced professionals in data science.
5. Conclusion
Tableau has become an essential tool in data science because it simplifies data visualization, handles large datasets, and integrates seamlessly with various data sources. It enables professionals to analyze, interpret, and present data interactively, making insights accessible to everyone—from data scientists to business leaders.
If you’re looking to build a strong foundation in data science, learning Tableau is a smart career move. Many data science courses now include Tableau as a key skill, as companies increasingly demand professionals who can transform raw data into meaningful insights.
In a world where data is the driving force behind decision-making, Tableau ensures that the insights you uncover are not just accurate—but also clear, impactful, and easy to act upon.
#data science course#top data science course online#top data science institute online#artificial intelligence course#deepseek#tableau
3 notes
·
View notes
Text
What is Power BI Training?
Introduction: The Era of Data-Driven Decision-Making
We're in an age where data isn't merely an asset—it's the guiding light behind key decisions. Whether you're a marketer monitoring consumer habits or a CFO projecting budgets, the power to read data has become essential. And that's where Power BI Training comes into play.

What is Power BI?
Power BI is a dynamic suite of business analytics tools developed by Microsoft. It enables users to transform raw data into interactive dashboards and rich reports. With drag-and-drop simplicity, even non-techies can gain insights at a glance.
Why Power BI is Revolutionizing Business Intelligence
Gone are the days of relying solely on spreadsheets. Power BI has democratized data analysis, giving every team member access to actionable insights. Its cloud-based platform allows real-time sharing and collaboration, a game-changer in today's hybrid workspaces.

The Role of Power BI in Today’s Enterprises
From lean startups to multinational corporations, companies are leveraging Power BI to track performance, streamline operations, and gain a competitive edge. Its compatibility with products such as Excel, Azure, and SQL Server solidifies its position in business ecosystems.
Learning Power BI Training
So, what is Power BI Training, anyway? In short, it's a formal learning process that teaches people how to utilize Power BI efficiently—from linking datasets to designing visually appealing reports.
Central Goals of Power BI Training
Training is intended to assist students in:
Mastering data modeling methods
Building personalized dashboards
Formulating DAX (Data Analysis Expressions) equations
Conducting real-time analysis
Securely sharing reports across platforms
Who Should Enroll in Power BI Training?
If you're an IT professional, business analyst, project manager, or simply a data enthusiast who wants to know more, Power BI training provides a competitive advantage. It's perfect for anyone who wants to close the gap between decision-making and data.
Beginner to Advanced: The Training Levels Explained
Most training courses are categorized into levels:
Beginner Level: Power BI interface introduction, loading data, and simple visuals
Intermediate: Data transformation, DAX basics, relational modeling
Advanced: Advanced DAX, Power Query M, performance optimization, and report automation
In-Person vs Online Power BI Training
Deciding between in-person and online is based on your learning preference. Online provides flexibility and self-paced modules. Conversely, in-person sessions offer immersive, instructor-led experiences—perfect for collaborative learners.
Curriculum Overview: What to Expect from a Power BI Course
Courses usually include:
Power BI Desktop & Service
Data import/export and cleansing
Visual storytelling using charts, KPIs, and maps
Integration with Excel and other Microsoft services
Gateway setup and cloud publishing
Hands-On Learning: The Significance of Real-Time Data Projects
Theory is not enough. Renowned courses incorporate real-world projects to mimic real-world work. You may examine sales patterns, create marketing dashboards, or even visualize IoT data streams—connecting learning and application.
Certification and Career Enhancement
Completing a training course also often leads to a recognized certification. This is not just a piece of paper—it's a career enhancer. Certified experts receive higher paychecks and have wider job opportunities in analytics and BI positions.
Organizational Benefits of Power BI Training
Businesses investing in Power BI Training empower their workers to make smarter, quicker decisions. This promotes a data-first culture, increases operational efficiency, and delivers improved customer experiences through data-driven strategies.
Selecting the Appropriate Training Provider
There is no single course that is equal to others. Opt for providers who have current content, certified instructors, project-based training, and after-course assistance. Reviews and feedback from other students are also excellent determinants of quality.
Power BI Training in Singapore: What Sets It Apart?
Power BI Training in Singapore is practical in its orientation, merging international standards with regional industry application cases. Singapore's focus on digital transformation means that it is a hub for data professionals looking for high-quality instruction.
Power BI Training in Sydney: Why It's in High Demand
With Sydney quickly emerging as a finance and technology hub, Power BI Training in Sydney has increased. Firms here are incorporating BI into their business strategies, resulting in strong demand for experts.
Power BI Training in Melbourne: An Emerging Hub for Data Enthusiasts
A power BI training in melbourne presents a thrilling learning environment for students. Be it universities or private schools, the city encourages innovation, making it the perfect place for individuals looking to enter data-oriented professions
0 notes
Text
6 Powerful Ways Power BI Transforms Your Business Operations
Let’s get straight to the point—Power BI’s top selling points are its robust features, intuitive design, and cost-effectiveness.
In today’s hyper-connected world, data is the new bacon—hot, in-demand, and irresistible! And why not? It drives customer behavior, shapes internal strategies, and helps business leaders make smart decisions.
But here's the catch: raw data alone isn’t valuable unless it’s well-structured, visualized, and actionable. That’s where Microsoft Power BI steps in, transforming your data chaos into clarity.

What is Power BI and Why Should You Care?
According to Microsoft, Power BI is a unified, scalable business intelligence (BI) platform that enables you to connect, model, and visualize any kind of data. It supports self-service BI, as well as enterprise-level analytics.
Power BI helps you gather, visualize, and analyze large volumes of business-critical data in a way that’s simple, engaging, and easy to digest. You can finally ditch those dull spreadsheets and lengthy reports and get everything you need—right on a single dashboard, through eye-catching graphs and interactive charts.
Power BI also shares a familiar interface with Microsoft Excel, so even non-tech-savvy users can jump in and start using it with minimal training. Plus, it integrates effortlessly with Microsoft 365 tools, cloud platforms, and external databases.
6 Ways Power BI Enhances Your Business Processes
Let’s break down how Power BI can elevate your operations, streamline decision-making, and maximize return on investment.
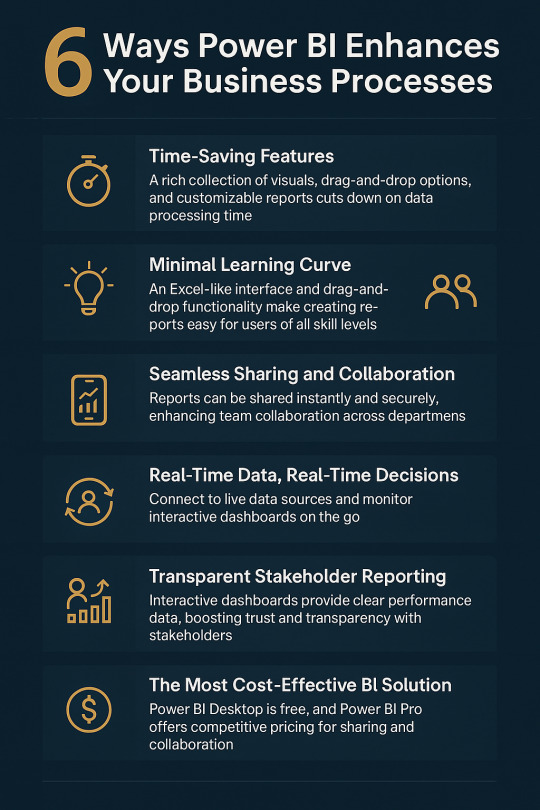
1. Time-Saving Features That Make a Big Difference
Power BI comes packed with a rich library of pre-built visuals, drag-and-drop elements, and highly customizable reports that significantly reduce the time spent on data processing.
Key time-saving features include:
Natural language queries: Ask questions like “What were sales last month?” and get instant charts.
Bookmarks, filters, and parameters: Personalize data stories based on your audience.
Zoom sliders: Easily navigate complex data.
DAX (Data Analysis Expressions): A powerful formula language for creating complex measures.
With Microsoft continuously adding updates, Power BI is always getting smarter.
2. Minimal Learning Curve
One of the biggest fears businesses have when adopting new software is the learning curve. But Power BI removes that barrier entirely.
Thanks to its Excel-like interface and drag-and-drop functionality, even first-time users can build impressive reports and dashboards. Your team doesn't need to be made up of data scientists—they just need a little curiosity and creativity.
For more advanced users, there’s support for:
M-Query for data transformation
DAX for advanced calculations
Python and SQL integration for deep-level analytics
Whether you’re a beginner or a pro, Power BI caters to all skill levels.
3. Seamless Sharing and Collaboration
Power BI takes team collaboration to the next level.
With Power BI Pro, users can:
Share reports instantly across departments
Embed dashboards into SharePoint, Teams, or your website
Schedule automatic report updates
Grant secure access to stakeholders and clients
Forget endless email chains and outdated attachments. With Power BI, everyone gets real-time access to the same data, keeping teams aligned and productive.
4. Real-Time Data, Real-Time Decisions
In a rapidly changing market, real-time insights can be a game-changer.
Power BI allows you to connect to live data sources—whether it's social media, SQL servers, CRM platforms, or cloud apps. By setting up an on-premises data gateway, your dashboards stay continuously updated.
You can even view interactive dashboards from your mobile device, so you’re never out of the loop—even on the go.
Example: Your support team can monitor live call logs to instantly spot and resolve customer wait-time issues.
That’s the power of timely decision-making.
5. Build Trust with Transparent Stakeholder Reporting
Let’s face it—no one likes long, text-heavy reports anymore.
Power BI enables you to present complex business performance data in an engaging, visual format that your stakeholders will love. From executives to investors, interactive dashboards help convey KPIs and results clearly and persuasively.
Reports can be accessed from any device at any time, building transparency and boosting stakeholder confidence.
And the best part? Updates are reflected automatically, ensuring they’re always seeing the most current data.
6. The Most Cost-Effective BI Solution on the Market
Cost plays a major role in decision-making, and Power BI truly stands out in this regard. Power BI Desktop is completely free—just download it and begin building interactive, data-rich reports right away.
For sharing and collaboration, Power BI Pro is available at just $9.99 per user per month. It allows you to publish dashboards on-premises and effortlessly share them with your team by simply sending a link.
Compared to other business intelligence tools, Power BI offers a highly competitive pricing model. When you factor in its powerful features and capabilities, it becomes clear that Power BI delivers exceptional value for your investment.
FAQs
1. Is Power BI suitable for beginners? Yes! With its Excel-like feel and drag-and-drop features, Power BI is designed for users at all levels.
2. How secure is Power BI for business data? Power BI uses Microsoft’s robust security protocols, including data encryption, role-based access, and compliance with GDPR.
3. Can I customize dashboards for different departments? Absolutely. Power BI lets you create department-specific views, filters, and dashboards based on the role or access level.
4. Does Power BI work offline? Power BI Desktop works offline for data modeling and report building. Online features like sharing and collaboration require internet access.
5. How often does Power BI get updates? Microsoft releases monthly feature updates, keeping the platform modern and user-friendly.
#power bi consulting services#generative ai#power bi solutions#data analytics#data analytics services#Power BI
0 notes
Text
How to Hire the Right MySQL Engineer: Skills to Look For

For any business that handles structured data a solid database foundation serves as the key. MySQL continues to dominate the market as one of the most reliable and widely utilized relational database systems. Whether it’s managing e-commerce transactions, user profiles, or analytics, having the right talent can have a significant impact on performance and scalability.
That’s why several tech companies are considering hiring database engineers with MySQL proficiency. This helps to manage the growing database needs. But how do you know that you are hiring the right fit for the job? In this article we will breakdown what you need to look for when you set out to hire these experts.
Key Technical and Practical Skills Every Business Should Prioritize
Strong knowledge of SQL and database design
Fundamental SQL expertise is a must when hiring MySQL engineers. Your ideal applicant ought to:
Create secure and optimized SQL queries.
Recognize data modelling and normalization.
Understand performance indexing techniques.
Have the ability to create triggers and stored procedures.
These abilities allow a MySQL engineer to increase speed and storage efficiency, which is essential for rapidly expanding tech companies.
Experience in performance tuning and troubleshooting
Performance issues arise as your data grows. A proficient MySQL developer ought to be able to:
Find and fix slow queries.
Keep an eye on and maximize database load.
Make use of programs such as MySQLTuner, EXPLAIN, and performance schema.
Set up the server's parameters for best performance.
In SaaS setups or real-time applications where latency is a concern, this becomes even more crucial.
Data backup, security, and recovery skills
A business can be destroyed by data breaches or loss. A trustworthy MySQL developer will:
Configure automated backup plans.
Put user roles and permissions into practice.
Secure connections and encrypt data.
Create scenarios for catastrophe recovery.
These abilities guarantee data security and regulatory compliance, which is particularly important for the high-security, healthcare, and financial sectors.
Integration and collaboration capabilities
MySQL engineers don't work alone. They frequently work along with software developers and backend teams. You might also have to:
Fill positions like hiring backend developers to assist with application-side logic.
Employ database engineers for distributed or more complicated settings.
Hire software developers to create data-driven, scalable products.
A MySQL engineer with cross-departmental collaboration skills guarantees more efficient operations and agile delivery.
Familiarity with modern tools and frameworks
Present-day MySQL programmers must to be knowledgeable about:
ORMs such as Eloquent, Sequelize, or Hibernate.
Cloud-based solutions like Google Cloud SQL and AWS RDS.
Tools for monitoring such as Prometheus or Datadog.
Pipelines for CI/CD database updates.
For the majority of tech businesses that use cloud-native solutions, this demonstrates adaptability in contemporary development settings.
Closing Remarks
If you are serious about your data infrastructure, you should hire MySQL developers. Seek applicants that have excellent technical proficiency together with teamwork and problem-solving abilities. Results can be increased by matching your MySQL specialist with the appropriate team, such as hiring software engineers, regardless of whether you're managing a legacy system or scaling a SaaS platform. Choosing the proper database hiring is a commercial choice for tech firms, not just a backend one.
0 notes
Text
The Power of Azure: Transforming Businesses with Cloud and Hybrid Solutions
Cloud computing has become a fundamental building block for modern enterprises. By providing on-demand access to computing resources, businesses can deploy applications faster, manage data more securely, and reduce infrastructure overhead. Microsoft Azure, in particular, stands out as a comprehensive cloud platform offering a rich suite of services for development, analytics, security, and more. This article explores the growing importance of Azure cloud solutions, delves into the concept of hybrid deployments, and shares best practices for organizations seeking agility and scalability in a competitive market.
1. The Rise of Cloud Computing
Over the last decade, cloud computing has reshaped how companies think about technology. Rather than maintaining physical servers on-site, businesses can tap into virtualized resources from data centers distributed worldwide. This shift not only cuts capital expenses but also enables rapid innovation and global reach. As more organizations adopt flexible work models and expand their digital services, cloud adoption continues to accelerate.
Azure has become a go-to choice because it integrates seamlessly with Microsoft’s ecosystem. Businesses already using Office 365 or other Microsoft products find the transition smoother, benefiting from a unified environment that covers email hosting, collaboration tools, and data management solutions.
2. Exploring Azure Cloud Solutions
The term Azure cloud solutions encompasses a vast range of services. Whether you’re looking to build a simple e-commerce website or implement advanced AI-driven analytics, Azure offers tools and frameworks that can be tailored to your needs. Key services include:
Compute — Virtual machines, containers, and serverless functions that let you deploy and scale applications rapidly.
Storage — Durable storage solutions for structured and unstructured data, backed by high availability and redundancy.
Networking — Virtual networks, load balancers, and gateways ensuring secure and optimized communication between services.
Databases — Fully managed SQL and NoSQL databases with built-in scalability features.
DevOps — Continuous integration and continuous deployment (CI/CD) pipelines, along with monitoring and logging tools.
These services interconnect, helping teams quickly prototype, launch, and refine solutions without dealing with underlying hardware complexities.
3. Embracing Hybrid: Azure Hybrid Cloud Solutions
Some organizations prefer retaining certain parts of their infrastructure on-premises, whether for compliance reasons, latency requirements, or existing investments in data centers. Azure hybrid cloud solutions make it easier to bridge on-premises systems with cloud-based services, creating a seamless environment for data and application management.
This approach enables companies to run sensitive workloads locally while offloading more flexible processes — like data analytics or large-scale testing — to the cloud. Hybrid solutions also support edge computing scenarios where real-time data processing needs to occur close to the source, but you still want centralized oversight and analytics in the cloud.
4. Key Benefits of Azure for Businesses
Scalability Azure can handle sudden spikes in usage without compromising performance. This elasticity ensures that applications remain responsive, even under unforeseen load increases.
Cost Management Instead of investing heavily in hardware, businesses pay for the exact resources they use. Azure’s built-in monitoring tools provide transparency into consumption, helping organizations optimize budgets.
Global Reach With data centers spanning multiple continents, Azure supports geo-redundancy and localized hosting options. Companies can deploy workloads closer to their user base, reducing latency and improving experience.
Security and Compliance Azure adheres to stringent security measures and various regulatory standards (e.g., GDPR, HIPAA). These built-in protections and certifications help businesses meet compliance requirements more easily.
Integration with Existing Tools Many enterprises rely on Microsoft products. Azure’s native compatibility streamlines integration, making migrations less disruptive and expansions more intuitive.
5. Ensuring Security and Compliance
Security remains a top concern for cloud adopters. Azure addresses this through multiple layers of protection, including:
Identity and Access Management — Azure Active Directory grants granular control over user access to applications and resources.
Network Security — Tools like Azure Firewall and Network Security Groups help safeguard data in transit.
Threat Detection — Azure Security Center continuously monitors for potential threats, offering real-time recommendations.
In regulated industries, compliance is non-negotiable. Azure meets stringent standards, from ISO certifications to country-specific mandates. Businesses can leverage these compliance features to maintain trust with customers and regulators.
6. Best Practices for Implementation
Assess Current Workloads Conduct a thorough audit of your existing infrastructure to identify which applications, databases, or services are prime candidates for the cloud.
Start Small Begin with a pilot project or a non-critical workload. This allows teams to gain familiarity with Azure’s environment and refine processes before scaling up.
Leverage Automation Tools like Azure Resource Manager templates and Azure DevOps pipelines help automate deployment, minimize manual errors, and foster consistency.
Monitor and Optimize Continuously track performance metrics. Use Azure Monitor, Application Insights, or third-party solutions to identify bottlenecks and ensure resources align with usage patterns.
Train Teams Equip your IT staff and developers with the necessary Azure certifications or training programs, ensuring they can fully utilize available features.
7. Real-World Use Cases
E-Commerce Growth: Retailers rely on Azure to handle flash sales and seasonal traffic spikes. By autoscaling resources, they avoid site crashes and maintain a smooth shopping experience.
Healthcare Data Management: Hospitals store patient records in secure cloud databases while running advanced analytics to improve diagnostic accuracy. Hybrid deployments allow critical data to stay on-premises for compliance, with aggregated data processed in the cloud.
IoT Implementations: Manufacturers monitor machinery and collect telemetry data in real-time, leveraging Azure IoT services for predictive maintenance and optimization.
8. Looking Ahead: The Future of Azure
Microsoft continues to invest heavily in Azure, focusing on areas like AI, machine learning, and quantum computing. Upcoming features aim to accelerate development cycles, enhance security, and offer deeper integrations with open-source tools. As edge computing gains momentum, expect Azure services that cater to processing closer to data sources — reducing latency and enabling new, data-driven innovations.
Thus, these examples highlight how Azure’s robust feature set meets diverse industry requirements, whether purely in the cloud or combined in a hybrid model.
0 notes
Text
This is true with Integrated Report System Company who’s specialty includes conceptualizing programs that assists sales oriented industries become a market leader. These programs work well with firms that requires vast resources of information to be broken down, analyzed, compare and plotted, useful in establish a strong foundation of judgments. This web based business intelligence software provides a concrete and accurate data collection and analysis that helps small and medium scale industries anticipate/plan their move and realize strategies that could allow them to achieve their goal for their product. The business activities and functions this software supports is basically sales related, a sales interactive reporting designed to fit the needs of Sales reps and mangers, CEOs and CFOs, product or account managers, whereby necessary market information and trend are made available through data collection and banking together with other programs that monitors the movement and turnover of their product. This system also allows the abovementioned individuals a critical view of the business that necessitates well calculated anticipation and aggressive moves. Interactive Reporting system provides state of the art tools for integrated interactive reporting such that makes use of templates which encapsulates pertinent records of transaction history and other raw data that can be inquired upon, and a mapping technology that connects the user to their data source. These tools are set to be modularized and separated from a specific installation which therefore "permits the re-use of logic, the provisioning of the BI integration process by domain experts and the significant reductions in the cost and time required for an enterprise's acquisition of BI capabilities". More specifically, these tools are "highly scalable; flexible in design; easily integrated into any data source; have a unified view with drill-down capability and an 'Out-Of-The-Box Solution' that runs on top of any system leveraging existing IT investments.This software supports Microsoft SQL Server, Oracle, MS Access, Informix, MySQL and IBM DB2. It is a web based intranet product that uses data extracted from your data warehouse. It also provides a standardized templates and mappings so you don't need to design sales reports or spreadsheets from scratch. With Integrated Reporting highly critical information pertaining to sales function are easily accessible and comprehended in terms of what products being sold, areas of distribution, means and method of positioning, and most importantly its corresponding figures. With this in hand, reporting and analysis is made easy, while concrete and immediate solutions are readily perceived. This software assumes that there is a preexisting operating system installed as well as a network, as it simply brings you into using existing software in any activity you wish to engage upon, whether creating spreadsheets or report templates. Read the full article
0 notes
Text
Top Power BI Plugins and Add-ons to Elevate Your Dashboards

Microsoft Power BI is a powerful tool for data visualization, but did you know that its capabilities can be significantly enhanced with plugins and add-ons? These extensions introduce advanced features, better integrations, and improved automation to help you get the most out of your dashboards. Whether you're looking to enhance visuals, streamline workflows, or integrate AI-driven insights, the right plugins can make a huge difference.
Why Use Power BI Plugins and Add-ons?
While Power BI comes with a strong set of built-in features, add-ons provide specialized functionalities that help users:
Connect to a broader range of data sources
Improve the depth and quality of visualizations
Automate manual and repetitive tasks
Boost dashboard performance and efficiency
Leverage artificial intelligence for deeper insights
Let’s explore some of the most effective Power BI plugins and add-ons that can take your data analytics game to the next level.
1. Explore the Power BI Visuals Marketplace
The Power BI Visuals Marketplace is a treasure trove for anyone looking to expand the software's native visualization options. It hosts a collection of custom visuals developed by Microsoft and third-party developers, including:
Charticulator: A tool that allows users to craft unique, complex chart types.
Synoptic Panel: Enhances geographical visualizations using custom images.
Bullet Chart: Ideal for monitoring key performance indicators (KPIs).
Word Cloud: An engaging way to visualize textual data.
2. Zebra BI for Enhanced Financial Dashboards
Zebra BI is a go-to plugin for professionals who require high-quality financial reporting. Its standout features include:
Advanced waterfall charts for cash flow analysis
Interactive tables that allow data exploration
Small multiples for detailed comparisons
Compliance with International Business Communication Standards (IBCS)
Finance teams and executives looking for precise, standardized reporting will find this tool particularly beneficial.
3. Power Automate Visual for Seamless Workflow Integration
Power Automate helps users streamline their workflow processes directly from Power BI. With this integration, you can:
Automate report distribution via email
Set up triggers for notifications based on dashboard data
Seamlessly connect Power BI with Microsoft 365 apps like Outlook, SharePoint, and Teams
This automation add-on can save valuable time and reduce manual effort.
4. Data Connectivity Add-ons for Power BI
Efficient data integration is key to effective decision-making. Some of the top Power BI add-ons for data connectivity include:
Azure Data Lake Storage: Ideal for handling large-scale data analytics.
SQL Server Integration Services (SSIS): Streamlines data extraction, transformation, and loading (ETL).
Google Analytics Connector: Imports web analytics data for marketing insights.
SAP HANA Connector: Integrates enterprise-level business data seamlessly.
5. Unleash the Power of R and Python in Power BI
Power BI’s ability to integrate R and Python makes it a favorite among data scientists. These scripting tools allow users to:
Perform complex statistical analysis
Build machine learning models within Power BI
Develop custom visualizations beyond standard capabilities
This is particularly beneficial for advanced analytics professionals who require deeper insights from their data.
6. AI-Powered Insights with Smart Narrative
The Smart Narrative feature uses AI to automatically generate explanations for your data. Key advantages include:
Automated insights based on dashboard trends
Context-aware narratives for better storytelling
Natural language explanations that make reports more user-friendly
This tool is ideal for business users who want data-driven insights without diving into technical complexities.
7. Power BI Embedded for Seamless App Integration
Power BI Embedded enables businesses to integrate Power BI reports directly into their applications. Key features include:
Custom report embedding into web and mobile apps
Full API access for greater control over data visualization
White-labeling options to maintain brand identity
This solution is particularly useful for SaaS providers and enterprise applications that require integrated data analytics.
8. Paginated Reports with Power BI Report Builder
Paginated Reports allow users to create detailed, print-ready reports. Features include:
Multi-page reports with structured layouts
Custom formatting with headers, footers, and styling options
Export capabilities for PDF, Excel, and Word formats
This add-on is a must-have for teams that require highly formatted reports, such as finance and compliance departments.
9. Optimize Performance with Power BI Performance Analyzer
If you’re experiencing slow dashboard performance, the Power BI Performance Analyzer can help by:
Identifying slow-loading visuals
Measuring query execution time
Offering optimization recommendations
This tool is essential for Power BI developers looking to fine-tune their dashboards for maximum efficiency.
10. Advanced Mapping with Esri ArcGIS Maps for Power BI
For those who need more than just basic mapping features, Esri ArcGIS Maps offers advanced geographic visualizations. Key benefits include:
Enhanced spatial analysis capabilities
Geocoding and location-based data insights
Heat maps and clustering tools
Industries like retail, real estate, and logistics can benefit significantly from this powerful mapping add-on.
Take Your Power BI Skills to the Next Level with Boston Institute of Analytics (UAE)
If you want to build expertise in Power BI and data science, an online course can provide structured learning. The Boston Institute of Analytics (BIA) offers an Online Data Science Course UAE, designed for both beginners and professionals. This course covers:
Data visualization using Power BI and Tableau
Hands-on training with Python and R for analytics
Introduction to machine learning and AI-driven insights
Big data processing and cloud computing fundamentals
Final Thoughts
Power BI add-ons and plugins offer an excellent way to maximize your data visualization and analytics capabilities. Whether you need better data connectivity, AI-powered insights, or workflow automation, these tools can help you optimize your dashboards and make more informed decisions.
For those interested in mastering Power BI and data science, enrolling in a structured course like the Data Science Course can provide you with the hands-on skills and knowledge needed to succeed in the evolving world of data analytics.
Start exploring these Power BI plugins today and take your data visualization to the next level!
#Best Data Science Institute#Best Online Data Science Programs#Data Science Program#Best Data Science Programs#Online Data Science Course#Online Data Science Course UAE#AI Training Program
1 note
·
View note
Text
Mastering Power BI Dashboards
In today’s data-driven world, businesses rely heavily on insightful analysis to make informed decisions. Power BI, developed by Microsoft, has emerged as one of the leading business intelligence tools that help organizations convert raw data into interactive and visually compelling dashboards. Whether you are a business analyst, data professional, or a beginner exploring data visualization, mastering Power BI dashboards can significantly enhance your analytical capabilities.
Understanding Power BI Dashboards
A Power BI dashboard is a collection of visual elements, including charts, graphs, maps, and tables, designed to present a consolidated view of data. Unlike reports, which can be multiple pages long, dashboards are single-page, interactive snapshots that provide key insights at a glance. They pull data from multiple sources, ensuring that businesses can track key performance indicators (KPIs) and trends effectively.
Dashboards in Power BI are often used for:
Business Performance Monitoring: Tracking sales, revenue, and operational efficiency.
Customer Insights: Understanding purchasing behaviors and customer engagement.
Financial Analysis: Evaluating profit margins, expenses, and budget allocations.
Marketing Performance: Analyzing campaign success and return on investment.
Why Power BI Dashboards Are Essential
Power BI dashboards are widely used across industries due to their flexibility, scalability, and integration capabilities. Here are some key reasons why they have become indispensable:
1. Real-Time Data Analysis
Power BI dashboards can connect to live data sources, ensuring that users receive up-to-date insights in real-time. This capability is crucial for businesses that rely on dynamic data, such as e-commerce platforms or financial institutions.
2. User-Friendly Interface
With a drag-and-drop functionality, Power BI makes it easy to create stunning dashboards without requiring advanced coding skills. This democratizes data analysis, allowing even non-technical users to build meaningful visualizations.
3. Seamless Integration
Power BI integrates seamlessly with various Microsoft tools like Excel, Azure, and SQL Server, as well as third-party applications such as Google Analytics, Salesforce, and SAP. This ensures smooth data flow and analysis from multiple sources.
4. Customization and Interactive Features
Users can customize dashboards based on their specific requirements, apply filters, and use drill-down features to explore detailed insights. This level of interactivity makes dashboards more engaging and useful for decision-making.
5. Enhanced Collaboration
Power BI’s cloud-based service allows teams to share dashboards securely, enabling collaborative decision-making. Users can also access dashboards on mobile devices, ensuring data accessibility from anywhere.
How to Build an Effective Power BI Dashboard
Creating a well-structured Power BI dashboard requires a clear understanding of business objectives, data sources, and visualization techniques. Follow these steps to build an impactful dashboard:
Step 1: Define Your Objectives
Before designing a dashboard, determine what insights you need to extract. Are you tracking sales growth? Analyzing website traffic? Understanding customer demographics? Defining clear objectives ensures that your dashboard serves its intended purpose.
Step 2: Collect and Prepare Data
Gather data from relevant sources, such as databases, APIs, spreadsheets, or cloud services. Clean and transform the data to ensure accuracy, consistency, and usability. Power BI’s Power Query Editor helps in cleaning and shaping data efficiently.
Step 3: Choose the Right Visualizations
Select charts, graphs, and tables that best represent your data. Some commonly used visualizations in Power BI dashboards include:
Bar Charts: Best for comparing categorical data.
Line Charts: Ideal for tracking trends over time.
Pie Charts: Suitable for showing proportions.
Maps: Useful for geographical analysis.
KPI Indicators: Highlight performance metrics at a glance.
Step 4: Design an Intuitive Layout
A well-organized layout enhances readability and engagement. Place the most important insights at the top, use contrasting colors to highlight key metrics, and avoid cluttering the dashboard with unnecessary elements.
Step 5: Implement Filters and Slicers
Filters and slicers allow users to interact with the dashboard and customize the data displayed. This adds flexibility and makes the dashboard more user-centric.
Step 6: Test and Optimize
Before sharing the dashboard, test its functionality by exploring different scenarios. Optimize loading speed by minimizing unnecessary calculations and large datasets. Ensure that the dashboard is responsive across different devices.
Best Practices for Power BI Dashboards
To create high-impact Power BI dashboards, follow these best practices:
Keep It Simple: Avoid overcrowding the dashboard with too many visuals. Focus on key insights.
Use Consistent Colors and Themes: Maintain a uniform color scheme to enhance visual appeal.
Leverage Data Storytelling: Present data in a way that tells a compelling story, making it easier for users to interpret.
Ensure Data Accuracy: Regularly update data sources to maintain credibility.
Enable Performance Optimization: Optimize DAX calculations and data models to enhance dashboard efficiency.
Conclusion
Mastering Power BI dashboards is a valuable skill that can boost career opportunities in data analytics, business intelligence, and decision-making roles. With its user-friendly interface, real-time data capabilities, and seamless integration, Power BI has become the go-to tool for professionals across various industries. Whether you are a beginner or an experienced analyst, learning Power BI through the best course can enhance your ability to create powerful dashboards that drive business success. Start exploring Power BI today and unlock the potential of data visualization for informed decision-making.
0 notes
Text
The Power of Power BI: Transforming Data into Action
In today’s digital age, data is one of the most valuable assets for businesses. However, having data alone is not enough—it needs to be transformed into meaningful insights that drive decision-making. This is where Power BI, Microsoft’s business intelligence tool, comes into play. For those looking to enhance their skills, Power BI Online Training & Placement programs offer comprehensive education and job placement assistance, making it easier to master this tool and advance your career.

Power BI enables organizations to visualize data, analyze trends, and make data-driven decisions that lead to business growth. Let’s explore how Power BI can revolutionize the way businesses use data.
1. What is Power BI?
Power BI is a powerful business analytics tool that allows businesses to connect, visualize, and analyze their data from multiple sources. It enables users to create interactive dashboards, reports, and real-time analytics to make informed decisions.
2. Key Features That Make Power BI a Game-Changer
a) Interactive Dashboards and Data Visualization
Power BI turns raw data into stunning, easy-to-understand charts, graphs, and reports. These visuals help businesses quickly identify patterns and make better decisions.
b) Real-Time Data Insights
With Power BI’s real-time analytics, businesses can track sales, customer interactions, and operational metrics as they happen. This allows organizations to react quickly to market changes and optimize strategies instantly.
c) AI-Powered Analytics
Power BI uses artificial intelligence and machine learning to analyze complex data sets and uncover hidden patterns. Features like Power BI Q&A allow users to ask questions in plain language and receive instant, data-driven answers.
d) Seamless Data Integration
Power BI connects with over 100+ data sources, including:
Microsoft Excel, SQL Server, and Azure
Google Analytics, Salesforce, and SAP
Cloud services like AWS and Google Cloud This makes it easy for businesses to combine data from different platforms for a holistic view of their operations.
e) Enhanced Security and Compliance
Power BI ensures that sensitive business data remains secure and compliant with industry regulations like GDPR, ISO, and HIPAA. Role-based access controls and data encryption add an extra layer of protection. It’s simpler to master this tool and progress your profession with the help of Best Online Training & Placement programs, which provide thorough instruction and job placement support to anyone seeking to improve their talents.
3. How Power BI Helps Businesses Make Smarter Decisions
a) Data-Driven Strategy Development
With Power BI, businesses can analyze past performance and forecast future trends, helping leaders make strategic, data-backed decisions.
b) Optimizing Operational Efficiency
Companies can monitor supply chains, employee productivity, and business processes in real time, allowing them to identify inefficiencies and improve operations.
c) Improving Customer Insights
By analyzing customer behavior and purchasing patterns, businesses can create personalized marketing strategies, boost customer engagement, and increase sales.
d) Financial Performance and Budgeting
Power BI allows finance teams to track revenues, expenses, and profitability with automated reports, making budget planning and financial forecasting easier.
4. Why Businesses Should Invest in Power BI
Cost-effective – Power BI offers affordable solutions for businesses of all sizes.
User-friendly – No extensive coding knowledge is required to create dashboards and reports.
Scalable – Whether you’re a startup or a large enterprise, Power BI grows with your business needs.
Cloud and on-premise options – Businesses can choose between cloud-based or on-premise deployment for flexibility.
5. Industries Benefiting from Power BI
Retail and e-commerce – Track sales, customer behavior, and product performance.
Healthcare – Monitor patient data, optimize resource allocation, and improve efficiency.
Finance and banking – Analyze financial performance, detect fraud, and manage risk.
Manufacturing – Optimize supply chain operations, reduce costs, and improve productivity.
Education – Track student performance, manage resources, and enhance learning experiences.
Conclusion
Power BI is revolutionizing the way businesses harness the power of data. By turning complex data into actionable insights, businesses can optimize operations, improve customer engagement, and drive revenue growth. Whether you are a small business, enterprise, or entrepreneur, Power BI provides the tools you need to make smarter, data-driven decisions.
0 notes
Text
Golang developer,
Golang developer,
In the evolving world of software development, Go (or Golang) has emerged as a powerful programming language known for its simplicity, efficiency, and scalability. Developed by Google, Golang is designed to make developers’ lives easier by offering a clean syntax, robust standard libraries, and excellent concurrency support. Whether you're starting as a new developer or transitioning from another language, this guide will help you navigate the journey of becoming a proficient Golang developer.
Why Choose Golang?
Golang’s popularity has grown exponentially, and for good reasons:
Simplicity: Go's syntax is straightforward, making it accessible for beginners and efficient for experienced developers.
Concurrency Support: With goroutines and channels, Go simplifies writing concurrent programs, making it ideal for systems requiring parallel processing.
Performance: Go is compiled to machine code, which means it executes programs efficiently without requiring a virtual machine.
Scalability: The language’s design promotes building scalable and maintainable systems.
Community and Ecosystem: With a thriving developer community, extensive documentation, and numerous open-source libraries, Go offers robust support for its users.
Key Skills for a Golang Developer
To excel as a Golang developer, consider mastering the following:
1. Understanding Go Basics
Variables and constants
Functions and methods
Control structures (if, for, switch)
Arrays, slices, and maps
2. Deep Dive into Concurrency
Working with goroutines for lightweight threading
Understanding channels for communication
Managing synchronization with sync package
3. Mastering Go’s Standard Library
net/http for building web servers
database/sql for database interactions
os and io for system-level operations
4. Writing Clean and Idiomatic Code
Using Go’s formatting tools like gofmt
Following Go idioms and conventions
Writing efficient error handling code
5. Version Control and Collaboration
Proficiency with Git
Knowledge of tools like GitHub, GitLab, or Bitbucket
6. Testing and Debugging
Writing unit tests using Go’s testing package
Utilizing debuggers like dlv (Delve)
7. Familiarity with Cloud and DevOps
Deploying applications using Docker and Kubernetes
Working with cloud platforms like AWS, GCP, or Azure
Monitoring and logging tools like Prometheus and Grafana
8. Knowledge of Frameworks and Tools
Popular web frameworks like Gin or Echo
ORM tools like GORM
API development with gRPC or REST
Building a Portfolio as a Golang Developer
To showcase your skills and stand out in the job market, work on real-world projects. Here are some ideas:
Web Applications: Build scalable web applications using frameworks like Gin or Fiber.
Microservices: Develop microservices architecture to demonstrate your understanding of distributed systems.
Command-Line Tools: Create tools or utilities to simplify repetitive tasks.
Open Source Contributions: Contribute to Golang open-source projects on platforms like GitHub.
Career Opportunities
Golang developers are in high demand across various industries, including fintech, cloud computing, and IoT. Popular roles include:
Backend Developer
Cloud Engineer
DevOps Engineer
Full Stack Developer
Conclusion
Becoming a proficient Golang developer requires dedication, continuous learning, and practical experience. By mastering the language’s features, leveraging its ecosystem, and building real-world projects, you can establish a successful career in this growing field. Start today and join the vibrant Go community to accelerate your journey.
0 notes
Text
GCP Managed Services: Enhancing Business Efficiency

Expert GCP Managed Services – Goognu
In the ever-evolving world of technology, businesses strive to stay ahead by adopting modern tools and platforms that enhance efficiency, scalability, and security. One such solution is GCP Managed Services, which offers an array of cloud-based tools and services to help businesses thrive. This article delves into the benefits, features, and expertise of Goognu, a leading provider of GCP Managed Services, and how it empowers organizations to achieve their business goals.
What Are GCP Managed Services?
GCP Managed Services encompass a variety of cloud-based infrastructure, platform, and software solutions offered by Google Cloud Platform (GCP). These services enable businesses to build, deploy, and scale applications efficiently without the hassle of managing the underlying infrastructure. With advanced automation and intelligent analytics, GCP Managed Services provide organizations with access to Google’s global network of data centers, either for free or on a pay-per-use basis.
Organizations can rely on GCP Managed Services for one-time needs like cloud migration or disaster recovery, as well as for day-to-day operations of their workloads. By leveraging these services, businesses can reduce costs, minimize time-to-market, and focus on their core activities.
Why Choose Goognu for GCP Managed Services?
Goognu is a trusted name in the field of GCP Managed Services, offering a comprehensive range of solutions to help businesses optimize their cloud infrastructure and applications. With over 13 years of experience in the industry, Goognu has become a go-to provider for organizations seeking expertise in cloud technology.
Expertise in Cloud Management
Goognu’s team of skilled cloud engineers specializes in managing GCP environments for some of the largest organizations across various industries. Their expertise includes:
Data Management: Using tools like Google BigQuery to batch upload or stream data, analyze it, and produce actionable insights through visualization.
Cloud Monitoring: Providing visibility into applications and infrastructure, whether on GCP, hybrid, or multi-cloud setups.
Container Management: Deploying and managing containerized applications with Kubernetes and GKE for efficient container orchestration.
Database Services: Maintaining and administering relational databases such as MySQL, PostgreSQL, and SQL Server.
CI/CD Pipeline Setup: Using tools like Google Cloud Build, Jenkins, or GitLab CI/CD to automate build, test, and deployment processes.
Cloud Migration: Planning and executing smooth transitions of applications, data, and workloads to GCP.
Enhanced Security and Compliance
Security is a top priority for Goognu. Their services include implementing industry-standard security practices, managing access controls, and using GCP’s security features to safeguard against potential threats. Tools like Identity and Access Management (IAM) allow organizations to set appropriate roles and permissions, ensuring that only authorized team members have access to specific resources.
Cost Efficiency and Optimization
Goognu focuses on helping businesses optimize their GCP infrastructure for performance, reliability, and cost-efficiency. Their tailored solutions ensure that businesses can scale their operations seamlessly while keeping expenses in check.
Key Features of Goognu’s GCP Managed Services
Developer Services
Goognu accelerates the software development process by providing robust developer services. This not only reduces costs but also allows businesses to achieve their goals faster.
Security and Compliance
By ensuring the security and compliance of cloud environments, Goognu frees businesses from the burden of managing these critical aspects. Their expertise helps maintain a secure and compliant infrastructure.
User Management
Goognu’s user management services help businesses configure and manage IAM to meet their unique needs. This includes setting up access controls and providing ongoing support.
Architecture Flexibility
Every business has unique requirements, and Goognu’s architecture flexibility service ensures that the cloud environment is designed and implemented to meet these specific needs. This includes customized cloud architectures that align with business goals.
Infrastructure Maintenance
Managing infrastructure can be time-consuming. Goognu takes care of infrastructure maintenance, allowing businesses to focus on their core activities. They handle tasks like monitoring, provisioning, and fixing infrastructure issues.
Increased Availability
Goognu helps businesses design and manage their infrastructure to ensure maximum availability and uptime. This includes deploying applications that can handle high traffic and remain reliable.
Scalability
Scalability is a critical feature for growing businesses. Goognu designs and implements scalable infrastructures on GCP, providing solutions tailored to evolving business needs.
Optimization
Optimizing cloud environments for performance and cost-efficiency is a hallmark of Goognu’s services. Their experts ensure that businesses get the best out of their GCP investments.
Why Businesses Trust Goognu?
Experience
With over a decade of experience, Goognu has honed its expertise in providing world-class cloud solutions. Their in-depth knowledge of GCP Managed Services makes them a reliable partner for businesses.
Round-the-Clock Support
Goognu offers 24/7 support to address any questions or concerns, ensuring that businesses have the assistance they need whenever they need it.
Proven Security Measures
Goognu’s robust security practices ensure that businesses can operate efficiently while keeping their data safe and secure.
Cost-Effective Solutions
By providing customized, cost-efficient solutions, Goognu helps businesses achieve their goals without exceeding their budgets.
How Goognu Stands Out?
Goognu’s unique approach to GCP Managed Services lies in their ability to integrate advanced tools and techniques into their solutions. For instance:
Infrastructure as Code (IaC): Using Cloud Deployment Manager with YAML or JSON configuration files to manage GCP resources.
Data Insights: Leveraging tools like BigQuery for actionable data visualization.
Advanced Automation: Implementing CI/CD pipelines for seamless application deployment.
By choosing Goognu, businesses can focus on their core competencies while leaving the complexities of cloud management to the experts.
0 notes
Text
Power BI Service | Data-Driven Visualization Analysis.
Power BI is a powerful business analytics tool developed by Microsoft that enables organizations to visualize their data and share insights across the organization. It provides a platform for transforming raw data into meaningful information through interactive dashboards and reports, facilitating informed decision-making.
Key Features of Power BI:
Integrated Data: Users can import information from numerous sources, such as Excel, SQL Server, as well as cloud services, into Power BI, thus collecting all available data into a single, cohesive data set.
Interactive Visualizations: Power BI offers various options for visualizing data, such as charts, graphs, and maps, allowing users to produce an interactive report that makes interpreting data easy and exciting.
Real-time analytics: This is a real-time data streaming capability, thus making the platform provide current information for immediate decision-making purposes.
Custom dashboards: This means that the user can make dashboards customized to suit particular business needs and provide ready access to the most important metrics and reports.
AI integration: Power BI features AI capabilities and provides users with access to capabilities like image recognition and text analytics. It further empowers the users to build machine learning models to analyze the data in an advanced manner.

Benefits of Power BI
Easy Interface: Power BI's user-friendly design, drag-and-drop functionality, and intuitive design makes it easier to use even for those who do not have the technical background to use specialized training.
Cost-Effective Solution: There are Power BI Desktop that is free, while Power BI Pro is an affordable subscription. Thus, organizations can easily opt for the one that fits the budget, and yet robust analytics capabilities will be accessed.
Scalability: Power BI addresses business needs, whether small, medium, or large enterprises. The solution can grow with the business and meet all the organizational requirements.
Better Collaboration: It enables reporting and dashboard sharing among team members, which then fosters a culture of conversation and action across the team about insights.
Upgrades: Power BI gets frequent upgrades from Microsoft. It brings about new features and improvements in it. Therefore, the users always get to utilize the most current tools to analyze data.
Applications of Power BI in Business:
Sales Analysis: Track the sales performance, trends, and forecasted sales to make the right decisions in terms of product offerings or the right strategy for marketing.
Financial Reporting: Monitor key financial metrics, analyze expenditure, and track the budget with the help of a larger financial dashboard.
Marketing Insights: Analyze the success of the campaign to understand customer behavior and optimize the campaign basis data-driven insight.
Operational Efficiency: Examine operational processes to determine areas that may need optimization, workflow improvements, and increase the efficiency of the organization.
Introduction to Power BI :
Download the Power BI Desktop : Downloading Power BI free version, is that allows report creation and use for dashboard designs and on your desktop.
Connect to Data Sources: Import data from a variety of sources, including Excel spreadsheets, databases, or cloud services, to start building your dataset.
Creating Visualization: Use visualization tools in Power BI to summarize your data graphically through chart, graph, and other ways that best highlight your insights
Building Reports and Dashboards: Organize and customize your reports and dashboards to best visualize the most significant information for meeting your business's objectives.
Share Insights: Publish your reports and dashboards to the Power BI service, making them available to your colleagues and stakeholders to view and collaborate on the insights you have generated.
Conclusion:
Power BI: The All-In-One Business Intelligence Tool Rich features and understandable interface transform raw data into actionable insights. Combining data from various sources, offering analytics in real time, and bridging the gap that allows the organization to make informed decisions, it helps it reach great success. Be it the analysis of sales performance, tracking the health of one's finance or a check on marketing strategies, Power BI equips you with the tools needed to visualize and understand your data.
If you have any specific questions or need more information on some aspects of Power BI, do not hesitate to ask!
0 notes
Text
Power BI Training | Power BI Online Training in Hyderabad
How to Use DAX in Power BI for Advanced Analytics

Power BI Training is a leading tool in the field of data analytics and visualization, providing businesses with the insights they need to make informed decisions. One of its most powerful features is Data Analysis Expressions (DAX), a formula language that allows users to create advanced calculations and models. This article explores how DAX can be used in Power BI for advanced analytics, unlocking its full potential for data professionals. Power BI Online Training in Hyderabad
Understanding DAX Basics
DAX is specifically designed for data modelling in Power BI, Excel, and SQL Server Analysis Services. It enables users to go beyond basic aggregations by crafting custom calculations. Some key features of DAX include:
Functions: DAX includes a wide range of functions for mathematical, statistical, and text operations.
Context Awareness: DAX formulas work within two contexts—row context and filter context—allowing calculations on both individual rows and filtered data sets.
Custom Calculations: Users can create calculated columns for static results or measures for dynamic, on-the-fly calculations.
These capabilities make DAX essential for building robust and interactive analytics in Power BI Training.
Essential DAX Functions for Advanced Analytics
To perform advanced analytics, it’s important to understand some key DAX functions that are widely used in Power BI projects.
CALCULATE Function
The CALCULATE function is incredibly versatile, enabling users to modify filter contexts dynamically. For instance, you can compute sales for specific time periods or conditions.
FILTER Function
FILTER allows users to narrow down data to meet certain criteria. This is particularly useful when working with subsets of data for detailed analysis.
Time Intelligence Functions
DAX provides built-in time intelligence functions like TOTALYTD (Year-to-Date totals), DATESBETWEEN (for custom date ranges), and PREVIOUSMONTH (to analyze historical trends). These functions make temporal data analysis more straightforward.
RANKX Function
RANKX is used to rank items, such as products or customers, based on specific metrics like sales or profitability. This is especially useful for comparisons and performance evaluations.
Applications of DAX in Advanced Analytics
With a solid understanding of DAX functions, professionals can tackle complex analytical tasks. Here are some practical applications: Power BI Online Training in Hyderabad
Customer Segmentation
DAX allows you to categorize customers into segments based on their purchasing behaviour. For example, customers can be classified as high-value, medium-value, or low-value based on their total spending. This segmentation provides actionable insights for targeted marketing campaigns.
Profitability Analysis
DAX helps businesses calculate profitability metrics dynamically. For instance, by dividing total profit by revenue, companies can monitor profit margins across products, regions, or time periods.
Trend Forecasting
Using rolling averages or moving totals, DAX enables businesses to identify trends and patterns in data. For instance, calculating a 30-day rolling average for sales can reveal performance fluctuations over time.
Best Practices for Using DAX
Understand Contexts
Context plays a critical role in DAX. Filter and row contexts impact how calculations are performed, so understanding these concepts is essential for accurate results.
Optimize Performance
Complex DAX formulas can slow down report performance. It’s best to use efficient functions and keep calculations as streamlined as possible.
Use Variables
Variables, defined using the VAR keyword, can improve formula readability and performance. By storing intermediate results, variables also make troubleshooting easier.
Test Formulas Step-by-Step
When building advanced analytics, test DAX formulas incrementally. This approach ensures accuracy and simplifies debugging.
Conclusion
Mastering DAX in Power BI is essential for unlocking advanced analytics capabilities. Whether it’s customer segmentation, profitability analysis, or trend forecasting, DAX empowers professionals to extract deeper insights and build more interactive dashboards. By learning and applying key DAX functions, understanding contexts, and following best practices, users can take their Power BI skills to the next level.
Start small with basic calculations and gradually progress to more complex scenarios. With consistent practice, you’ll be well on your way to mastering DAX and creating impactful analytics that drive decision-making.
Visualpath is the Leading and Best Institute for learning in Hyderabad. We provide Power BI Course Online. You will get the best course at an affordable cost.
Attend Free Demo
Call on – +91-9989971070
Blog: https://visualpathblogs.com/
What’s App: https://www.whatsapp.com/catalog/919989971070/
Visit: https://www.visualpath.in/powerbi-training.html
#Power BI Training#Power BI Online Training#Power BI Course Online#Power BI Training in Hyderabad#Power BI Training in Ameerpet#Power BI Training Institute in Hyderabad#Power BI Online Training Hyderabad#Power BI Course in Hyderabad
1 note
·
View note
Text
Acumatica Power BI Solutions: Driving Data-Driven Decision Makin
Leveraging data to make informed decisions is more crucial than ever. By integrating Acumatica with Power BI, businesses can unlock the full potential of their data, empowering them with real-time analytics, interactive dashboards, and actionable insights.
Acumatica Power BI Solutions bridge the gap between raw data and strategic decision-making, ensuring that organizations stay ahead of the curve.
Streamlining Insights with Acumatica and Power BI
Acumatica, a robust cloud-based ERP system, manages core business processes seamlessly. When paired with Microsoft Power BI, this integration takes analytics to the next level. With features like interactive dashboards, real-time monitoring, and customizable reports, businesses gain a comprehensive view of their operations.
From tracking inventory and financial performance to monitoring production efficiency, the synergy of Acumatica and Power BI ensures actionable insights are always at hand.
Key Benefits of Acumatica Power BI Solutions
1. Real-Time Analytics: Stay informed with up-to-the-second updates through Power BI’s real-time monitoring, allowing for swift responses to dynamic business environments.
2. Enhanced Visualization: Transform raw data into visually compelling reports and dashboards that simplify complex information for better understanding.
3. Seamless Integration: Power BI integrates effortlessly with Acumatica, connecting to multiple data sources, including Excel, SQL Server, and Azure.
4. Improved Collaboration: Share secure and insightful dashboards across teams to ensure alignment and foster collaborative decision-making.
5. Cost Efficiency: Automate reporting processes and reduce dependency on IT teams, making it a cost-effective solution for businesses of all sizes.
Driving Smarter Decisions with Acumatica Dashboards
With Power BI, Acumatica Dashboards have become more than just data visualization tools. They transform into strategic assets, providing insights into operational bottlenecks, market trends, and customer behaviors. Businesses can leverage these insights to optimize operations, improve customer satisfaction, and drive profitability.
Conclusion
Integrating Acumatica with Power BI is not just about accessing data—it’s about transforming it into a strategic resource for decision-making. By adopting Acumatica Power BI Solutions, businesses can stay agile, data-driven, and poised for growth in an ever-changing market. Ready to revolutionize your data analytics? Connect with Power BI Solutions today and discover how real-time insights can drive your success.
#power bi solutions#dashboard#power bi integration#power bi consulting services#power bi reporting#power bi service
0 notes
Text
0 notes
Text
Balancing Frontend and Backend: Mastering the Full Stack with .NET
In the world of software development, full stack developers must skillfully manage both the frontend (user interface) and backend (server-side logic) to deliver seamless applications. The Full Stack .NET program equips developers with the tools and techniques necessary to excel in both domains, offering a comprehensive approach to building robust web and software solutions.
Frontend Development with .NET
The frontend is where user interaction happens, involving HTML, CSS, and JavaScript frameworks like Angular or React. With .NET technologies, developers can create interactive and responsive interfaces using Blazor, a framework that allows building web apps with C# rather than JavaScript. This ensures consistency and efficiency, especially for developers familiar with .NET.
Backend Development with .NET
The backend deals with business logic, databases, and application performance. ASP.NET Core plays a pivotal role in backend development, providing a powerful environment for building APIs and web services. This framework supports scalability, enabling smooth data handling and secure communication between the client-side interface and the server.
Mastering the Full Stack
To become a proficient full stack developer, it is essential to master both frontend aesthetics and backend logic. Here’s how .NET helps:
Code Reusability: C# can be used across the frontend (Blazor) and backend (ASP.NET Core), reducing the need to learn multiple programming languages.
Security: .NET offers built-in security features to manage user authentication, ensuring data safety on both ends.
Integration: Developers can seamlessly integrate databases like SQL Server and MongoDB with backend services.
Performance Optimization: Full stack developers must ensure that both ends work harmoniously to prevent bottlenecks, and .NET provides tools for monitoring performance.
Why Balance is Important?
An imbalance between frontend and backend can lead to poor user experiences or inefficient data handling. A well-rounded full stack developer ensures that the UI functions smoothly, backed by a powerful backend system that manages logic and data efficiently.
Mastering the Full Stack .NET program equips developers with the versatility needed to build modern, scalable web applications. Whether you’re looking to work for a company or become a freelancer, this program ensures you’re prepared for both ends of development.
Enroll today to develop the technical skills required to excel in full stack development and stand out in a competitive job market!
0 notes