#ShowMeTheData
Explore tagged Tumblr posts
Visit Tumblr Blog
Explore Tumblr blogs with no restrictions, modern design and the best experience.
Last Seen Tumblr Blogs


Fun Fact
Hackers stole 65M passwords from Tumblr in 2013.
Text
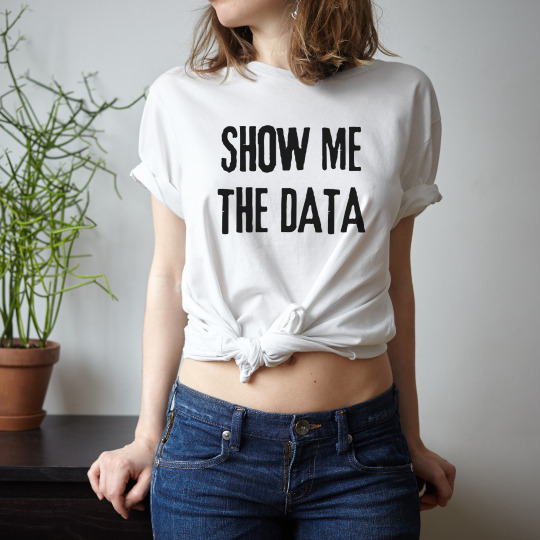
Introducing our "Show Me the Data" shirt, a must-have for analysts, engineers, science geeks, and data enthusiasts! This tee celebrates the power of big data and is the perfect gift for statisticians, programmers, and database nerds. Embrace your love for data-driven insights and wear it proudly as a stylish statement of your passion!
#ShowMeTheData#BigData#DataAnalyst#Engineer#ScienceGeek#Statistics#Programmer#DatabaseNerd#TShirt#DataDriven#GiftIdeas
0 notes
Photo

One...more...week... #boardexam #showmethedata #moneygrab #wasteoftime #gottodoit
0 notes
Text
Coding. #showmethedata
“How do doctoral students experience the period of their lives when they are in graduate school?” was the intitial interview question. From there each cohort member developed their own questions to access data from other cohort members to help answer that question.
Reviewing the one transcript in which I was involved in the interview process was a completely different experience than reviewing the transcripts of 8 other interviews. While each interview had a common originating question, experiences reflected different data. I began to sort through the data of the interview I had initially transcribed. I used a variety of highlighters to identify themes that ran through the initial interview: support systems, expectations, changes in expectations, reasonings for getting this degree, family responsilities, career responsibilities, relationships, stress levels, time management and satisfaction. Because of my familiarity with the interview I conducted, I knew some of the themes which existed. Rereading the interview for confirmation and for data was different than reading it as a conversation which occurred between two people. It was an interesting perspective in which the personal relationship was removed and only a search for themes was the purpose of the reread. Having this perspective on the interview I conducted, I decided to read each interview once just for the purpose of conversational perspective and how each of my cohort members responded to the initial research question and questions they developed for the purpose of gathering data. I gained new insight from pending life changes to personal struggles and celebrations various members are going through. This was a seperate category of information which was shared but did not elicit themes related to the research question.
Next, using the interview I conducted, I reread other’s interviews and searched for common themes, coordinating the highlighted sections to correspond between interviews. Some of these themes overlapped but had slight variations earning them their own highlighted section, i.e. family could come under support or perceived stress that participation in the program placed on family members. Realizing because I did not have access behind the emotional framework in which the questions were answered, I could only guess at the ranking of significance each answer played in the life of the interviewee. The answers were only words on a page with no context from which vital information can be gained.
In the end, my rainbow of pages reflected some common life responses doctoral students were experiencing during the period of their lives when they were in the graduate program. While those themes are able to be identified, manipulating the data as far as ranking greatest impact or changes in approaches to career would be impossible to do because data came from various sources without the needed references to fully utilize it any more than a collection of information. This exercise has helped emphesize for me the importance of really analyzing the structure of data collection, outlining specific boundaries and the difficulties in using data collected by others without full reference information made during the interview.
0 notes
Link
Some of the Popular Images and Themes the Russians Posted on Social Media #Subterfuge #FakeNews #ShowMeTheData
0 notes