#Unit10
Explore tagged Tumblr posts
Visit Tumblr Blog
Explore Tumblr blogs with no restrictions, modern design and the best experience.
Last Seen Tumblr Blogs


Fun Fact
Tumblr was the first site to host the blog for President Barack Obama in 2011.
Text

Overcome the Fear of Deadline with our Unit 10 Biological molecules and metabolic pathways Assignment Help and Solution Service!! Hire native tutor for Diploma Assessments!! Order Instant Solution on WhatsApp: +44 141 628 6080!!
#Unit10 #Biologicalmolecules #metabolicpathways #AssignmentHelp #Solution #Pearson #BTEC #Level3 #Foundation #Diploma #AppliedScience #Certificate #StrategicManagement #AssessmentHelp #OnlineTutor #AskTutor #HND #UK #UKtopwritingservice
0 notes
Link
IPI Center Done Rockwell LINCOLN TOWER #IPICENTERDONEROCKWELL #HIGHENDCONDO
0 notes
Link
IPI Center by Rockwell LINCOLN TOWER #IPICENTERBUYROCKWELL #PRESELLINGHIGHENDCONDO #LINCOLNTOWER INQUIRY: 09177925457
0 notes
Text
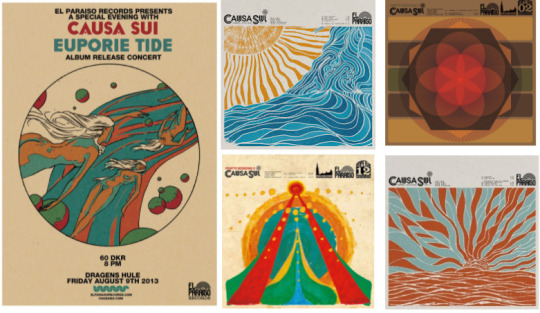
unit 10 // imagecraft - reference
recently came across a psychedelic rock band called Causa Sui; not only do they have great music but their album covers and posters are extremely vibrant and unique. they really stand out and capture the essence of their music. I do like the way they've placed all the necessary text on the album cover and will take this layout in consideration when laying out my album cover.
1 note
·
View note
Text
ES DEVLIN / TED TALK
Es Devlin talks about the poetic aspect of design and her being a stage sculpture, but in fact she actually sculpts the experience for the audience. She’s always seeking to create the most articulate sculpture and “we're always seeking to create the most articulate sculpture, the most poetic instrument of communication to an audience. When I say poetic, I just mean language at its most condensed, like a song lyric, a poetic puzzle to be unlocked and unpacked.”
She said something that really resonated with me: that she is creating illusions, making things that are false but trying to make it look real. She asks herself if “can we communicate truth using things that are false?”


Video can be found at
https://www.ted.com/talks/es_devlin_mind_blowing_stage_sculptures_that_fuse_music_and_technology?language=en
2 notes
·
View notes
Text
Data Visualisation - Research
When thinking of ways data is shown, visually it is thought of as having a clinical and comprehensive approach. As its main function is to understand the information being relayed without space for miscommunication for anytime, therefore as a result when looking at this data in relation to an article or document, I have not often come to the conclusion that a creative design has had a place in designing it, rather that it is placed tin the publications expected, regular layout. It calls to the immediate question of whether a designed diagram would unnecessary complicate the matter? Of whether there is a way to creatively show an image relaying information which can be understood at just a glass whilst also not distracting from the attached comparative text?
Although an image may be visually appealing, I need the focus of my work within this project, as well as my research, to be focused on its function and whether the diagrams show everything needed with complete ease. An initial question I would like my research to hold concerns both shape and colour based graphs. Is a key always necessary and if it is should it be? Would such a graph without one still be able to effectively communicate without one, is that even possible?
Main areas to consider when looking at information design:
• Location
• Alphabet
• Time
• Category
• Hierarchy
Different symbols and colours can allow multiple areas listed to be explored through one graph, but also multiple matters within one of these segments.
For example this graph designed for newspaper readers, about how gay rights vary by American state and how the trends of religion effect these rights, has used colour, placement and shade to explain. It is needed to bare in mind that the average newspaper reader will be expected to be using the publication in a busier surrounding (train, office etc.) or in the home with other distractions (other occupants of the house, television, radio etc.). With this known the information displayed through this diagram would have to be easily understood, without to much added reading.

Category - State
Category - Religion
Category - Gay rights
Category - Region
Hierarchy - How it varies

This second graph looks closer at the environment, focusing on how air quality in Sheffield changed over a three day period. These is a physical object, and consequently would be seen by most viewers in a photographic two-dimensional way. However the three-dimensional element of this piece of work, makes the differences between the varying results unmistakable. No exact numbers may be understood but, the night of bomb-fire night, shown through the large red and spiked shape (standing apart from the regular curved blue/green hued components) makes it noticeable to the viewer that a dramatic shift occurred within the pollution in the air. the use of the colour red, often also brings up the concept of danger, after years of it being used in this context it helps alarm the viewer to this drastic shift but also that its something in need of immediate change. Colour used to symbolise elements in this way is something I would like to explore further in this projects.
1 note
·
View note
Text
Unit 10, Post 1
The best way to stop seeing clickbait is to not click on it. Algorithms show you things like what you've demonstrated interest in (ie, clicked on).
#UW-Madison#SummerClasses#PSY532#TermProject#College#ProfessorGernsbacher#Psychology#PsychologyOfTheInternet#School#PSY 532: Psychology of the Internet#Decision making on the internet#Unit10#Unit10Post1
0 notes


Photo


Here are some of the digital developments I created today, using the images of our paper modelling samples.
3 notes
·
View notes
Link
IPI Center Done Rockwell LINCOLN TOWER
0 notes
Link
IPI Center by Rockwell LINCOLN TOWER #IPICENTERBYROCKWELL #LINCOLNTOWER #HIGHENDCONDO #PRESELLINGHIGHENDCONDO 09235536903
0 notes
Text
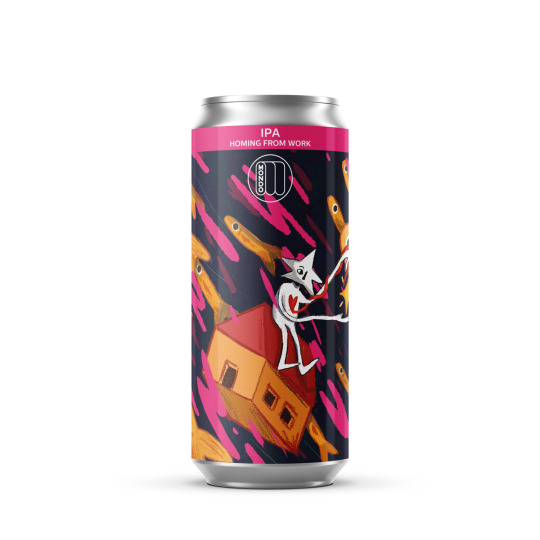
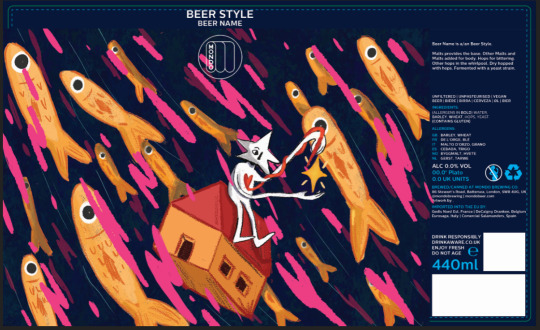

unit 10 // external project
the final version of the piece, with and without the provided template. I am actually quite happy with this result! The colours and composition are really vibrant and funky! it wasn't the chosen design but I am proud of the result in any case.
0 notes
Text
DATA COLLECTION / CONNECTED TO MUSIC

[Picture above shows my notes for when I pressed play and stop on the app]
For my data collection I have decided to track data on how often I during these 6 days listen to Spotify. I initially decided to collect in on music as I know it it something I do most days and therefor would provide me with accurate data. Not trying to collect something that I know I won’t do, or something that would feel forced into these six days of collecting it.
I knew I couldn’t just collect data on how often I listen to music without giving it any constraints. That’s why I decided to keep select the process of listening to Spotify as it is an app that I have on both my phone and laptop, making it easy to keep track of time when I press play and stop. I then decided to select only when I’m listening to it on my phone. The results showed that I am active on Spotify on my phone when going to and from places. The timings are accurate when I travelled that week, mainly to and from University.
1 note
·
View note
Text
Unheard Voices - Option Two - Creating Feelings and Emotions Research


I was lucky enough to be able to attend Jodee Mundy Collaboration ‘Imagine Touch’ at the Barbican this week awn can testify that it was an experience like no other! Your site and hearing was largely taken away as you walked around the space, were directed by people physically who worked there and interacted with the others taking part - it gave such insight into the importance of the senses but also the power to touch a sense largely overlooked until its isn't there. Could it possibly be


Maybe next -

0 notes
Text
Unit 10, Post 2
Hu, Koh, & Reddy (2013) conducted research to see how reviews impact product sales. They wanted to see how positive or negative reviews affected whether a product sold. They studied this because there is an assumption that reviews can be read and assessed to figure out how the person would rate the product and the researchers weren't sure if this was true.
Hu, Koh, and Reddy found that ratings get people to click on a product, but it's reviews that actually get people to buy it. This makes sense to me because when I'm online shopping, I often filter or sort by rating. However, a five-star rating might not get me to purchase that specific product.
#UW-Madison#SummerClasses#PSY532#TermProject#College#ProfessorGernsbacher#Psychology#PsychologyOfTheInternet#School#PSY 532: Psychology of the Internet#Decision making on the internet#Unit10#Unit10Post2
0 notes
Photo

IDEATION
My group decided to first take three days to do independent idea dump brainstorming sessions. We then agreed to come together via zoom each with our three favored solutions and narrow in on our overall top three.
I didn’t feel I knew enough about our user group thus I decided to first do a bit more research to hopefully produce more substantive solutions. I watched a few interviews of persons from the visually impaired community describing their travel experiences and took a short train ride to see if I could further empathize with the other user categories as well. I then briefed myself on the history of the ADA and reviewed our original morphological grid line by line to further understand our user group. I began writing out my various solutions in sharpie on a spare piece of cardboard so I would have a bold visual of all my text. Hitting various mental blocks on ways to incorporate all differently abled communities, I decided to create another morphological analysis pulling from our problem statement. I placed our three inconsistencies on one axis and our pain points on the other. I had a hard time filling in the grid and referred to our original morphological analysis and research documents often.
The three ideas I ended up presenting to my group were a sort of patchwork from my idea boards. All three require the user to provide information about their impairment and service preferences ahead of time. In order of preference my solutions were as follows, Google Live View adaptation, a Real ID incorporation, and a personalized notification system.
When we came together each member pitched their three favored ideas to the group. We had several obvious overlaps including some sort of crowd sourced review process and a type of ID/Passport or identifying element. We merged each of our similar ideas in those categories creating our first two solutions. We then decided to add in one of the big sky or off the beaten path ideas centered around AR/VR for balance. We did a team check in to make sure everyone felt okay about where we ended up and closed the session. I felt our system of individually diverging/converging prior to doing so as a group streamlined our brainstorming session.
2 notes
·
View notes