#asalamis
Text


“ MY GF’S FAMOUS ” — tokyo revenger headcanons ( x fem )
where tokyorev boys s/o is a kpop idol,, female reader,, draken, mikey, baji, mitsuya, chifuyu ,, modern au
— IVE BEEN WANTING TO DO THIS FOR SO LONG, just thinking abt it always had me thinking of ideas to how they would all have their kpop idol s/o im so glad to finally be writing this <3
warnings;; none I think (hopefully..) most likely bad spelling and a lot of grammar mistakes (not proofread bc it’s late and I’m too sleepy,, hopefully everything is right tho..)

ryuguji ken “draken”
surprisingly he actually knows a thing or two about kpop and idols. Was surprised to see you pop up on tv when he stayed over with Mikey because Emma actually likes ur group. “Woah Ken-chin!! isn’t that [name]??” Draken seriously had to double check to see if it was actually you.
When you actually told him you were a kpop idol he kissed your forehead and said “I know” so proudly. Believe it or not he brags about it to his friends “my girlfriend is a kpop idol, you should stream their music!!”
ALSO he once dragged you along to a party (mitsuyas bday party) and everyone was there, when I tell you hakkai froze and almost fainted at the sight of you. #3 biggest and supporter right there (according to draken) you had to kind of step out for a second with draken before hakkai had a heart attack.
still he was so happy to meet you (his bias btw..) many congratulations and nice to meet you’s from him.
at some point paparazzi actually noticed you with him out on a date (thankfully they didn’t get to snap any pictures) draken dragged you out of the park as fast as he could covering you with his hoodie. he protects you from paparazzi you can’t tell me otherwise <3
BONUS: whenever he hears your songs pop up on the radio (no matter where he is) he turns it all the way up. If anyone is around him he recommends your unit to them. “They’re really good specially [name]!!” (Of course he also looks up to your group members he just likes to brag about you a lot <33)
sano manjiro “mikey”
Once again,, surprisingly knows what kpop is all because of his sister. (I’m telling you Emma is a kpop Stan u can’t tell me otherwise) when he actually gets into your music he’s hooked
He would steal Emma’s photocard collection of you or pretty much anything with your face or name on it. Wouldn’t even feel guilty abt it, not one bit “she’s my gf I think that’s enough explanation!!” “WELL I BOUGHT IT SO ITS MINE” yeah they would both argue until you actually gave Emma new signed merch
MOVIE NIGHTS WITH HIM AND HIS SISTER and many Shinichiro.. you can’t tell me otherwise. You guys would have pop corn and snacks before watching the movie all while having your groups music playing on the background (supportive bf I love him <;3)
He hates paparazzi sm, I feel like he would be really jealous of other people taking pictures of you specially when you’re just trying to have a nice time at some cafe. Anytime paparazzi came to bash you and take pictures with you he would cling onto you and cover you from their view. “Only I should be able to take pictures of you” with a pouty face
You would take him to meet your group members and he would ask for autographs from each of them (to brag to Emma ofc). The dude doesn’t even know their names.. it’s okay tho because he’s now best friends with them!!
He actually stayed on set once you guys were filming an mv for your recently released song. Your group tried to get him to try and learn the dance (he actually made it to the behind the scenes videos which was him dancing with your group)
he reads those [name] x reader fan fictions, hee proud of it actually. Others can keep imagining while he can actually have the real thing, im almost sure he would actually have a fan account just for you.
he 100% goes to your concerts with Emma, you actually reserve him and his sister seats. Most of the time you’re always looking at him when you’re performing. if you send him kisses or winks while you’re dancing he’ll immediately go insane.
he gets backstage privileges. yes he does indeed get that privilege. always congratulated you and your group mates for your amazing performance. is extremely clingy after you guys leave for the hotel you booked. he ends up staying with you because he’s too lazy to drive back to his own house.
BONUS: CUDDLES, the best cuddles you’ve ever received in your life, specially after an exhausting performance. he takes care of you <33 “you did great today”
baji keisuke
he has some idea what kpop or idols are.. the moment you told him he just said “cool” Chifuyu would be the one to explain it to him. Afterwards he would be happy to listen to your songs and even buy your albums
100% convinced his mother would listen to you, idc idc fight me she would. His mother loves you i know she does, the moment you visited baji to meet his mother she cried tears of joy. give this woman free merch SIGNED, dude you would go as far as to take her to your group members so she could meet them all sobs.
once you were tired like really tired since you were coming from endless hours of practice so all you wanted was to spend time with your bf.. you knocked on the door and when he let you in all of his friends were there playing a board game
chifuyu who had begged baji to let him meet you immediately greeted you, bro was fascinated, astonished, flabbergasted to finally see you in flesh and bone. that day you stayed over and played games with them by the end of it you fell asleep. baji tucked you into his bed and afterwards fell asleep hugging you.
HE LOATHES ABSOLUTELY HATES PAPARAZZI. he almost punched one of them once because you were caught completely off guard as they took pictures of you with the flash on. “Piss off cant you see we’re busy??” Most of your fans actually think he’s rude but he’s a sweet guy who just wants to protect his gf <;3
No but fr he would go as far as to break some cameras just so you could have some relaxing time without having to worry about paparazzi. although many attempts have failed because there is abt 100 pictures of you and baji online having dates and picnics.. let’s just say he’s pretty pissed off abt it
baji would 100% teach you how to protect yourself from weird people, pervs and all that stuff. “There’s weird people out there so you need to know how to at least land a punch” you actually ended up sending some perv to the hospital for kicking him where it hurts. baji was proud yet disgusted at how the man even tried to make a move.
BONUS: yk how cats often come into his room, you always take care of them with baji when you stay over. it’s as if the cats were your children and you and baji were their parents.
mitsuya takashi
mitsuya actually listened to your songs even before you started dating. he was quite lucky (as he claims) to have met you that rainy day that you had forgotten your umbrella and he had offered his. “excuse me? here you can use my umbrella if you want” he was so sweet about it “ah, thank you so much I can’t afford my papers getting wet, will you be fine?”
you were surprised he didn’t bash you with questions and asking for an autograph so you guessed he didn’t know who you were. you ended up giving him your personal number so you could return his umbrella. he was shocked when he found out who you actually were,, the rest is pretty much history
his sisters love you, you always make sure to bring them some type of gift before visiting. mitsuya actually tries to get you to not buy them anything because he thinks it’s a lot but cmon now mana and luna deserve love. they wanted your groups albums for Christmas and they got that and more, you got all your group members to record some type of video and greeting they thanked you profusely afterwards
he’s a designer and you are an idol.. guess what that means. HE MAKES YOUR OUTFITS,, he totally does I know it. anytime your group and you come up with a theme for your mvs Mitsuya always offers to make your outfits. you always proudly wear all of his creations,, like for an interview?? red carpet?? music video?? or just an outfit overall Mitsuya is your guy.
paparazzi would be asking you who the designer is and all you have to say is “This is a piece made by my boyfriend, Mitsuya Takashi.. thank you for asking” he gained a few hundred of followers that day.
dates a lot of dates with him whenever you have free time, even tho paparazzi may sometimes ruin it’s okay because there’s a few 20 new pictures of both of you online showing the world how in love u are.
BONUS: movie nights with him and his sisters, it’s pretty much basically just you and Mitsuya since mana and luna always fall asleep on the first 10 minutes of the movie. anyway it’s more time for you and Mitsuya so win win??
matsuno chifuyu
now this little silly he has a whole shelf full of your groups albums, magazines and posters. he listens, streams, quite literally enjoys your music (he stans new jeans and wonder girls you can’t tell me otherwise)
your relationship is pretty much public, all of your fans know who he is. I believe they follow peke j’s Instagram account, (it’s what they love most abt your bf) like his cats account has more followers than his own main acc😭
every time you stay at chifuyu house you always make sure to bring some type of treat for peke j, he absolutely adores you. cuddle peke j and leave chifuyu outside his own bed quite literally
LIBRARY DATES,, you both go to the library to check out/buy manga and other books you may like. you guys have those cute little cafe dates where you guys either spend your time reading or just talking about your day and life
he watches your interviews, AND he was once invited to go into one. like a couple interviews or yk those interviews where couples get cards with questions that only they know abt each other. or just cute games for couples,, yeah those basically. fan base went crazy after that interview dropped
you planned on adopting a cat once so chifuyu recommended some adoption centers. sadly you didn’t end up adopting a cat but you did get a date at a cat cafe so a loss and a win?? “look at this cat!! her name is bee she’s so cute” so many cats surrounded him it was cute <33
he’s neutral abt paparazzi tbh, he just dislikes it when you feel uncomfortable being bashed by so many people at the same time. sadly he can’t do much about them,, but when you’re both out of their sight he treats you to whatever you want a lot of comfort from his part
BONUS: since you’re friends with a lot of other kpop idols you invited chifuyu once to meet some of them. he got to meet a lot of his biases and got a shit ton of autographs and merch,, afterwards he thanked you endlessly,, lots of kisses <33
©asalamis ,, please don’t copy, steal or plagiarize my work in any way, reblogs and likes are appreciated,, hope you enjoyed ty for reading <;3
#miomik#asalamis#tokyo revengers#tokyo rev headcanons#tokyo rev x reader#draken x reader#mikey x reader#baji x reader#mitsuya x reader#chifuyu x reader#x female reader#tokyorev x reader
881 notes
·
View notes
Text
Boy at the papa John's just told me "asalami and bacon allahuakbar" and I can't stop laughing.
0 notes
Link
Everyone loves to enjoy a slice of delicious pizza with their friends and family & ASalamy as a topping on your pizza gives a meaty, salty and smoky flavor to your taste buds.
0 notes
Text
FelCor First Quarter 2017 Hotel Revenues Decline
FelCor Lodging Trust Incorporated (NYSE: FCH) today reported results for the first quarter ended March 31, 2017. First Quarter Highlights * Same-store RevPAR was $142.15 compared to $143.97 for the same period in 2016. * Net loss attributable to FelCor common stockholders was $42.2 million ($0.31 per share) versus $11.2 million ($0.08 per share) for the same period in 2016. * Adjusted FFO per share was $0.09 versus $0.14 for the same period in 2016. * Same-store Adjusted EBITDA was $40.1 million versus $43.1 million for the same period in 2016. “Since our last earnings release, we have continued on our path to recognize and realize the value of our portfolio for all our stockholders,” said Steven R. Goldman, FelCor’s Chief Executive Officer. “Adjusted FFO per share and Adjusted EBITDA for the quarter were in line with our expectations and speak to the quality of our portfolio and its ability to withstand some challenging market conditions.” “Following the end of the quarter, in addition to the recent merger announcement with RLJ, we finalized agreements to sell Morgans and Royalton in New York City,” continued Mr. Goldman. “For the remainder of the year, we remain focused on operating the business and working to complete our merger with RLJ.” First Quarter Hotel Results First Quarter 2017 2016 Change Same-store hotels (38) RevPAR $ 142.15 $ 143.97 (1.3 )% Total hotel revenue, in millions $ 187.4 $ 190.4 (1.6 )% Hotel EBITDA, in millions $ 45.2 $ 48.1 (6.1 )% Hotel EBITDA margin 24.1 % 25.3 % (116) bps RevPAR for our 38 same-store hotels decreased 1.3% (to $142.15) from the same period in 2016. The change reflects reductions of 0.1% in average daily rate, or ADR, (to $189.63) and 1.2% in occupancy (to 75.0%). Hotel EBITDA for our 38 same-store hotels decreased 6.1% to $45.2 million, and Hotel EBITDA margin was 24.1%, a 116 basis point decrease. Our RevPAR performance during the quarter was particularly impacted by certain underperforming markets, mainly New York, Boston, San Francisco and Miami. We were able to offset much of the RevPAR weakness through effective cost controls and the Wyndham guaranty. Wyndham Worldwide Corporation has guaranteed minimum annual NOI for eight of our hotels over the 10-year term of their management agreements. Hotel EBITDA for the three months ended March 31, 2017 includes $1.0 million in fee reductions related to the Wyndham guaranty compared to $48,000 during the same period last year. First Quarter Operating Results First Quarter $ in millions, except for per share information 2017 2016 Change Net loss attributable to FelCor common stockholders $ (42.2 ) $ (11.2 ) (276.7 )% Net loss per share $ (0.31 ) $ (0.08 ) $ (0.23 ) Same-store Adjusted EBITDA $ 40.1 $ 43.1 (7.0 )% Adjusted EBITDA $ 40.2 $ 49.0 (17.9 )% Adjusted FFO per share $ 0.09 $ 0.14 $ (0.05 ) Net loss attributable to common stockholders was $42.2 million ($0.31 per share) in 2017, compared to $11.2 million ($0.08 per share) for the same period in 2016. Net loss in 2017 includes an impairment charge of $24.8 million attributable to one hotel. EBITDA, Adjusted EBITDA, Same-store Adjusted EBITDA, Hotel EBITDA, Hotel EBITDA margin, FFO, Adjusted FFO and Adjusted FFO per share are all non-GAAP financial measures. See our discussion of “Non-GAAP Financial Measures” beginning on page 14 for a reconciliation of each of these measures to the most comparable GAAP financial measure and for information regarding the use, limitations and importance of these non-GAAP financial measures. Balance Sheet As of March 31, 2017, we had $1.4 billion of consolidated debt with a 5.4% weighted-average interest rate and a six-year weighted-average maturity. We had $50.2 million of cash and cash equivalents on hand and $22.3 million of restricted cash. Asset Sales In April and May 2017, we entered into binding agreements for the sale of Morgans and Royalton for a combined price of $92 million. We continue to market The Knickerbocker. Common Dividend We paid our first quarter common stock dividend of $0.06 per share at the end of April. Capital Expenditures In 2016, we began redeveloping two resort properties (The Vinoy Renaissance St. Petersburg Resort & Golf Club and Embassy Suites Myrtle Beach-Oceanfront Resort). We expect to complete our Myrtle Beach project this month, as scheduled and under budget. These redevelopments are intended to enhance our portfolio quality and offer attractive returns. We spent $19.6 million on renovations and redevelopments at our hotels during the first quarter of 2017. Outlook In the first quarter of 2017, our Adjusted FFO per share and Adjusted EBITDA met the expectations on which we based our full-year guidance. We are reaffirming the guidance we provided in our February 23, 2017 earnings release. We do not plan to provide any further updates to our guidance for the remainder of the year, given our pending merger. RLJ Transaction On April 24, 2017, we announced that we had entered into a definitive merger agreement under which we will merge with and into a wholly-owned subsidiary of RLJ in an all-stock transaction. At closing, our stockholders are expected to receive 0.362 RLJ common shares for each share of our common stock. The transaction is expected to close by the end of 2017 and is subject to customary closing conditions, including the approval of both companies’ shareholders. “We believe our recently-announced merger with RLJ will create long-term value for FelCor stockholders,” said Mr. Goldman. “The combined company’s growth profile will make it a formidable competitor among lodging REITs. It will have approximately $7 billion in assets, strong and efficient cash flow margins, and the financial strength and long-term flexibility to grow through accretive acquisitions and continually prune its portfolio to improve the quality of its earnings.” Mr. Goldman continued, “The RLJ team is committed, experienced, and a proven leader in the lodging industry. I am very pleased for our stockholders - and for RLJ’s shareholders, as this transaction provides meaningful value for all.” About FelCor FelCor Lodging Trust Incorporated, a real estate investment trust, owns a diversified portfolio of primarily upper-upscale and luxury hotels that are located in major markets and resort locations throughout the U.S. FelCor partners with top hotel companies that operate its properties under globally renowned names and as premier independent hotels. Important Information for Investors and Stockholders In connection with the proposed merger, RLJ expects to file with the SEC a registration statement on Form S-4 that will include a joint proxy statement of RLJ and FelCor that also constitutes a prospectus of RLJ, which joint proxy statement/prospectus will be mailed or otherwise disseminated to RLJ shareholders and FelCor stockholders when it becomes available. RLJ and FelCor also plan to file other relevant documents with the SEC regarding the proposed transaction. INVESTORS ARE URGED TO READ THE JOINT PROXY STATEMENT/PROSPECTUS AND OTHER RELEVANT DOCUMENTS FILED WITH THE SEC IF AND WHEN THEY BECOME AVAILABLE BECAUSE THEY WILL CONTAIN IMPORTANT INFORMATION. You may obtain a free copy of the joint proxy statement/prospectus and other relevant documents (if and when they become available) filed by RLJ and FelCor with the SEC at the SEC’s website at www.sec.gov. Copies of the documents filed by RLJ with the SEC will be available free of charge on RLJ’s website at www.rljlodgingtrust.com or by emailing RLJ Investor Relations at [email protected] or calling 301-280-7774. Copies of the documents filed by FelCor with the SEC will be available free of charge on FelCor’s website at www.felcor.com or by contacting FelCor Investor Relations at [email protected] or calling 972-444-4967. This document shall not constitute an offer to sell or the solicitation of an offer to buy any securities, nor shall there be any sale of securities in any jurisdiction in which such offer, solicitation or sale would be unlawful prior to registration or qualification under the securities laws of any such jurisdiction. No offering of securities shall be made except by means of a prospectus meeting the requirements of Section 10 of the U.S. Securities Act of 1933, as amended. Participants in the Solicitation RLJ and FelCor and their respective trustees, directors and executive officers and other members of management and employees may be deemed to be participants in the solicitation of proxies in respect of the proposed merger. You can find information about RLJ’s executive officers and trustees in RLJ’s definitive proxy statement filed with the SEC on March 28, 2017 in connection with its 2017 annual meeting of shareholders and in Form 4s of RLJ’s trustees and executive officers filed with the SEC. You can find information about FelCor’s executive officers and directors in FelCor’s Form 10-K/A filed with the SEC on April 28, 2017. Additional information regarding the interests of such potential participants will be included in the joint proxy statement/prospectus and other relevant documents filed with the SEC if and when they become available. You may obtain free copies of these documents from RLJ or FelCor using the sources indicated above. SUPPLEMENTAL INFORMATION INTRODUCTION The following information is presented in order to help our investors understand FelCor’s financial position as of and for the three months ended March 31, 2017. TABLE OF CONTENTS Page Consolidated Statements of Operations(a) 8 Consolidated Balance Sheets(a) 9 Consolidated Debt Summary 10 Schedule of Encumbered Hotels 11 Capital Expenditures 11 Total Enterprise Value 12 Hotel Operating Statistics 13 Historical Quarterly Operating Statistics 14 Non-GAAP Financial Measures 14 Consolidated Statements of Operations (in thousands, except per share data) Three Months Ended March 31, 2017 2016 Revenues: Hotel operating revenue: Room $ 144,933 $ 159,076 Food and beverage 32,074 39,532 Other operating departments 10,689 10,849 Other revenue 408 687 Total revenues 188,104 210,144 Expenses: Hotel departmental expenses: Room 40,678 42,699 Food and beverage 26,222 30,956 Other operating departments 3,533 3,783 Other property-related costs 50,855 55,566 Management and franchise fees 7,550 9,225 Taxes, insurance and lease expense 13,902 13,582 Corporate expenses 6,940 8,400 Depreciation and amortization 27,838 29,183 Impairment 24,838 — Other expenses 1,260 828 Total operating expenses 203,616 194,222 Operating income (loss) (15,512 ) 15,922 Interest expense, net (19,286 ) (19,720 ) Loss before equity in loss from unconsolidated entities (34,798 ) (3,798 ) Equity in loss from unconsolidated entities (130 ) (154 ) Loss from continuing operations before income tax (34,928 ) (3,952 ) Income tax (547 ) (415 ) Loss from continuing operations before loss on sale of hotels (35,475 ) (4,367 ) Loss on sale of hotels (666 ) (714 ) Net loss and comprehensive loss (36,141 ) (5,081 ) Net loss attributable to noncontrolling interests in other partnerships 404 471 Net loss attributable to redeemable noncontrolling interests in FelCor LP 186 48 Preferred distributions - consolidated joint venture (360 ) (360 ) Net loss and comprehensive loss attributable to FelCor (35,911 ) (4,922 ) Preferred dividends (6,279 ) (6,279 ) Net loss attributable to FelCor common stockholders $ (42,190 ) $ (11,201 ) Basic and diluted per common share data: Net loss $ (0.31 ) $ (0.08 ) Basic and diluted weighted average common shares outstanding 137,778 139,678 Consolidated Balance Sheets (in thousands, except par values) March 31, December 31, 2017 2016 Assets Investment in hotels, net of accumulated depreciation of $945,449 and $932,886 at March 31, 2017 and December 31, 2016, respectively $ 1,535,718 $ 1,566,823 Investment in unconsolidated entities 7,532 8,312 Cash and cash equivalents 50,235 47,317 Restricted cash 22,319 19,491 Accounts receivable, net of allowance for doubtful accounts of $148 and $177 at March 31, 2017 and December 31, 2016, respectively 40,976 42,080 Deferred expenses, net of accumulated amortization of $3,427 and $2,959 at March 31, 2017 and December 31, 2016, respectively 4,059 4,527 Other assets 19,326 18,542 Total assets $ 1,680,165 $ 1,707,092 Liabilities and Equity Debt, net of unamortized debt issuance costs of $15,389 and $15,967 at March 31, 2017 and December 31, 2016, respectively $ 1,354,187 $ 1,338,326 Distributions payable 14,853 14,858 Accrued expenses and other liabilities 123,505 116,437 Total liabilities 1,492,545 1,469,621 Commitments and contingencies Redeemable noncontrolling interests in FelCor LP, 610 units issued and outstanding at March 31, 2017 and December 31, 2016 4,583 4,888 Equity: Preferred stock, $0.01 par value, 20,000 shares authorized: Series A Cumulative Convertible Preferred Stock, 12,879 shares, liquidation value of $321,987, issued and outstanding at March 31, 2017 and December 31, 2016 309,337 309,337 Common stock, $0.01 par value, 200,000 shares authorized; 138,409 and 137,990 shares issued and outstanding at March 31, 2017 and December 31, 2016, respectively 1,384 1,380 Additional paid-in capital 2,579,066 2,576,988 Accumulated deficit (2,757,732 ) (2,706,408 ) Total FelCor stockholders’ equity 132,055 181,297 Noncontrolling interests in other partnerships 7,199 7,503 Preferred equity in consolidated joint venture, liquidation value of $44,694 and $44,667 at March 31, 2017 and December 31, 2016, respectively 43,783 43,783 Total equity 183,037 232,583 Total liabilities and equity $ 1,680,165 $ 1,707,092 Consolidated Debt Summary (dollars in thousands) Encumbered Interest March 31, December 31, Hotels Rate (%) Maturity Date 2017 2016 Senior unsecured notes — 6.00 June 2025 $ 475,000 $ 475,000 Senior secured notes 9 5.625 March 2023 525,000 525,000 Mortgage debt(a) 4 4.95 October 2022 119,536 120,109 Mortgage debt 1 4.94 October 2022 30,040 30,184 Line of credit(b) 7 LIBOR + 2.75 June 2019 135,000 119,000 Mortgage debt(c) 1 LIBOR + 3.00 November 2017 85,000 85,000 Total 22 $ 1,369,576 $ 1,354,293 Unamortized debt issuance costs (15,389 ) (15,967 ) Debt, net of unamortized debt issuance costs $ 1,354,187 $ 1,338,326 Schedule of Encumbered Hotels (dollars in millions) Consolidated Debt March 31, 2017 Encumbered Hotels Senior secured notes $ 525 Atlanta Buckhead - ES, Boston Marlboro - ES, Burlington - SH, Dallas Love Field - ES, Milpitas - ES, Myrtle Beach Resort - HIL, Orlando South - ES, Philadelphia Society Hill - SH and SF South San Francisco - ES Mortgage debt $ 27 Napa Valley - ES Mortgage debt $ 34 Ft. Lauderdale - ES Mortgage debt $ 23 Birmingham - ES Mortgage debt $ 36 Minneapolis Airport - ES Mortgage debt $ 30 Deerfield Beach - ES Line of credit $ 135 Austin - DTG, Boston Copley - FM, Charleston Mills House - WYN, LA LAX S - ES, Santa Monica at the Pier - WYN, SF Union Square - MAR and St. Petersburg Vinoy - REN Mortgage debt $ 85 The Knickerbocker Capital Expenditures (dollars in thousands) Three Months Ended March 31, 2017 2016 Improvements and additions to majority-owned hotels $ 19,462 $ 14,008 Partners’ pro rata share of additions to consolidated joint venture hotels (34 ) (27 ) Pro rata share of additions to unconsolidated hotels 189 257 Total additions to hotels(a) $ 19,617 $ 14,238 Total Enterprise Value (in thousands, except per share data) March 31, December 31, 2017 2016 Common shares outstanding 138,409 137,990 Units outstanding 610 610 Combined shares and units outstanding 139,019 138,600 Common stock price $ 7.51 $ 8.01 Market capitalization $ 1,044,033 $ 1,110,186 Series A preferred stock(a) 321,987 321,987 Preferred equity - Knickerbocker joint venture, net 41,594 41,594 Consolidated debt (b) 1,369,576 1,354,293 Noncontrolling interests of consolidated debt (4,250 ) (4,250 ) Pro rata share of unconsolidated debt 11,096 11,167 Cash, cash equivalents and restricted cash (72,554 ) (66,808 ) Total enterprise value (TEV) $ 2,711,482 $ 2,768,169 Hotel Operating Statistics Occupancy (%) ADR ($) RevPAR ($) Three Months Ended March 31, Three Months Ended March 31, Three Months Ended March 31, Same-store Hotels 2017 2016 %Change 2017 2016 %Change 2017 2016 %Change Embassy Suites Atlanta-Buckhead 73.4 80.9 (9.4 ) 165.91 159.13 4.3 121.70 128.79 (5.5 ) DoubleTree Suites by Hilton Austin 85.3 82.8 3.0 251.65 240.06 4.8 214.75 198.87 8.0 Embassy Suites Birmingham 79.3 80.7 (1.6 ) 133.91 133.82 0.1 106.25 107.92 (1.6 ) The Fairmont Copley Plaza, Boston 62.3 64.0 (2.6 ) 245.20 252.18 (2.8 ) 152.80 161.36 (5.3 ) Wyndham Boston Beacon Hill 73.1 63.8 14.7 149.02 164.42 (9.4 ) 108.99 104.87 3.9 Embassy Suites Boston-Marlborough 57.0 64.8 (12.0 ) 160.42 167.60 (4.3 ) 91.49 108.56 (15.7 ) Sheraton Burlington Hotel & Conference Center 63.6 68.5 (7.2 ) 91.82 93.17 (1.4 ) 58.43 63.86 (8.5 ) The Mills House Wyndham Grand Hotel, Charleston 77.0 78.1 (1.3 ) 219.17 205.75 6.5 168.80 160.63 5.1 Embassy Suites Dallas-Love Field 78.9 85.3 (7.4 ) 153.71 143.51 7.1 121.35 122.36 (0.8 ) Embassy Suites Deerfield Beach-Resort & Spa 83.5 88.2 (5.4 ) 253.56 269.69 (6.0 ) 211.69 237.96 (11.0 ) Embassy Suites Fort Lauderdale 17th Street 87.3 93.4 (6.5 ) 236.33 231.31 2.2 206.43 215.99 (4.4 ) Wyndham Houston-Medical Center Hotel & Suites 77.7 86.0 (9.7 ) 163.88 159.64 2.7 127.30 137.32 (7.3 ) The Knickerbocker- New York 69.5 58.5 18.8 270.32 264.35 2.3 187.97 154.74 21.5 Embassy Suites Los Angeles-International Airport/South 89.8 90.0 (0.2 ) 171.13 162.70 5.2 153.73 146.41 5.0 Embassy Suites Mandalay Beach-Hotel & Resort 74.4 76.7 (3.0 ) 186.58 207.31 (10.0 ) 138.84 158.98 (12.7 ) Embassy Suites Miami-International Airport 85.7 91.5 (6.3 ) 182.81 197.22 (7.3 ) 156.74 180.41 (13.1 ) Embassy Suites Milpitas-Silicon Valley 79.8 80.8 (1.2 ) 200.18 211.62 (5.4 ) 159.78 170.92 (6.5 ) Embassy Suites Minneapolis-Airport 66.4 68.7 (3.4 ) 135.95 143.73 (5.4 ) 90.27 98.80 (8.6 ) Embassy Suites Myrtle Beach-Oceanfront Resort 65.6 68.6 (4.3 ) 129.18 129.48 (0.2 ) 84.79 88.83 (4.5 ) Hilton Myrtle Beach Resort 45.5 48.1 (5.4 ) 107.81 106.90 0.8 49.11 51.47 (4.6 ) Embassy Suites Napa Valley 73.2 79.9 (8.4 ) 191.45 182.08 5.1 140.15 145.56 (3.7 ) Wyndham New Orleans-French Quarter 78.1 73.7 6.0 160.31 155.37 3.2 125.23 114.53 9.3 Morgans New York 75.9 72.9 4.2 184.26 212.76 (13.4 ) 139.83 155.01 (9.8 ) Royalton New York 74.5 76.2 (2.3 ) 216.27 237.95 (9.1 ) 161.11 181.40 (11.2 ) Embassy Suites Orlando-International Drive South/Convention Center 81.2 88.1 (7.9 ) 186.16 176.25 5.6 151.10 155.36 (2.7 ) DoubleTree Suites by Hilton Orlando-Lake Buena Vista 89.9 92.3 (2.6 ) 162.75 165.40 (1.6 ) 146.32 152.60 (4.1 ) Wyndham Philadelphia Historic District 59.8 55.0 8.7 124.29 125.93 (1.3 ) 74.29 69.26 7.3 Sheraton Philadelphia Society Hill Hotel 56.4 55.0 2.4 151.09 151.24 (0.1 ) 85.16 83.24 2.3 Embassy Suites Phoenix-Biltmore 77.0 78.0 (1.3 ) 229.70 243.29 (5.6 ) 176.88 189.88 (6.8 ) Wyndham Pittsburgh University Center 60.8 55.4 9.8 131.56 132.08 (0.4 ) 80.05 73.21 9.4 Wyndham San Diego Bayside 79.2 77.5 2.2 157.83 137.19 15.0 124.99 106.31 17.6 Embassy Suites San Francisco Airport-South San Francisco 85.5 85.4 0.1 200.19 197.13 1.6 171.15 168.39 1.6 Embassy Suites San Francisco Airport-Waterfront 84.7 85.3 (0.7 ) 214.24 204.40 4.8 181.36 174.25 4.1 Holiday Inn San Francisco-Fisherman’s Wharf 84.9 82.0 3.6 185.45 194.67 (4.7 ) 157.53 159.58 (1.3 ) San Francisco Marriott Union Square 83.3 88.6 (6.0 ) 321.37 319.58 0.6 267.59 283.21 (5.5 ) Wyndham Santa Monica at the Pier 84.1 87.8 (4.2 ) 255.78 258.44 (1.0 ) 215.04 226.83 (5.2 ) Embassy Suites Secaucus-Meadowlands 60.2 54.6 10.2 167.01 171.47 (2.6 ) 100.48 93.62 7.3 The Vinoy Renaissance St. Petersburg Resort & Golf Club 86.2 88.2 (2.2 ) 264.31 256.26 3.1 227.86 225.92 0.9 Same-store Hotels 75.0 75.9 (1.2 ) 189.63 189.76 (0.1 ) 142.15 143.97 (1.3 ) Historical Quarterly Operating Statistics Occupancy (%) Q1 2016 Q2 2016 Q3 2016 Q4 2016 Q1 2017 Same-store hotels(a) 75.9 83.0 82.0 73.5 75.0 ADR ($) Q1 2016 Q2 2016 Q3 2016 Q4 2016 Q1 2017 Same-store hotels(a) 189.76 200.24 199.99 192.05 189.63 RevPAR ($) Q1 2016 Q2 2016 Q3 2016 Q4 2016 Q1 2017 Same-store hotels(a) 143.97 166.13 163.92 141.11 142.15 Non-GAAP Financial Measures We refer in this release to certain “non-GAAP financial measures.” These measures, including FFO, Adjusted FFO, EBITDA, Adjusted EBITDA, Same-store Adjusted EBITDA, Hotel EBITDA and Hotel EBITDA margin, are measures of our financial performance that are not calculated and presented in accordance with generally accepted accounting principles (“GAAP”). The following tables reconcile each of these non-GAAP measures to the most comparable GAAP financial measure. Immediately following the reconciliations, we include a discussion of why we believe these measures are useful supplemental measures of our performance and the limitations of such measures. Reconciliation of Net Loss to FFO and Adjusted FFO (in thousands, except per share data) Three Months Ended March 31, 2017 2016 Per Per Share Share Dollars Shares Amount Dollars Shares Amount Net loss $ (36,141 ) $ (5,081 ) Noncontrolling interests 590 519 Preferred distributions - consolidated joint venture (360 ) (360 ) Preferred dividends (6,279 ) (6,279 ) Net loss attributable to FelCor common stockholders (42,190 ) (11,201 ) Less: Dividends declared on unvested restricted stock (37 ) (38 ) Basic and diluted earnings per share data (42,227 ) 137,778 $ (0.31) (11,239 ) 139,678 $ (0.08) Depreciation and amortization 27,838 — 0.20 29,183 — 0.22 Depreciation, unconsolidated entities and other partnerships 455 — — 467 — — Impairment 24,838 — 0.18 — — — Loss on sale of hotels 666 — 0.01 714 — — Noncontrolling interests in FelCor LP (186 ) 610 — (48 ) 611 — Dividends declared on unvested restricted stock 37 55 — 38 8 — Conversion of unvested restricted stock units — 207 — — 619 — FFO* 11,421 138,650 0.08 19,115 140,916 0.14 Hurricane loss 17 — — — — — Hurricane loss, unconsolidated entities 4 — — — — — Cost of potential transaction 473 — 0.01 — — — Abandoned projects — — — 232 — — Variable stock compensation — — — 761 — — Pre-opening costs 132 — — 54 — — Adjusted FFO* $ 12,047 138,650 $ 0.09 $ 20,162 140,916 $ 0.14 Reconciliation of Net Loss to EBITDA, Adjusted EBITDA and Same-store Adjusted EBITDA (in thousands) Three Months Ended March 31, 2017 2016 Net loss $ (36,141 ) $ (5,081 ) Depreciation and amortization 27,838 29,183 Depreciation, unconsolidated entities and other partnerships 455 467 Interest expense 19,319 19,732 Interest expense, unconsolidated entities and other partnerships 84 99 Income tax 547 415 Noncontrolling interests in preferred distributions, consolidated joint venture (18 ) (18 ) Noncontrolling interests in other partnerships 404 471 EBITDA* 12,488 45,268 Impairment 24,838 — Hurricane loss 17 — Hurricane loss, unconsolidated entities 4 — Loss on sale of hotels 666 714 Amortization of fixed stock and directors’ compensation 1,593 1,935 Cost of potential transaction 473 — Abandoned projects — 232 Variable stock compensation — 761 Pre-opening costs 132 54 Adjusted EBITDA* 40,211 48,964 Adjusted EBITDA from sold hotels (146 ) (5,881 ) Same-store Adjusted EBITDA* $ 40,065 $ 43,083 Hotel EBITDA and Hotel EBITDA Margin (dollars in thousands) Three Months Ended March 31, 2017 2016 Same-store operating revenue: Room $ 144,933 $ 148,423 Food and beverage 32,074 31,990 Other operating departments 10,415 10,027 Same-store operating revenue 187,422 190,440 Same-store operating expense: Room 40,669 40,417 Food and beverage 26,221 26,284 Other operating departments 3,533 3,489 Other property-related costs 50,863 51,011 Management and franchise fees 7,424 8,459 Taxes, insurance and lease expense 13,525 12,665 Same-store operating expense 142,235 142,325 Hotel EBITDA $ 45,187 $ 48,115 Hotel EBITDA Margin 24.1 % 25.3 % The following tables set forth the components of our Hotel EBITDA for our same-store hotels (dollars in thousands): Three months ended March 31, 2017 Hotel Operating Net Income Other Interest Hotel Hotel EBITDA Same-store Hotels Revenue (Loss) Adjustments Depreciation Expense EBITDA Margin Embassy Suites Atlanta-Buckhead $ 3,838 $ 1,027 $ — $ 519 $ — $ 1,546 40.3 % DoubleTree Suites by Hilton Austin 4,466 1,441 — 465 152 2,058 46.1 % Embassy Suites Birmingham 2,462 125 — 400 290 815 33.1 % The Fairmont Copley Plaza, Boston 9,607 (4,020 ) — 2,233 388 (1,399 ) (14.6 )% Wyndham Boston Beacon Hill 3,594 (374 ) — 986 — 612 17.0 % Embassy Suites Boston-Marlborough 2,166 167 — 288 — 455 21.0 % Sheraton Burlington Hotel & Conference Center 2,554 (429 ) — 620 — 191 7.5 % The Mills House Wyndham Grand Hotel, Charleston 4,676 860 — 617 199 1,676 35.8 % Embassy Suites Dallas-Love Field 3,132 353 — 607 — 960 30.7 % Embassy Suites Deerfield Beach-Resort & Spa 5,621 1,785 — 469 388 2,642 47.0 % Embassy Suites Fort Lauderdale 17th Street 7,665 2,340 — 714 436 3,490 45.5 % Wyndham Houston-Medical Center Hotel & Suites 3,709 1,155 (19 ) 541 — 1,677 45.2 % The Knickerbocker-New York 7,581 (4,845 ) 699 2,565 920 (661 ) (8.7 )% Embassy Suites Los Angeles-International Airport/South 5,908 1,452 — 628 228 2,308 39.1 % Embassy Suites Mandalay Beach-Hotel & Resort 4,059 371 — 772 — 1,143 28.2 % Embassy Suites Miami-International Airport 5,423 1,502 — 460 — 1,962 36.2 % Embassy Suites Milpitas-Silicon Valley 4,596 1,355 — 307 — 1,662 36.2 % Embassy Suites Minneapolis-Airport 2,623 (193 ) — 364 461 632 24.1 % Embassy Suites Myrtle Beach-Oceanfront Resort 3,798 (442 ) 3 654 — 215 5.7 % Hilton Myrtle Beach Resort 2,959 (1,057 ) 14 885 — (158 ) (5.3 )% Embassy Suites Napa Valley 3,353 66 — 483 337 886 26.4 % Wyndham New Orleans-French Quarter 4,636 1,509 — 718 — 2,227 48.0 % Morgans New York 1,720 (1,445 ) 266 503 — (676 ) (39.3 )% Royalton New York 3,582 (26,887 ) 25,098 (1) 599 — (1,190 ) (33.2 )% Embassy Suites Orlando-International Drive South/Convention Center 3,419 824 — 419 — 1,243 36.4 % DoubleTree Suites by Hilton Orlando-Lake Buena Vista 3,670 344 — 765 — 1,109 30.2 % Wyndham Philadelphia Historic District 3,181 (256 ) (3 ) 721 — 462 14.5 % Sheraton Philadelphia Society Hill Hotel 4,587 (360 ) — 967 — 607 13.2 % Embassy Suites Phoenix-Biltmore 3,812 1,396 — 435 — 1,831 48.0 % Wyndham Pittsburgh University Center 2,334 (101 ) — 496 — 395 16.9 % Wyndham San Diego Bayside 8,512 753 — 1,558 — 2,311 27.1 % Embassy Suites San Francisco Airport-South San Francisco 5,675 1,302 — 443 — 1,745 30.7 % Embassy Suites San Francisco Airport-Waterfront 6,653 1,324 1 784 — 2,109 31.7 % Holiday Inn San Francisco-Fisherman’s Wharf 9,282 10 — 608 — 618 6.7 % San Francisco Marriott Union Square 11,275 1,982 (7 ) 1,302 466 3,743 33.2 % Wyndham Santa Monica at the Pier 2,790 994 — 263 157 1,414 50.7 % Embassy Suites Secaucus-Meadowlands 2,563 (87 ) — 104 — 17 0.7 % The Vinoy Renaissance St. Petersburg Resort & Golf Club 15,941 2,573 139 1,466 332 4,510 28.3 % $ 187,422 $ (13,486 ) $ 26,191 $ 27,728 $ 4,754 $ 45,187 24.1 % Three months ended March 31, 2016 Hotel Operating Net Income Other Interest Hotel Hotel EBITDA Same-store Hotels Revenue (Loss) Adjustments Depreciation Expense EBITDA Margin Embassy Suites Atlanta-Buckhead $ 4,042 $ 1,104 $ — $ 634 $ — $ 1,738 43.0 % DoubleTree Suites by Hilton Austin 3,984 1,204 — 482 182 1,868 46.9 % Embassy Suites Birmingham 2,538 231 — 389 298 918 36.2 % The Fairmont Copley Plaza, Boston 10,036 (3,149 ) (91 ) 2,179 465 (596 ) (5.9 )% Wyndham Boston Beacon Hill 3,469 (497 ) — 991 — 494 14.2 % Embassy Suites Boston-Marlborough 2,569 374 — 297 — 671 26.1 % Sheraton Burlington Hotel & Conference Center 2,711 (406 ) — 621 — 215 7.9 % The Mills House Wyndham Grand Hotel, Charleston 4,666 831 — 637 239 1,707 36.6 % Embassy Suites Dallas-Love Field 3,107 642 — 338 — 980 31.5 % Embassy Suites Deerfield Beach-Resort & Spa 6,195 2,104 — 476 399 2,979 48.1 % Embassy Suites Fort Lauderdale 17th Street 7,956 2,475 — 712 448 3,635 45.7 % Wyndham Houston-Medical Center Hotel & Suites 4,015 1,267 (19 ) 553 — 1,801 44.9 % The Knickerbocker-New York 5,953 (5,401 ) 706 2,570 702 (1,423 ) (23.9 )% Embassy Suites Los Angeles-International Airport/South 5,674 1,230 — 642 273 2,145 37.8 % Embassy Suites Mandalay Beach-Hotel & Resort 4,616 854 — 771 — 1,625 35.2 % Embassy Suites Miami-International Airport 6,112 1,893 — 470 — 2,363 38.7 % Embassy Suites Milpitas-Silicon Valley 4,771 1,519 — 302 ��� 1,821 38.2 % Embassy Suites Minneapolis-Airport 2,926 (130 ) — 444 474 788 26.9 % Embassy Suites Myrtle Beach-Oceanfront Resort 4,194 (235 ) 1 675 — 441 10.5 % Hilton Myrtle Beach Resort 3,054 (961 ) — 848 — (113 ) (3.7 )% Embassy Suites Napa Valley 3,554 150 — 517 346 1,013 28.5 % Wyndham New Orleans-French Quarter 4,358 1,210 — 716 — 1,926 44.2 % Morgans New York 1,739 (1,418 ) 159 627 — (632 ) (36.3 )% Royalton New York 4,079 (1,538 ) 205 580 — (753 ) (18.5 )% Embassy Suites Orlando-International Drive South/Convention Center 3,561 1,102 — 271 — 1,373 38.6 % DoubleTree Suites by Hilton Orlando-Lake Buena Vista 3,897 495 — 765 — 1,260 32.3 % Wyndham Philadelphia Historic District 3,024 (513 ) — 750 — 237 7.8 % Sheraton Philadelphia Society Hill Hotel 4,363 (621 ) — 979 — 358 8.2 % Embassy Suites Phoenix-Biltmore 4,150 1,637 — 438 — 2,075 50.0 % Wyndham Pittsburgh University Center 2,141 (323 ) — 520 — 197 9.2 % Wyndham San Diego Bayside 7,082 54 — 1,571 — 1,625 22.9 % Embassy Suites San Francisco Airport-South San Francisco 5,723 1,449 — 412 — 1,861 32.5 % Embassy Suites San Francisco Airport-Waterfront 6,531 1,364 — 749 — 2,113 32.4 % Holiday Inn San Francisco-Fisherman’s Wharf 9,471 295 — 480 — 775 8.2 % San Francisco Marriott Union Square 11,929 2,376 (2 ) 1,370 560 4,304 36.1 % Wyndham Santa Monica at the Pier 2,972 990 — 283 189 1,462 49.2 % Embassy Suites Secaucus-Meadowlands 2,377 (241 ) 1 121 — (119 ) (5.0 )% The Vinoy Renaissance St. Petersburg Resort & Golf Club 16,901 3,086 56 1,443 398 4,983 29.5 % $ 190,440 $ 14,503 $ 1,016 $ 27,623 $ 4,973 $ 48,115 25.3 % Reconciliation of Same-store Operating Revenue and Same-store Operating Expense to Total Revenue, Total Operating Expense and Operating Income (Loss) (in thousands) Three Months Ended March 31, 2017 2016 Same-store operating revenue $ 187,422 $ 190,440 Other revenue 408 687 Revenue from sold hotels(a) 274 19,017 Total revenue 188,104 210,144 Same-store operating expense 142,235 142,325 Consolidated hotel lease expense(b) 815 802 Unconsolidated taxes, insurance and lease expense (438 ) (452 ) Corporate expenses 6,940 8,400 Depreciation and amortization 27,838 29,183 Impairment 24,838 — Expenses from sold hotels(a) 128 13,136 Other expenses 1,260 828 Total operating expense 203,616 194,222 Operating income (loss) $ (15,512 ) $ 15,922 Substantially all of our non-current assets consist of real estate. Historical cost accounting for real estate assets implicitly assumes that the value of real estate assets diminishes predictably over time. Since real estate values instead have historically risen or fallen with market conditions, most industry investors consider supplemental measures of performance, which are not measures of operating performance under GAAP, to be helpful in evaluating a real estate company’s operations. These supplemental measures are not measures of operating performance under GAAP. However, we consider these non-GAAP measures to be supplemental measures of a hotel REIT’s performance and should be considered along with, but not as an alternative to, net income (loss) attributable to FelCor as a measure of our operating performance. FFO and EBITDA The National Association of Real Estate Investment Trusts (“NAREIT”) defines Funds From Operations (“FFO”) as net income or loss attributable to parent (computed in accordance with GAAP), excluding gains or losses from sales of property, plus depreciation, amortization and impairment losses. FFO for unconsolidated partnerships and joint ventures is calculated on the same basis. We compute FFO in accordance with standards established by NAREIT. This may not be comparable to FFO reported by other REITs that do not define the term in accordance with the current NAREIT definition or that interpret the current NAREIT definition differently than we do. Earnings Before Interest, Taxes, Depreciation and Amortization (“EBITDA”) is a commonly used measure of performance in many industries. We define EBITDA as net income or loss attributable to parent (computed in accordance with GAAP) plus interest expenses, income taxes, depreciation and amortization, and after adjustments for unconsolidated partnerships and joint ventures. Adjustments for unconsolidated partnerships and joint ventures are calculated to reflect EBITDA on the same basis. Adjustments to FFO and EBITDA We adjust FFO and EBITDA when evaluating our performance because management believes that the exclusion of certain additional items provides useful supplemental information to investors regarding our ongoing operating performance and that the presentation of Adjusted FFO, and Adjusted EBITDA when combined with GAAP net income attributable to FelCor, EBITDA and FFO, is beneficial to an investor’s understanding of our operating performance. * Gains and losses related to extinguishment of debt and interest rate swaps - We exclude gains and losses related to extinguishment of debt and interest rate swaps from Adjusted FFO and Adjusted EBITDA because we believe that it is not indicative of ongoing operating performance of our hotel assets. This also represents an acceleration of interest expense or a reduction of interest expense, and interest expense is excluded from EBITDA. * Cumulative effect of a change in accounting principle - Infrequently, the Financial Accounting Standards Board promulgates new accounting standards that require the consolidated statements of operations to reflect the cumulative effect of a change in accounting principle. We exclude these one-time adjustments in computing Adjusted FFO and Adjusted EBITDA because they do not reflect our actual performance for that period. * Other expenses and costs - From time to time, we incur expenses or transaction costs that are not indicative of ongoing operating performance. Such costs include, but are not limited to, conversion costs, acquisition costs, pre-opening costs, severance costs and certain non-cash adjustments. We exclude these costs from the calculation of Adjusted FFO and Adjusted EBITDA. * Variable stock compensation - We exclude the cost associated with our variable stock compensation. This cost is subject to volatility related to the price and dividends of our common stock that does not necessarily correspond to our operating performance. In addition, to derive Adjusted EBITDA, we exclude gains or losses on the sale of depreciable assets and impairment losses because including them in EBITDA is inconsistent with reporting the ongoing performance of our remaining assets. Additionally, the gain or loss on sale of depreciable assets and impairment losses represents either accelerated depreciation or excess depreciation in previous periods, and depreciation is excluded from EBITDA. We also exclude the amortization of our fixed stock and directors’ compensation, which is included in corporate expenses and is not separately stated on our statements of operations. Excluding amortization of our fixed stock and directors’ compensation maintains consistency with the EBITDA definition. Hotel EBITDA and Hotel EBITDA Margin Hotel EBITDA and Hotel EBITDA margin are commonly used measures of performance in the hotel industry and give investors a more complete understanding of the operating results over which our individual hotels and brands/managers have direct control. We believe that Hotel EBITDA and Hotel EBITDA margin are useful to investors by providing greater transparency with respect to two significant measures that we use in our financial and operational decision-making. Additionally, using these measures facilitates comparisons with other hotel REITs and hotel owners. We present Hotel EBITDA and Hotel EBITDA margin in a manner consistent with Adjusted EBITDA, however, we also eliminate all revenues and expenses from continuing operations not directly associated with hotel operations, including other income and corporate-level expenses. We eliminate these additional items because we believe property-level results provide investors with supplemental information regarding the ongoing operational performance of our hotels and the effectiveness of management on a property-level basis. We also eliminate consolidated percentage rent paid to unconsolidated entities, which is effectively eliminated by noncontrolling interests and equity in income from unconsolidated subsidiaries, and include the cost of unconsolidated taxes, insurance and lease expense, to reflect the entire operating costs applicable to our consolidated hotels. Hotel EBITDA and Hotel EBITDA margins are presented on a same-store basis. Use and Limitations of Non-GAAP Measures We use FFO, Adjusted FFO, EBITDA, Adjusted EBITDA, Same-store Adjusted EBITDA, Hotel EBITDA and Hotel EBITDA margin to evaluate the performance of our hotels and to facilitate comparisons between us and other hotel REITs, hotel owners who are not REITs and other capital intensive companies. We use Hotel EBITDA and Hotel EBITDA margin in evaluating hotel-level performance and the operating efficiency of our hotel managers. The use of these non-GAAP financial measures has certain limitations. As we present them, these non-GAAP financial measures may not be comparable to similar non-GAAP financial measures as presented by other real estate companies. These measures do not reflect certain expenses or expenditures that we incurred and will incur, such as depreciation, interest and capital expenditures. We compensate for these limitations by separately considering the impact of these excluded items to the extent they are material to operating decisions or assessments of our operating performance. Our reconciliations to the most comparable GAAP financial measures, and our consolidated statements of operations and cash flows, include interest expense, capital expenditures, and other excluded items, all of which should be considered when evaluating our performance, and the usefulness of our non-GAAP financial measures. These non-GAAP financial measures are used in addition to and in conjunction with results presented in accordance with GAAP. They should not be considered as alternatives to operating profit, cash flow from operations or any other operating performance measure prescribed by GAAP. These non-GAAP financial measures reflect additional ways of viewing our operations that we believe, when viewed with our GAAP results and the reconciliations to the corresponding GAAP financial measures, provide a more complete understanding of factors and trends affecting our business than could be obtained absent this disclosure. We strongly encourage investors to review our financial information in its entirety and not to rely on any single financial measure. Logos, product and company names mentioned are the property of their respective owners.
0 notes
Note
Hii can I get a Chishiya x reader where the reader is an artist? It can be in whatever format u like, I don't really mind. Please and thank u!


“ A PAINTING FOR YOU!! ” — chishiya x artist!reader
where chishiyas s/o is an artist who likes to take painting commissions, except this time valentine’s day is getting closer and they want to make a special gift just for chishiya.
— HIHI!! TYSM FOR REQUESTING,, I had this idea to add on to the request hopefully you don’t mind<3 but I hope it is to your liking!! ,, ps there’s most likely spelling and grammar mistakes so anything I missed, feel free to correct me 💕 also so sorry for writing this 4 days after valentines😭 ,, also,, mentions of wife and husband..

it was currently 10 pm, saturday february 11. three full days before valentine’s day, yet you were still busy finishing up your commissions instead of planning something special for your boyfriend. the thought of making something for him this year crossed your mind as you were scrolling through Instagram looking through your feed. it wasn’t a bad idea at all actually. surely chishiya would appreciate a gift.
you were a painter who made portraits and other paintings for people, chishiya admired this. he always wondered how you were so patient yet fast when handling your art. truly a unique talent, even for him to admit. you had actually tried to teach chishiya how to sketch and make a good painting, the basics. not once did it work out. he may be a fast learner but sticking to the med field instead of art would be better.
still, you always kept his painting attempts most of the time. point is, valentine’s day was approaching rather quickly and this year you wanted to use your talent to good use. it had to be something meaningful yet pretty, something he would love to admire. this was your second year as a couple celebrating the 14th together. you had thought of other things to possibly gift the half blond but chishiya was never the materialistic type so choosing something for him was rather difficult.
so that’s when the idea of a painting came in, i mean you could easily finish a canvas in three days, right? the moment you realized what you wanted to do you got up from your bed and immediately started to sketch out your idea. you only had three days to finish the painting, thank god chishiya didnt live with you, otherwise the gift would’ve been a big fail right from the start.
after about an hour of narrowing down your ideas, you went for the safer option, your favorite date spot. it was more of a rough sketch idea since you weren’t fully sure when you first started, finishing the sketch would probably take all night but you were willing to take that risk. of course you would be closing and pausing your commissions just until the 15th so you could focus on the main thing.
obviously the colors would be a pain to find so mixing and combining the ones you had at home were the safer option. greys, whites, some really pigmented and bright ones others pretty dark.. yet it was a good palette. it all looked good together when you tested it on a small scaled canvas. it was now 7 am, frebruary 12th, took all night to finish, but at least the picture itself was done.. good news!!
although the bad news on the other hand,, chishiya would be arriving at your doorstep any moment now. he would always make sure to see you before a shift of his at the hospital, which was quite early. you had to put a cover over the canvas and securely lock your art room beforehand. it was screaming suspicion but who cares, not like you killed anyone. though the idea of chishiya finding out his gift wasn’t pleasant so before he arrived you tried to look natural which wouldn’t be easy with the evident dark circles under your eyes that made it obvious you hadn’t slept an inch.
right after you walked back to the kitchen the sound of keys trying to unlock the door were heard. normally you would be happy yet sleepy of his presence right before going to work. this time you were nervous and still sleepy, he figures things out way too quickly specially when you act suspicious, he can read a person too well. you heard him go upstairs, thankfully not where your art room is at. confused you waited for him to come back downstairs, “there you are, I thought you were still be in bed” chishiya made his way to the counter. on sundays you stayed in bed until he arrived and woke you up to eat breakfast.
“I woke up a tad bit earlier today” you turned to him with two mugs filled with hot water. “morning chishi” you smiled at him trying to shake off the nervousness. he looked up at you and his eyes immediately landed on the dark circles right beneath yours. “did you not sleep well?” he frowned. “ah, this? I was finishing up some commissions last night that I completely forgot to sleep haha..” he raised a brow at you with clear confusion, but questioned no further.
to anyone, you staying up finishing any art project of yours would be normal, to him it’s was very,, weird. chishiya knew you all too well, you would never and when I say never it’s because clearly, never have you stayed all up all night trying to finish a canvas. still he didn’t mention a single word of this, “you should’ve told me, you could be sleeping right now instead of having breakfast with me” it was your time to frown, “but I wouldn’t have seen you today, anyway it doesn’t bother me I purely run on coffee” you said proudly.
“you’re stupid” he sighted, though truth is he was glad he got to see you before work, long hours at the hospital were exhausting specially when he didn’t get to see you all day. he would never admit to that though. “make sure to sleep after, it’s not healthy not getting any sleep, you could get sick” there he goes again scolding you about your health, it’s almost as if he was your husband and you his wife. “i know, i know, don’t worry i will” you weren’t..
he left soon after you packed his lunch, which was rather silly. everytime you thought about it, it would be almost as if you were a married couple. with a quick kiss and hug he exited your house and walked to his destination.
right after he left you grabbed your keys and unlocked your art room again ready to continue. he would scold you later when he finds out you went straight to your project rather than sleeping. but that would be a worry for later. sadly he wouldn’t be back until tomorrow when he finished his shift.. at least it would give you more time to work rather than having to hide your painting.
at some point you decided to stop and actually take a small nap, anyway you were half done and it was 1 am, february 13th. once again you put a cover over the canvas and locked the door before walking up to your room and finally sleeping. yet that didn’t exactly do much for your eye bags.
“you didn’t sleep again?” he sounded tired and sleepy the very next morning he arrived from the hospital “you haven’t slept either chishi” whenever he arrived at your doorstep tired from his long hour shifts you would grow worried for his health. “let’s get you to bed” you grabbed his hand as he followed. it was a pretty normal routine by now. he would sleep at your house while you either stayed right beside him or went out to buy groceries. this time you would have to go back down and finally finish the project. which was very risky considering he was there.
he immediately knocked out after he felt himself laying down, you giggled at his sight as you went back downstairs. you made sure to lock your art room before starting so he wouldn’t accidentally walk in on you making his gift. after many hours later the painting was finally done and you could get a good rest right next to your boyfriend.
finally the 14th of february arrived, you were excited to show him his present that you worked hard on. hoping that he would like it even more, you took him to the exact same spot that was painted into the canvas. a picnic date to be exact. you were both clearly still in need of sleep but that business would be for later after your date.
he had a bag and some flowers in hand when he arrived, he was wearing the white hoodie you got him last year with a white shirt underneath and sweatpants.. typical of him. the canvas was right beside the basket of food you brought but that would be opened after you were done eating.
some small typical talk later you both finished your food “thankfully you had today off, you seriously needed a break” you were picking up and trashing the items you no longer used. now, it was the time for gifts , much to his dismay. chishiya was never good with words so he always just handed you your gift straightforward “here” he grabbed the bag by his side and gave it to you. it was a necklace with both of your initials although the s stood out more.
you let out a grin “thank you shuntaro”, surprisingly he didn’t buy you a ring, (he was about to).. actually even more surprising, he got you jewelry. you asked him to clip the necklace from behind your neck. it was a pretty necklace needless to say. he also handed you a letter but he advised you to open it later when he wasn’t in your presence anymore.
now it was your turn to give him his gift. you let out a deep breath and grabbed the boxed canvas behind you. “i wanted to gift you something special this year, so hopefully you like this” you hand him the painting.
he slowly unwraps the tie and opens the box, for a second you see his eyes widen as he stares at the content inside, slowly they soften and he smirks “so this is what you were hiding” you look up at him shocked “YOU KNEW?!?” you couldn’t believe such a moment was ruined by him telling you he already knew.
“it was pretty obvious dumbass” you sighted in defeat “at least you didn’t know what the painting contained..” you smiled softly “do you like it?” you looked up at him, his eyes to be exact. he only hums and smiles at your words, you feel all the nervousness lift from your shoulders.
you launched yourself at him with joy as he falls back on the grass. his hands travel to your waist as he hugs you. truth to be told you loved these moments were chishiya showed just how much he actually enjoys being with you without him having to actually say it.
your hands land on both of his cheeks, a small kiss to his forehead. “i’m glad you liked it, let’s have more years together okay?” you smile at him. chishiya could only chuckle at your words yet agree, he looked forward to spending many more years to come with you and truly, only you.
216 notes
·
View notes
Text

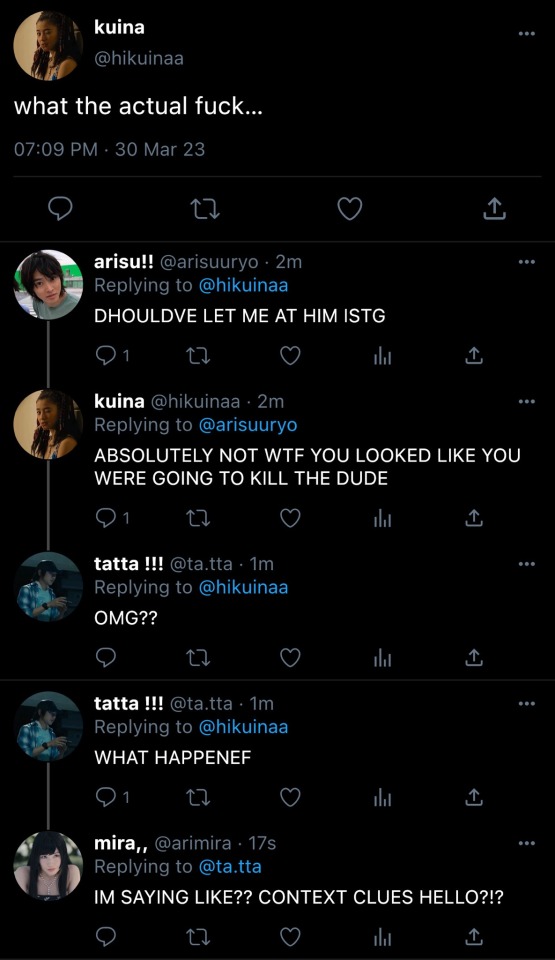
v. im so in love | snap out of it

you weren’t going to lie when you said you were nervous, horribly nervous. many things could go wrong today, but still it was your first date ever in months. you should be glad you were even invited right? after the call you had with chishiya during the night you felt somewhat more relieved. he ended up waking you up with his loud ass alarm, yet it wasn’t that bad since you got to talk about your plans for the day which helped you calm down.
truth to be told, you could only ever fall asleep on call with chishiya and chishiya only. hell not even your own brother. but that aside, you had agreed with karube to meet up at shibuya station at 5 it was currently 4:30.. you had checked your outfit several times just to make sure nothing was wrong. it looked cute but not too exaggerated, did he even think of it as a date?
you were over here giggling and laughing because you believed it was a date, but was it really? maybe he just wanted to hang out as friends, maybe he just wanted to catch up. i mean, after all you had been absent for several months. your thoughts were cut short when you heard a knock coming from your room's door. the only person home was arisu, thinking it was him you opened it.
surprise surprise there was karube with literal flowers in his hand, an actual bouquet now. your eyes widened at his sight, he looked so.. pretty, so?!??? breath taking.. as silly as it sounded he was out of his casual t shirts and jeans he was actually dressed to impress.
“[name]” he greeted you first as he took a good look at your outfit, and shit you looked beautiful. you smiled at him and shook your head “i thought we were meeting at shibuya station?” he laughed knowing he lied about ending his shift at 4, he was actually off today. he had spent the entire morning trying to find a good outfit and some flowers to give to you. that reminded him, he handed you the flowers speaking once again.
“well, I decided to take a little shortcut” you smiled at his words and took the flowers from his hand, placing them in an empty base. “shall we go?” he asked, stepping aside from the doorway so you could exit your apartment. “I say we shall” you intertwined your arms giggling at the use of words.
“it should be about 20-30 minutes to get there” this time you weren't even going to complain about the walk, you were just glad you had a date.
karube was right. it took 30 minutes to get there, although it was worth it since he talked to you all the way to the amusement park. he shared a lot about himself which made you happy since you knew more about him now. “well what do we do? want to walk around first or eat?” it didn’t really matter for you since all you wanted was to have a good day with karube.
“whatever seems best for you, I don’t mind” karube thought for a second deciding what to do first, in an instant he answered “let’s eat first yeah? there’s this 5 star restaurant around here.” 5 star!? like fancy kind of restaurant?? there’s no way you would make karube pay for an expensive meal.
“WHAT?? IS IT LIKE EXPENSIVE??” you were worried about karubes wallet.. “what? no i don’t think so.. anyway even if it was you deserve a good meal” he said those words without a worry in the world. “why don’t we just get some mcdonald’s..” you offered instead.
“nah, it’s all good, c'mon let’s go find it” he took your hand and started walking in the direction of the restaurant. it was the first time you had held his hand for more than 5 minutes, other times it was just your arms linking, this sent you into an overthinking mess. thankfully, karube didn’t pay one bit of attention to your reaction, still looking ahead. it didn’t take you guys much before actually spotting the restaurant and getting a seat.
“What are you going to get?” karube asked, grabbing the menu left on the table. “i’m not s-” your eyes widened at the prices, $20 for a soup!? and it wasn’t even a big bowl.. “karube, i really don’t think we should eat here..”
“hm? why not, the food seems good” he wasn’t even bothered about the prices?? guess you wouldn’t be able to change his mind. you quietly looked through the menu frowning since everything was pretty much the same price for a small amount. the only thing that was slightly cheaper was a plate of takoyaki.
thank god it was even cheap at a 5 star restaurant, anyway you weren’t as hungry so 8 balls would for sure fill your half empty stomach. by the time you were done thinking about your choices the waiter came by and asked if you were ready to order. both you and karube agreed and ordered, you thought maybe after the food arrived you would be able to get to know the blond in front of you even more.
yet, everything seemed to go by fast, the ordering the eating, not even a small spark of conversation happened. truly, it was awkward, but could you blame karube? he was probably just too hungry to try and have a small talk. the date came to a great start, where did all that go?
you thanked karube as he payed the bill, you didn’t even want to know how much it was considering the amount of food ordered. “we can explore the park now if you’d like, there’s souvenir stores too” karube said as he exited the restaurant holding the door for you to step out.
“let’s walk around the park for a little yeah? let’s get a water first tho.. im pretty thirsty..” not to mention throughout the whole meal karube didn’t bother to ask if you wanted anything to drink. it’s okay tho!! he probably just forgot to ask, at least you wanted to believe. restaurant was too expensive anyway..
“oh! i have one in my backpack, I also brought snacks if you want” he pointed towards his back telling you to grab it from there “thank you, do you want one?” the conversation was running smoothly yet it felt so forced? rushed? awkward?.. maybe all of them..
“we can share one” as in, share the same bottle, as in an indirect kiss? “sure..” if kuina was here right now she would have probably scolded you from how dumb you were being, but c'mon an indirect kiss, first kiss ever!?? (it wasn’t your first kiss, just a bad memory..)
you agreed and took the bottle from his backpack, opening the top. the blush was increasingly creeping to your already rosy cheeks as he took the bottle from your hands when you handed it to him. he didn’t seem bothered by the thought of an indirect kiss, maybe he just didn’t care.
oh but he did care, a lot actually, he just wanted to seem cool in front of you. you were snapped out of your thoughts when he spoke up again “we can walk around now, there’s also a ferris wheel near” karube pointed towards a map that was visible on his phone, the online page of the theme park. “THERE'S A FERRIS WHEEL??” you absolutely loved ferris wheels, especially when you could share the moment with someone.. karube stared at you and, suddenly realizing you shouted that a little too loud making people turn to you, you looked away slightly embarrassed.
“pfft, do you want to walk there? it’s not that far” he laughed at your reaction yet he seemed happy about your sudden interest. “lead the way” the moment was perfect to ride the ferris wheel, the sun was setting and fireworks would be happening in 20 minutes, it would give you both enough time to walk there and get on a pod and reach the top for a good view.
you both walked hand in hand enjoying the ambiance of the park, everything was so lively. the date might have started a little on the wrong side but it changed as quickly as it began. his hands were so rough yet warm, it brung you a small feeling of comfort. maybe this was really love you felt, love for your brothers best friend, what a joke.
anyway you would clear your suspicions with kuina and chishiya the next time you see them, they always seemed to know what to say when you came to them for advice. “that’s.. pretty high up” karubes words brought your attention to the ride in front of you. even more perfect, the higher the better for a good view right?
“that’s perfect! we can watch the fireworks from up there!!” you clung into his arm with excitement. he could only smile and laugh at how thrilled you looked.
it took about 5 minutes to get a seat in a pod, the wheel started moving and you stood up to see the view from all the way up, karube chuckled as he watched you, from his view he got a good angle at your face. he was happy seeing you smile so brightly, it made him glad you were enjoying your date, hangout.
the wheel stopped right at the top making you jump in joy, perfect timing since the fireworks were just about to start. you sat back down right in front of him, you took your attention from the window to him. to your surprise, he was staring right at you, and just like that bright lights appeared in the sky exploding and making different shapes, and as cliche as it may sound, right behind him a pink heart appeared outlining his shape.
your eyes widened in surprise, your heart fluttered at the view in front of you. it was possibly even better than the view from your current position in the pod. you were for sure you were head over heels for daikichi karube.
the day finally came to an end, after getting off the ferris wheel and enjoying a small walk around the park you got karube to get in a photo booth with you to take pictures. a special picture to remind you of today. right before leaving karube got you both drinks, milk to be exactly. a chocolate milk, maybe yeah it wasn’t your favorite but you still appreciated his kind gesture.
“thank you for the invite today karube, I had a lot of fun” he hummed at your words with a grin on his face as he looked down at your taken photos. you stopped at your doorstep as he waited for you to go inside, “say hi to arisu for me, have a good night [name]” he gave you a small wave.
maybe you were reaching way farther than you would originally but fuck it, right before going inside you walked back to karube who was standing several steps away from you. in an instant you placed both of your hands on each side of his face and pulled him towards you. another small kiss on his opposite cheek from the last one. “goodnight karube” you quickly turned back and closed the door. thank god arisu wasn’t home to see your current condition.
your legs gave out in embarrassment, since when had you become so bold..
arisu was just arriving at his apartment as he saw his friend outside his door with a hand on his right cheek. “karube?” he asked approaching him, he was dressed completely different from his normal outfits, strangely enough. “arisu, hi” karube turned to him trying to hide his flustered state, “what are you doing? it’s 10.. and why are you dressed so fancy?” arisu had somewhat of an idea of what his blond friend was doing but he wanted to be proven wrong.
“i just came to drop off [name]” ah, that’s right, even if he wanted to be proven wrong he wasn’t going to be. he should feel happy for his sister yet the thought of his best friend and his sister going out bothered him. he wanted to be happy for you, but knowing how karube is and how he handles things he wasn’t exactly very sure of your relationship. “stop playing around with [name] like that if you aren’t serious about it.”
“what?..” karubes smile suddenly dropped at arisus words “you know perfectly what i mean karube, last time you did this you lead the poor girl on, I don’t want that to happen with my sister” as much as he loved his friends his sister was far more important. “it’s not like that-” karube couldn’t even finish his sentence before arisu walked right past him, opening his apartment door and talking over him before closing the door disappearing. “it better not be”. harsh..
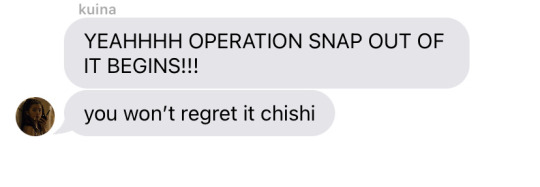
that very night arisu and kuina teamed up to make the relationship fail, hopefully..
— tell me why this chapter has so many time skips..oops. IM SO SORRY FOR TAKING SO LONG TO PUBLISH THIS😭,, I’ll make it up on Friday I SWEAR. for now pls take this very rushed, very bad worded chapter. I’ll bring Chishiya back soon i just need to make more scenes with karube for the sake of the plot </3 but I can assure you this isn’t a karube x reader so 🤭. I also probably failed my test today hahah, hopefully tumblr doesn’t mess up my post otherwise i will cry. ANYWAY goodnight guys, I have more exams coming up next week but I get review days during the week so <3
tags!! ,, tags!! ⸜(。˃ ᵕ ˂ )⸝!! | if highlighted pink, tag doesn’t work💔
@parkersmyth . @surshica . @spaceshattered-skies . @rainqissedd . @saltysoftgrungeofscience . @captivq . @vernon-dursley . @fishisahappydog . @trinmadol . @elernity . @naegisimp . @4vonly . @sincerely-raine . @yvrikoo . @sicksanji . @mxbrahms . @akowbt . @jadedist . @lov-eable . @sunooluver . @nijirosz . @eshtravagent . @brdpch . @kittyrai . @seiksyyki . @celery-o . @4townn . @shinobuily . @hy0ukka . @saiewithakatana . @theinfaethablefig . @huachengsbestie01 . @kokxm1 . @pedropascalkisser
#asalamis#aib chishiya#chishiya smau#chishiya x fem!reader#chishiya x reader#chishiya fluff#chishiya imagine#miomik#Spotify
136 notes
·
View notes
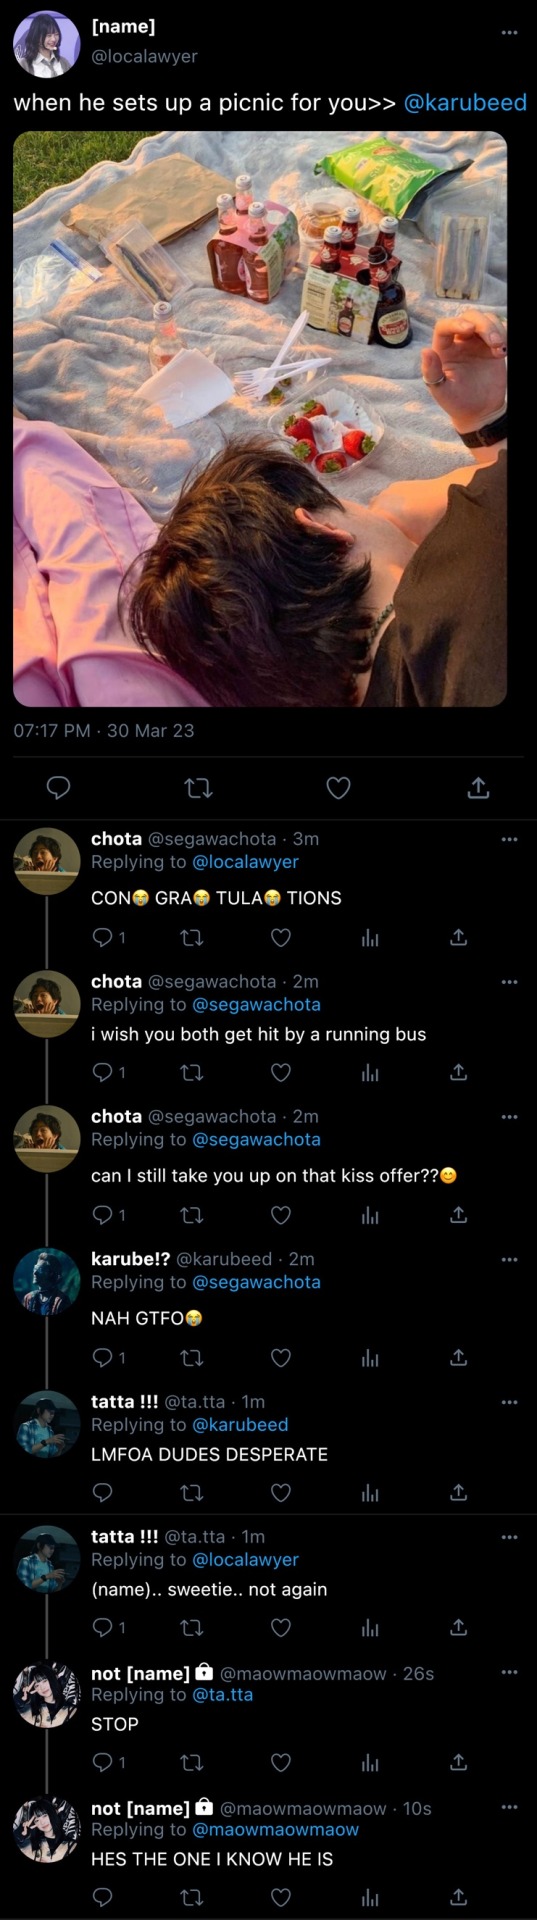
Text

vi. operation crash the date | snap out of it
kuina and arisu has arrived way too early to find a good spot where they could successfully eavesdrop your conversation. would you forgive them if you found out they were right behind a bush from where you and karube were sitting? no absolutely not, yet they would make sure you didn’t suspect a single thing. at least to their own accords. arisu had figured out that you and karube would be having some picnic date, not to mention the third date this week already..
even after multiple warnings arisu gave you, you didn’t care to listen and still clung to your feelings for karube. anyway, karube, being the first to arrive, set the whole place up. it looked way too romantic for just a “friends meet up” but not like kuina or arisu could do anything. after a little while of sitting there waiting for you to arrive arisu eventually spotted you walking towards the small set up date.
“i didn’t take you for a picnic date kind of guy” arisu could practically hear you screaming “pls date me” through your words, much to his disliking. “well, I have to do quite anything to please the girl I like no?” it was now kuinas turn to cringe at his words. “So you finally admit it” you looked up at him hopeful.
he couldn’t help but realize at his slip up, he only chuckled and nodded at your words. “You know, I’ve always admired you.” and truly he did, “ever since I met you, you always talked about what you wanted to do in the future, and even after having hard times, you never gave up on that dream of yours. it just amazes me, you’re an amazing person (name)..”
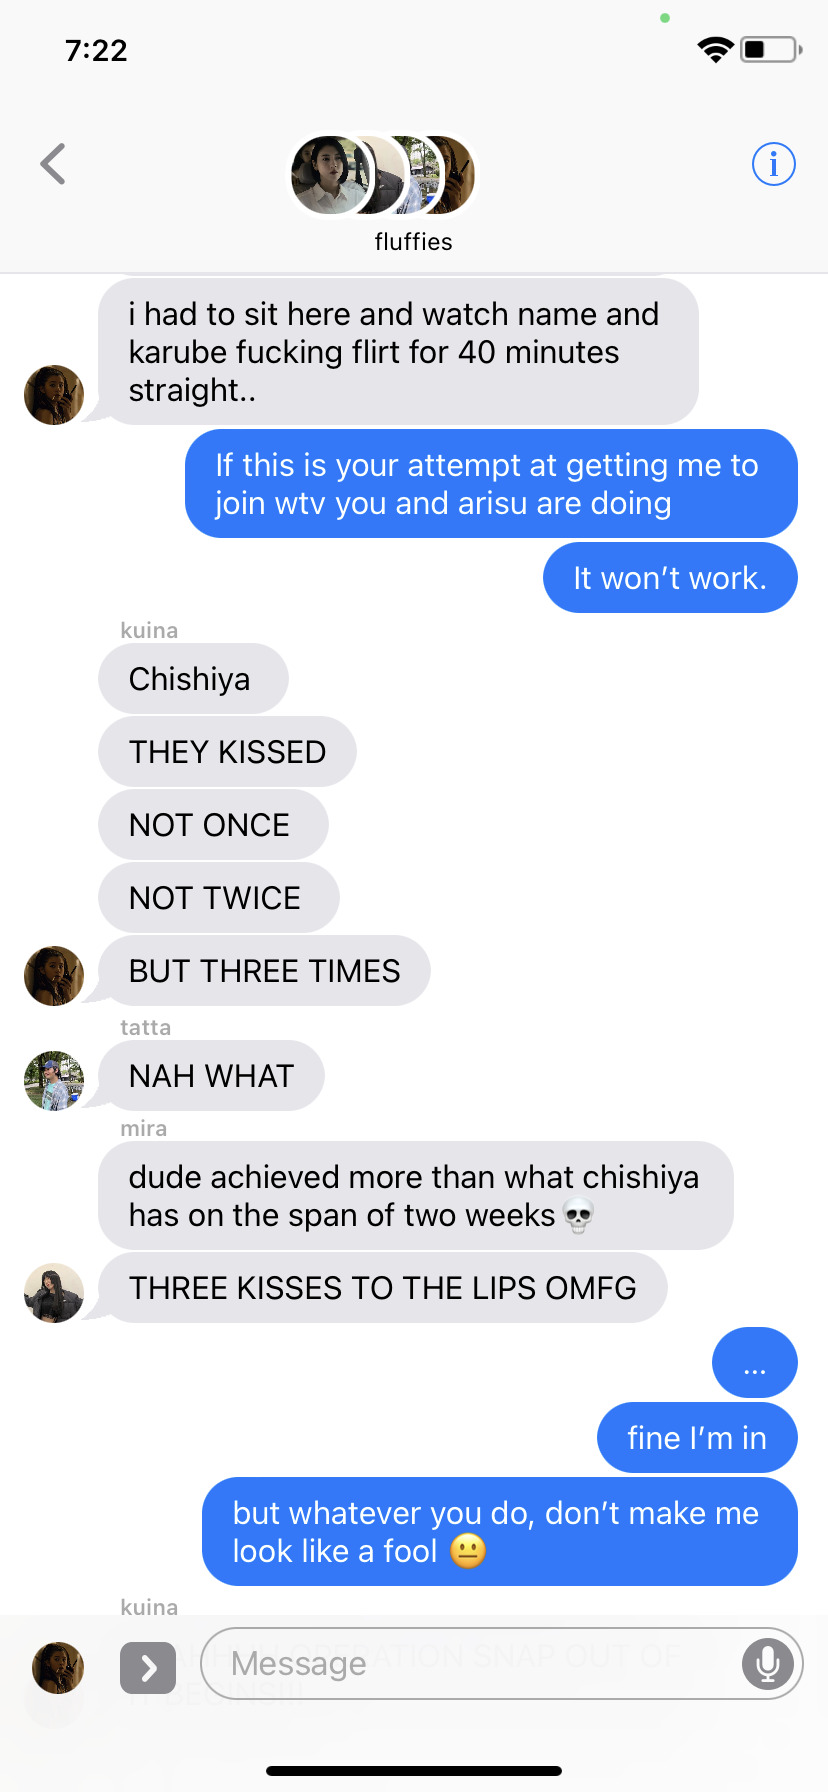
before you could open your mouth to say anything back he quickly changed the subject, he knew that if you were to talk he would only start stuttering “anyway, I bought these really good-” suddenly he could feel a pair of lips intertwined with his, and he knew exactly what it was. as much as he liked you he wanted to pull away and keep you from falling deeper than you already were, yet he couldn’t help it. karube placed his hands on both sides of your head and deepened the kiss.
as you pulled away to catch your breath you caught him staring right at you, had you ever noticed how pretty his eyes were?
a couple seconds later of staring you could feel yourself being pulled against his lips again. you were practically smiling through the kiss, maybe, just maybe this was finally your chance at a healthy, loving relationship. you truly wanted to believe that was the case, and you let yourself believe that.
though, what you didnt know was that your brother was being held back by your best friend right behind the tall bush right in front of you. as much as arisu wanted to crash the date, kuina prevented him from grabbing a hold of his blonde friend and punching him right across the face. as violent as that sounded he really would have done it.
“karube, i really do like you and i would love to be with you if you allowed me to..” you smiled towards him so lovingly, so sweet he couldn’t say no “(name).. Im not sure if I can start a relationship yet, and I don’t want to ask much from you but if you don’t mind, would you wait for me?” he took your hand in his and intertwined your fingers together. “I’ll wait for you, don’t worry

— MIO BACK FROM HIS BREAK???? I was being silly… IM SO SORRY FOR NOT UPDATING FOR I MONTH I think.. this chapter is pretty short and horrible but I really wanted to let you guys know I was alive and well!!!! I swear the next chapter is going to be A LOT better, I hope the tag list doesn’t mezzz >.<
tags!! ,, tags!! ⸜(。˃ ᵕ ˂ )⸝!! | if highlighted white, tag doesn’t work💔
@parkersmyth . @surshica . @spaceshattered-skies . @rainqissedd . @saltysoftgrungeofscience . @captivq . @vernon-dursley . @fishisahappydog . @trinmadol . @elernity . @naegisimp . @4vonly . @sincerely-raine . @yvrikoo . @sicksanji . @mxbrahms . @akowbt . @jadedist . @lov-eable . @sunooluver . @nijirosz . @eshtravagent . @brdpch . @kittyrai . @seiksyyki . @celery-o . @4townn . @shinobuily . @hy0ukka . @saiewithakatana . @theinfaethablefig . @huachengsbestie01 . @kokxm1 . @pedropascalkisser . @rssamj
#asalamis#aib chishiya#chishiya x fem!reader#chishiya x reader#chishiya fluff#chishiya imagine#chishiya smau#Spotify
43 notes
·
View notes
Last Seen Blogs

38sr
38sr | Art Blog

enderfenderdragon
EnderDragon

groovypursebailiffbonk-blog
Sem título

adelajonly
無標題

dinini-s
Dinini