#codeprofiling
Explore tagged Tumblr posts
Visit Tumblr Blog
Explore Tumblr blogs with no restrictions, modern design and the best experience.
Last Seen Tumblr Blogs


Fun Fact
Tumblr.com is the 103rd most visited website in the world.
Text
CodeProfiles
There’s still time to see this work at the Whitney; the excellent “Programmed” show is up though 4/14. The following post is from Dec...
W. Bradford Paley's CodeProfiles, currently on display at the Whitney's Programmed show, displays and engages with its own code. While the Programmed show, curated by Christiane Paul, connects the step-by-step instructional nature of digital art with the instructions of Conceptual Art, Paley's work is the one which is most explicitly Code Art, in that to view the piece is to see its code, and reading the code directly adds to the understanding of the work.
Paley's piece is a kind of self-performing code; individual lines of code light up the more they're executed, and three points move across it, each tracing their individual narratives through the code. One marks the writing the code, another how someone might read it, and the third how the machine executes it: we see them not just as "points" but ghostly lines and swirls, connections drawn back and forth, across the two-dimensional display of code. Those who can read Java may get more out of what is happening, but the piece is visually interesting enough for the uninitiated to get a sense of how these emanations mark time.
New Yorker Paley, born 1958, describes himself as a cognitive engineer, toolmaker, and educator, and has been coding computer graphics since 1973. His previous work was in information visualization, such as Relationships among Scientific Paradigms (viewable on his site) which sorts 800,000 scientific categories into 776 scientific paradigms, discovering relationships through citations, in a large visual space.
Paley made CodeProfiles for the Whitney's epochal 2002 online CODeDOC show, responding to a call for work from curator Christiane Paul "to write code that moves three points in space." Used to working with enormous data sets, he found limiting himself to just three points a challenge:
A month before the show I flashed on the idea that the source code itself could be the space, and it immediately followed from Christiane's goals that the three points should be the fixation point of someone reading the code, the execution point of the computer running it, and my own insertion point as I wrote it.
Read More...
6 notes
·
View notes
Text
W. Bradford Paley (NYC TRIP)
Yesterday, Cornell University arranged for its art students to visit the MOMA PS1 and Whitney Museum in Long Island City and Manhatten. Our trip to PS1 MOMA was intended to teach us that there is more to just the “art making” part of museums. Behind each piece, installation, and performance is an exhibit organizer and curator who work in conjunction to arrange how the art is viewed; which is just as important as the artist who creates the pieces.
Afterward, we traveled to the Whitney where two new exhibits were opened: Andy Warhol - FROM A TO B AND BACK AGAIN and PROGRAMMED: RULES, CODES, AND CHOREOGRAPHIES IN ART, 1965-2018. I absolutely loved the PROGRAMMED exhibition. The name comes from the fact that the exhibit was focused on programmed art by computer code. From the Whitney Museum’s website:
“The exhibition links two strands of artistic exploration: the first examines the program as instructions, rules, and algorithms with a focus on conceptual art practices and their emphasis on ideas as the driving force behind the art; the second strand engages with the use of instructions and algorithms to manipulate the TV program, its apparatus, and signals or image sequences.”
As someone who participated in my high school's robotics team and has an interest in computer science such as Python and C++, I have always dreamed of such an exhibit. They are rare and I am happy museums are finally recognizing how technology is, directly and indirectly, influencing the creation of art.
An artist I was particularly interested in was W. Bradford Paley. As an associate professor at Columbia University, he studied computer graphics at UC Berkeley in 1981 and founded Digital Image Design Incorporated. His work and art practices focus primarily on making complex code and date easier to understand by those who are not familiar with CS. He does this by making visual displays that actively engage the viewer. This new form of digital art can be seen as a form of abstraction for someone who doesn’t understand- a commentary on how the population is emersed in a digital world they know nothing about.
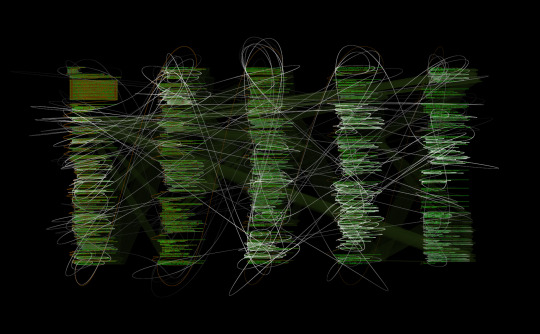
A piece of his that interested me was CodeProfiles, Java Program. CodeProfiles looks at the computer program as text and visually comments on how code is ready by people, written by programmers, and executed by computers. Reflecting on its own construction, the work consists of the code that makes the code visible on the screen. Paley makes three points visible with an amber, white, and green line.
Amber line: follows the fixation point (tracing how people might read the text)
White line: follows the insertion point (flows like programmers thoughts)
Green line: moves along the execution point (creating swarths where the code was executed)
By doing this, Paley visualizes the program that runs behind most digital art- driven by a language formulating instructions.


I plan on revisiting this exhibit with my family so they can also enjoy the new wave of digital art.
Thank you Cornell,
0 notes