#how to drop database in sql server
Explore tagged Tumblr posts
Visit Tumblr Blog
Explore Tumblr blogs with no restrictions, modern design and the best experience.
Last Seen Tumblr Blogs


Fun Fact
Users from the US are the majority of Tumblr visitors.
Text
How to Safely Drop a Database in SQL Server
Step-by-step guide on how to drop a database in SQL Server. Learn the necessary commands, precautions, and best practices to ensure data safety and integrity during the process.
0 notes
Text
Why Tableau is Essential in Data Science: Transforming Raw Data into Insights

Data science is all about turning raw data into valuable insights. But numbers and statistics alone don’t tell the full story—they need to be visualized to make sense. That’s where Tableau comes in.
Tableau is a powerful tool that helps data scientists, analysts, and businesses see and understand data better. It simplifies complex datasets, making them interactive and easy to interpret. But with so many tools available, why is Tableau a must-have for data science? Let’s explore.
1. The Importance of Data Visualization in Data Science
Imagine you’re working with millions of data points from customer purchases, social media interactions, or financial transactions. Analyzing raw numbers manually would be overwhelming.
That’s why visualization is crucial in data science:
Identifies trends and patterns – Instead of sifting through spreadsheets, you can quickly spot trends in a visual format.
Makes complex data understandable – Graphs, heatmaps, and dashboards simplify the interpretation of large datasets.
Enhances decision-making – Stakeholders can easily grasp insights and make data-driven decisions faster.
Saves time and effort – Instead of writing lengthy reports, an interactive dashboard tells the story in seconds.
Without tools like Tableau, data science would be limited to experts who can code and run statistical models. With Tableau, insights become accessible to everyone—from data scientists to business executives.
2. Why Tableau Stands Out in Data Science
A. User-Friendly and Requires No Coding
One of the biggest advantages of Tableau is its drag-and-drop interface. Unlike Python or R, which require programming skills, Tableau allows users to create visualizations without writing a single line of code.
Even if you’re a beginner, you can:
✅ Upload data from multiple sources
✅ Create interactive dashboards in minutes
✅ Share insights with teams easily
This no-code approach makes Tableau ideal for both technical and non-technical professionals in data science.
B. Handles Large Datasets Efficiently
Data scientists often work with massive datasets—whether it’s financial transactions, customer behavior, or healthcare records. Traditional tools like Excel struggle with large volumes of data.
Tableau, on the other hand:
Can process millions of rows without slowing down
Optimizes performance using advanced data engine technology
Supports real-time data streaming for up-to-date analysis
This makes it a go-to tool for businesses that need fast, data-driven insights.
C. Connects with Multiple Data Sources
A major challenge in data science is bringing together data from different platforms. Tableau seamlessly integrates with a variety of sources, including:
Databases: MySQL, PostgreSQL, Microsoft SQL Server
Cloud platforms: AWS, Google BigQuery, Snowflake
Spreadsheets and APIs: Excel, Google Sheets, web-based data sources
This flexibility allows data scientists to combine datasets from multiple sources without needing complex SQL queries or scripts.
D. Real-Time Data Analysis
Industries like finance, healthcare, and e-commerce rely on real-time data to make quick decisions. Tableau’s live data connection allows users to:
Track stock market trends as they happen
Monitor website traffic and customer interactions in real time
Detect fraudulent transactions instantly
Instead of waiting for reports to be generated manually, Tableau delivers insights as events unfold.
E. Advanced Analytics Without Complexity
While Tableau is known for its visualizations, it also supports advanced analytics. You can:
Forecast trends based on historical data
Perform clustering and segmentation to identify patterns
Integrate with Python and R for machine learning and predictive modeling
This means data scientists can combine deep analytics with intuitive visualization, making Tableau a versatile tool.
3. How Tableau Helps Data Scientists in Real Life
Tableau has been adopted by the majority of industries to make data science more impactful and accessible. This is applied in the following real-life scenarios:
A. Analytics for Health Care
Tableau is deployed by hospitals and research institutions for the following purposes:
Monitor patient recovery rates and predict outbreaks of diseases
Analyze hospital occupancy and resource allocation
Identify trends in patient demographics and treatment results
B. Finance and Banking
Banks and investment firms rely on Tableau for the following purposes:
✅ Detect fraud by analyzing transaction patterns
✅ Track stock market fluctuations and make informed investment decisions
✅ Assess credit risk and loan performance
C. Marketing and Customer Insights
Companies use Tableau to:
✅ Track customer buying behavior and personalize recommendations
✅ Analyze social media engagement and campaign effectiveness
✅ Optimize ad spend by identifying high-performing channels
D. Retail and Supply Chain Management
Retailers leverage Tableau to:
✅ Forecast product demand and adjust inventory levels
✅ Identify regional sales trends and adjust marketing strategies
✅ Optimize supply chain logistics and reduce delivery delays
These applications show why Tableau is a must-have for data-driven decision-making.
4. Tableau vs. Other Data Visualization Tools
There are many visualization tools available, but Tableau consistently ranks as one of the best. Here’s why:
Tableau vs. Excel – Excel struggles with big data and lacks interactivity; Tableau handles large datasets effortlessly.
Tableau vs. Power BI – Power BI is great for Microsoft users, but Tableau offers more flexibility across different data sources.
Tableau vs. Python (Matplotlib, Seaborn) – Python libraries require coding skills, while Tableau simplifies visualization for all users.
This makes Tableau the go-to tool for both beginners and experienced professionals in data science.
5. Conclusion
Tableau has become an essential tool in data science because it simplifies data visualization, handles large datasets, and integrates seamlessly with various data sources. It enables professionals to analyze, interpret, and present data interactively, making insights accessible to everyone—from data scientists to business leaders.
If you’re looking to build a strong foundation in data science, learning Tableau is a smart career move. Many data science courses now include Tableau as a key skill, as companies increasingly demand professionals who can transform raw data into meaningful insights.
In a world where data is the driving force behind decision-making, Tableau ensures that the insights you uncover are not just accurate—but also clear, impactful, and easy to act upon.
#data science course#top data science course online#top data science institute online#artificial intelligence course#deepseek#tableau
3 notes
·
View notes
Text
Cross-Mapping Tableau Prep Workflows into Power Query: A Developer’s Blueprint
When migrating from Tableau to Power BI, one of the most technically nuanced challenges is translating Tableau Prep workflows into Power Query in Power BI. Both tools are built for data shaping and preparation, but they differ significantly in structure, functionality, and logic execution. For developers and BI engineers, mastering this cross-mapping process is essential to preserve the integrity of ETL pipelines during the migration. This blog offers a developer-centric blueprint to help you navigate this transition with clarity and precision.
Understanding the Core Differences
At a foundational level, Tableau Prep focuses on a flow-based, visual paradigm where data steps are connected in a linear or branching path. Power Query, meanwhile, operates in a functional, stepwise M code environment. While both support similar operations—joins, filters, aggregations, data type conversions—the implementation logic varies.
In Tableau Prep:
Actions are visual and sequential (Clean, Join, Output).
Operations are visually displayed in a flow pane.
Users rely heavily on drag-and-drop transformations.
In Power Query:
Transformations are recorded as a series of applied steps using the M language.
Logic is encapsulated within functional scripts.
The interface supports formula-based flexibility.
Step-by-Step Mapping Blueprint
Here’s how developers can strategically cross-map common Tableau Prep components into Power Query steps:
1. Data Input Sources
Tableau Prep: Uses connectors or extracts to pull from databases, Excel, or flat files.
Power Query Equivalent: Use “Get Data” with the appropriate connector (SQL Server, Excel, Web, etc.) and configure using the Navigator pane.
✅ Developer Tip: Ensure all parameters and credentials are migrated securely to avoid broken connections during refresh.
2. Cleaning and Shaping Data
Tableau Prep Actions: Rename fields, remove nulls, change types, etc.
Power Query Steps: Use commands like Table.RenameColumns, Table.SelectRows, and Table.TransformColumnTypes.
✅ Example: Tableau Prep’s “Change Data Type” ↪ Power Query:
mCopy
Edit
Table.TransformColumnTypes(Source,{{"Date", type date}})
3. Joins and Unions
Tableau Prep: Visual Join nodes with configurations (Inner, Left, Right).
Power Query: Use Table.Join or the Merge Queries feature.
✅ Equivalent Code Snippet:
mCopy
Edit
Table.NestedJoin(TableA, {"ID"}, TableB, {"ID"}, "NewColumn", JoinKind.Inner)
4. Calculated Fields / Derived Columns
Tableau Prep: Create Calculated Fields using simple functions or logic.
Power Query: Use “Add Column” > “Custom Column” and M code logic.
✅ Tableau Formula Example: IF [Sales] > 100 THEN "High" ELSE "Low" ↪ Power Query:
mCopy
Edit
if [Sales] > 100 then "High" else "Low"
5. Output to Destination
Tableau Prep: Output to .hyper, Tableau Server, or file.
Power BI: Load to Power BI Data Model or export via Power Query Editor to Excel or CSV.
✅ Developer Note: In Power BI, outputs are loaded to the model; no need for manual exports unless specified.
Best Practices for Developers
Modularize: Break complex Prep flows into multiple Power Query queries to enhance maintainability.
Comment Your Code: Use // to annotate M code for easier debugging and team collaboration.
Use Parameters: Replace hardcoded values with Power BI parameters to improve reusability.
Optimize for Performance: Apply filters early in Power Query to reduce data volume.
Final Thoughts
Migrating from Tableau Prep to Power Query isn’t just a copy-paste process—it requires thoughtful mapping and a clear understanding of both platforms’ paradigms. With this blueprint, developers can preserve logic, reduce data preparation errors, and ensure consistency across systems. Embrace this cross-mapping journey as an opportunity to streamline and modernize your BI workflows.
For more hands-on migration strategies, tools, and support, explore our insights at https://tableautopowerbimigration.com – powered by OfficeSolution.
0 notes
Text
What’s the function of Tableau Prep?
Tableau Prep is a data preparation tool from Tableau that helps users clean, shape, and organize data before it is analyzed or visualized. It is especially useful for data analysts and business intelligence professionals who need to prepare data quickly and efficiently without writing complex code.
The core function of Tableau Prep is to simplify the data preparation process through an intuitive, visual interface. Users can drag and drop datasets, apply filters, rename fields, split or combine columns, handle null values, pivot data, and even join or union multiple data sources. These actions are displayed in a clear, step-by-step workflow, which makes it easy to understand how data is transformed at each stage.
Tableau Prep includes two main components: Prep Builder, used to create and edit data preparation workflows, and Prep Conductor, which automates the running of flows and integrates with Tableau Server or Tableau Cloud for scheduled data refreshes. This automation is a major advantage, especially in dynamic environments where data updates regularly.
Another significant benefit is real-time previews. As users manipulate data, they can instantly see the effects of their actions, allowing for better decisions and error checking. It supports connections to various data sources such as Excel, SQL databases, and cloud platforms like Google BigQuery or Amazon Redshift.
Tableau Prep’s seamless integration with Tableau Desktop means that once data is prepped, it can be directly pushed into visualization dashboards without exporting and re-importing files.
In short, Tableau Prep helps streamline the otherwise time-consuming process of cleaning and preparing data, making it more accessible to analysts without deep programming knowledge.
If you’re looking to master tools like Tableau Prep and enter the analytics field, consider enrolling in a data analyst course with placement for hands-on training and career support.
0 notes
Text
Top 5 Tools for Salesforce Data Migration in 2025

Data migration is a critical aspect of any Salesforce implementation or upgrade. Whether you’re transitioning from legacy systems, merging Salesforce orgs, or simply updating your current Salesforce instance, choosing the right tool can make or break the success of your migration. In 2025, the landscape of Salesforce data migration tools has evolved significantly, offering more automation, better user interfaces, and improved compatibility with complex datasets.
If you're a business looking to ensure a smooth migration process, working with an experienced Salesforce consultant in New York can help you identify the best tools and practices. Here's a detailed look at the top five Salesforce data migration tools in 2025 and how they can help your organization move data efficiently and accurately.
1. Salesforce Data Loader (Enhanced 2025 Edition)
Overview: The Salesforce Data Loader remains one of the most popular tools, especially for companies looking for a free, secure, and reliable way to manage data migration. The 2025 edition comes with a modernized UI, faster processing speeds, and enhanced error logging.
Why It’s Top in 2025:
Improved speed and performance
Enhanced error tracking and data validation
Seamless integration with external databases like Oracle, SQL Server, and PostgreSQL
Support for larger datasets (up to 10 million records)
Best For: Organizations with experienced admins or developers who are comfortable working with CSV files and need a high level of control over their data migration process.
Pro Tip: Engage a Salesforce developer in New York to write custom scripts for automating the loading and extraction processes. This will save significant time during large migrations.
2. Skyvia
Overview: Skyvia has emerged as a go-to cloud-based data integration tool that simplifies Salesforce data migration, especially for non-technical users. With drag-and-drop functionality and pre-built templates, it supports integration between Salesforce and over 100 other platforms.
Why It’s Top in 2025:
No coding required
Advanced transformation capabilities
Real-time sync between Salesforce and other cloud applications
Enhanced data governance features
Best For: Mid-sized businesses and enterprises that need a user-friendly platform with robust functionality and real-time synchronization.
Use Case: A retail company integrating Shopify, Salesforce, and NetSuite found Skyvia especially helpful in maintaining consistent product and customer data across platforms.
Expert Advice: Work with a Salesforce consulting partner in New York to set up your data models and design a migration path that aligns with your business processes.
3. Jitterbit Harmony
Overview: Jitterbit Harmony is a powerful data integration platform that enables users to design, run, and manage integration workflows. In 2025, it remains a favorite for enterprises due to its AI-powered suggestions and robust performance in complex scenarios.
Why It’s Top in 2025:
AI-enhanced mapping and transformation logic
Native Salesforce connector with bulk API support
Real-time data flow monitoring and alerts
Cross-platform compatibility (on-premise to cloud, cloud to cloud)
Best For: Large enterprises and organizations with complex IT ecosystems requiring high-throughput data migration and real-time integrations.
Tip from the Field: A Salesforce consulting firm in New York can help fine-tune your Jitterbit setup to ensure compliance with your industry regulations and data handling policies.
4. Informatica Cloud Data Wizard
Overview: Informatica is well-known in the enterprise data integration space. The Cloud Data Wizard is a lightweight, Salesforce-focused tool designed for business users. In 2025, its intuitive interface and automated field mapping make it a favorite for quick and simple migrations.
Why It’s Top in 2025:
Automatic schema detection and mapping
Pre-built Salesforce templates
Role-based access control for secure collaboration
Integration with Salesforce Flow for process automation
Best For: Companies needing quick, on-the-fly migrations with minimal IT involvement.
Case in Point: A nonprofit organization used Informatica Cloud Data Wizard for migrating donor information from spreadsheets into Salesforce Nonprofit Success Pack (NPSP) with minimal technical assistance.
Pro Insight: Partner with a Salesforce consultant in New York to evaluate whether the Cloud Data Wizard meets your scalability and security needs before committing.
5. Talend Data Fabric
Overview: Talend Data Fabric combines data integration, quality, and governance in one unified platform. In 2025, it leads the way in enterprise-grade data migration for Salesforce users who require deep customization, high security, and data lineage tracking.
Why It’s Top in 2025:
Full data quality and compliance toolset
AI-driven suggestions for data cleaning and transformation
End-to-end data lineage tracking
Integration with AWS, Azure, and Google Cloud
Best For: Industries with strict compliance needs like finance, healthcare, or government, where data accuracy and traceability are paramount.
Strategic Advantage: A Salesforce consulting partner in New York can help configure Talend’s governance tools to align with HIPAA, GDPR, or other regulatory requirements.
Why Choosing the Right Tool Matters
Data migration is more than just moving records from one system to another—it’s about preserving the integrity, security, and usability of your data. Choosing the right tool ensures:
Fewer errors and data loss
Faster deployment timelines
Higher end-user adoption
Better alignment with business goals
Partnering with Salesforce Experts in New York
Working with an experienced Salesforce consultant in New York can help you navigate the complexities of data migration. Local consultants understand both the technical and business landscapes and can offer personalized support throughout the migration journey.
Whether you're a startup looking for lean, cost-effective solutions or a large enterprise needing advanced governance, engaging with Salesforce consultants in New York ensures you make the most informed decisions.
These professionals can:
Conduct data audits and mapping
Recommend the best tool for your specific use case
Build custom scripts or integrations as needed
Ensure a smooth transition with minimal business disruption
Final Thoughts
In 2025, Salesforce data migration is no longer a cumbersome, manual task. With tools like Salesforce Data Loader, Skyvia, Jitterbit, Informatica, and Talend, businesses of all sizes can achieve fast, secure, and seamless migrations. The key lies in selecting the right tool based on your business size, technical capacity, and compliance needs.
Moreover, partnering with a knowledgeable Salesforce consulting partner in New York gives you access to tailored solutions and hands-on support, making your data migration journey smooth and successful.
Ready to migrate your data the right way? Consult with a trusted Salesforce consulting in New York expert and empower your business to scale with confidence.
#salesforce consultant in new york#salesforce consulting in new york#salesforce consulting partner in new york#salesforce consultants in new york#salesforce developer in new york#Top 5 Tools for Salesforce Data Migration in 2025
0 notes
Text
Unlock Data-Driven Success with Tableau Services

In today’s fast-paced business world, data is power. But raw numbers alone aren’t enough—companies need tools to turn data into clear, actionable insights. That’s where Tableau Services shine.
As a leading business intelligence platform (part of Salesforce), Tableau offers tools and support to help organizations visualize, analyze, and share data effortlessly. Let’s explore how Tableau Services can transform your business.
What Are Tableau Services?
Tableau Services include software, training, and expert support designed to simplify data management. Key tools include:
Tableau Desktop: Build interactive dashboards.
Tableau Cloud/Server: Share insights securely online or on-premises.
Tableau Prep: Clean and organize data quickly.
Paired with training courses, certifications, and 24/7 support, these services empower teams at all skill levels to make smarter decisions.
Top Benefits of Tableau Services
1. Easy Data VisualizationTableau’s drag-and-drop interface lets anyone create charts, graphs, and maps—no coding needed. For example, a retailer can track sales trends across regions in minutes using colorful dashboards.
2. Works for EveryoneWhether you’re a data expert or a beginner, Tableau adapts to your skills. Non-technical users can build reports, while analysts use SQL or Python for deeper dives.
3. Real-Time InsightsMonitor live data to act fast. A logistics company could track deliveries or inventory levels in real time, adjusting routes to save costs.
4. Connect Any Data SourceTableau links to spreadsheets, databases (like Google BigQuery), and apps (like Salesforce). Combine all your data into one dashboard for a unified view.
5. Team CollaborationShare dashboards securely with teams or clients. Marketing teams, for instance, can update executives on campaign performance instantly.
6. Grows with Your BusinessFrom startups to global firms, Tableau scales smoothly. Start with a single license and expand to enterprise-level solutions as needed.
7. Advanced AnalyticsPredict trends, like future customer demand, using AI-driven tools. Healthcare providers can forecast patient needs to improve care.
8. Save Time and MoneyAutomate data tasks to reduce manual work. Cloud options cut IT costs, letting small businesses focus on growth.
9. Top-Notch SecurityProtect sensitive data with features like role-based access and encryption—ideal for finance or healthcare industries.
10. Learn and ImproveAccess free courses, certifications, and a global user community. Get expert help to tailor Tableau to your goals.
Who Uses Tableau Services?
Retail: Optimize pricing using sales and customer data.
Healthcare: Improve patient care with treatment analytics.
Finance: Detect fraud and manage risk securely.
Education: Track student performance to allocate resources better.
Why Choose Tableau?
User-Friendly: Designed for all skill levels.
Trusted: Backed by Salesforce and used by over 1 million teams worldwide.
Flexible: Cloud, desktop, or server options fit any need.
How to Get Started
Free Trial: Test Tableau Cloud or Desktop on their website.
Plans: Choose subscriptions based on your team size.
Support: Partner with consultants for setup and training.
Final Thoughts
Tableau Services turn complex data into clear insights, helping businesses act faster, save costs, and stay competitive. Whether you’re analyzing sales trends or improving patient care, Tableau’s tools make data work for you.
Ready to unlock your data’s potential? Explore Tableau’s official website today—or try a free trial to see the difference yourself!
0 notes
Text
DOKANS Nulled Script 3.9.2

Unlock E-commerce Potential with DOKANS Nulled Script Are you ready to transform your online business into a fully functional multitenant e-commerce platform without spending a fortune? DOKANS Nulled Script offers an unbeatable opportunity to create a scalable, efficient, and dynamic online marketplace—absolutely free. Whether you're a budding entrepreneur or an established developer, this powerful script provides the backbone for launching your own SaaS-based multi-vendor store in no time. What Is DOKANS Nulled Script? DOKANS Nulled Script is a premium multitenancy-based e-commerce platform designed specifically for creating software-as-a-service (SaaS) marketplaces. It allows users to build independent stores under a single ecosystem, offering flexibility, scalability, and seamless customization. With this nulled version, you can enjoy all the premium features without the hefty price tag, making it ideal for developers, resellers, and digital entrepreneurs. Technical Specifications Framework: Laravel (Backend) + Vue.js (Frontend) Database: MySQL/MariaDB Server Requirements: PHP 7.4 or higher, Apache/Nginx Multitenancy: Built-in SaaS capabilities Security: Advanced user authentication and permission systems Outstanding Features and Benefits When you download the DOKANS Nulled Script, you gain access to a powerhouse of tools tailored for modern e-commerce: 1. Multitenancy Support Let your users create and manage their own e-commerce stores under a unified platform. Each store operates independently with its own admin panel and branding. 2. Drag-and-Drop Page Builder Design custom pages effortlessly with an intuitive page builder. No coding knowledge required! 3. Flexible Subscription System Create revenue streams by offering tiered subscription plans to vendors. Manage upgrades, renewals, and custom packages with ease. 4. Secure and Optimized Enjoy enterprise-level security measures, regular updates, and optimized performance to handle growing traffic and vendors without lag. 5. Rich Admin Dashboard Access detailed analytics, financial reports, and vendor performance metrics from a beautifully designed admin panel. Practical Use Cases Launch a digital marketplace for fashion, electronics, or niche products Offer SaaS-based storefronts to clients and freelancers Create white-label solutions for local businesses and communities Monetize by charging store owners subscription fees or commissions How to Install DOKANS Nulled Script Download the latest version of DOKANS Nulled Script from our website. Extract the files to your server's root directory. Set up the database and import the SQL file provided. Edit the .env file with your database and app credentials. Run the necessary Laravel commands: composer install, php artisan migrate, and php artisan serve. Access the admin panel and begin configuring your multi-vendor platform. FAQs – Your Questions Answered Is DOKANS Nulled Script safe to use? Yes, the nulled script is thoroughly tested and secure for usage. However, always use a trusted source—like our website—for downloads to avoid hidden malware or vulnerabilities. Can I use this script for commercial purposes? Absolutely. With DOKANS Nulled Script, you can launch your commercial marketplace, monetize it with subscriptions, and offer clients fully functional e-commerce solutions. Do I need to know coding to use this? No coding skills are required for basic usage. The platform is beginner-friendly with intuitive interfaces. Advanced users can easily customize the backend thanks to its Laravel-Vue architecture. Where can I find compatible plugins or themes? You can enhance your site with additional tools like elementor nulled pro for intuitive design customization. Is there support or a user community? While nulled versions don’t offer official support, you can find active user communities and tutorials online. Plus, our platform is always here to help with guides and updates. Final Thoughts If
you're looking for a high-performance SaaS e-commerce script without the high cost, DOKANS Nulled Script is the answer. It's packed with features, easy to use, and completely free—giving you the ultimate edge in launching your own online marketplace today. Don't miss out on this game-changing opportunity to build and scale your digital empire. Want to enhance your site even further? Try out Slider Revolution NULLED and unlock limitless design possibilities!
0 notes
Text
Batch Address Validation Tool and Bulk Address Verification Software
When businesses manage thousands—or millions—of addresses, validating each one manually is impractical. That’s where batch address validation tools and bulk address verification software come into play. These solutions streamline address cleansing by processing large datasets efficiently and accurately.

What Is Batch Address Validation?
Batch address validation refers to the automated process of validating multiple addresses in a single operation. It typically involves uploading a file (CSV, Excel, or database) containing addresses, which the software then checks, corrects, formats, and appends with geolocation or delivery metadata.
Who Needs Bulk Address Verification?
Any organization managing high volumes of contact data can benefit, including:
Ecommerce retailers shipping to customers worldwide.
Financial institutions verifying client data.
Healthcare providers maintaining accurate patient records.
Government agencies validating census or mailing records.
Marketing agencies cleaning up lists for campaigns.
Key Benefits of Bulk Address Verification Software
1. Improved Deliverability
Clean data ensures your packages, documents, and marketing mailers reach the right person at the right location.
2. Cost Efficiency
Avoiding undeliverable mail means reduced waste in printing, postage, and customer service follow-up.
3. Database Accuracy
Maintaining accurate addresses in your CRM, ERP, or mailing list helps improve segmentation and customer engagement.
4. Time Savings
What would take weeks manually can now be done in minutes or hours with bulk processing tools.
5. Regulatory Compliance
Meet legal and industry data standards more easily with clean, validated address data.
Features to Expect from a Batch Address Validation Tool
When evaluating providers, check for the following capabilities:
Large File Upload Support: Ability to handle millions of records.
Address Standardization: Correcting misspellings, filling in missing components, and formatting according to regional norms.
Geocoding Integration: Assigning latitude and longitude to each validated address.
Duplicate Detection & Merging: Identifying and consolidating redundant entries.
Reporting and Audit Trails: For compliance and quality assurance.
Popular Batch Address Verification Tools
Here are leading tools in 2025:
1. Melissa Global Address Verification
Features: Supports batch and real-time validation, international formatting, and geocoding.
Integration: Works with Excel, SQL Server, and Salesforce.
2. Loqate Bulk Cleanse
Strengths: Excel-friendly UI, supports uploads via drag-and-drop, and instant insights.
Ideal For: Businesses looking to clean customer databases or mailing lists quickly.
3. Smarty Bulk Address Validation
Highlights: Fast processing, intuitive dashboard, and competitive pricing.
Free Tier: Great for small businesses or pilot projects.
4. Experian Bulk Address Verification
Capabilities: Cleans large datasets with regional postal expertise.
Notable Use Case: Utility companies and financial services.
5. Data Ladder’s DataMatch Enterprise
Advanced Matching: Beyond address validation, it detects data anomalies and fuzzy matches.
Use Case: Enterprise-grade data cleansing for mergers or CRM migrations.
How to Use Bulk Address Verification Software
Using batch tools is typically simple and follows this flow:
Upload Your File: Use CSV, Excel, or database export.
Map Fields: Match your columns with the tool’s required address fields.
Validate & Clean: The software standardizes, verifies, and corrects addresses.
Download Results: Export a clean file with enriched metadata (ZIP+4, geocode, etc.)
Import Back: Upload your clean list into your CRM or ERP system.
Integration Options for Bulk Address Validation
Many vendors offer APIs or direct plugins for:
Salesforce
Microsoft Dynamics
HubSpot
Oracle and SAP
Google Sheets
MySQL / PostgreSQL / SQL Server
Whether you're cleaning one-time datasets or automating ongoing data ingestion, integration capabilities matter.
SEO Use Cases: Why Batch Address Tools Help Digital Businesses
In the context of SEO and digital marketing, bulk address validation plays a key role:
Improved Local SEO Accuracy: Accurate NAP (Name, Address, Phone) data ensures consistent local listings and better visibility.
Better Audience Segmentation: Clean data supports targeted, geo-focused marketing.
Lower Email Bounce Rates: Often tied to postal address quality in cross-channel databases.
Final Thoughts
Batch address validation tools and bulk verification software are essential for cleaning and maintaining large datasets. These platforms save time, cut costs, and improve delivery accuracy—making them indispensable for logistics, ecommerce, and CRM management.
Key Takeaways
Use international address validation to expand globally without delivery errors.
Choose batch tools to clean large datasets in one go.
Prioritize features like postal certification, coverage, geocoding, and compliance.
Integrate with your business tools for automated, real-time validation.
Whether you're validating a single international address or millions in a database, the right tools empower your operations and increase your brand's reliability across borders.
youtube
SITES WE SUPPORT
Validate Address With API – Wix
0 notes
Text
How We Improved Site Speed for a Client's PHP Website
When a client approached us with concerns about their website's loading speed and inconsistent performance, we recognized this as a challenge common among businesses with legacy PHP applications. Site speed plays a critical role in user experience, SEO rankings, and overall digital success. Slow performance can directly impact bounce rates and conversions, which is why PHP development companies must prioritize speed optimization in every project.
In this case study, we’ll walk through the methods we used to optimize a PHP-based website for better speed and performance.
Initial Assessment and Problem Identification
The first step was a full performance audit. Using tools like Google PageSpeed Insights, GTmetrix, and server logs, we uncovered several key issues:
Inefficient database queries
No caching mechanisms in place
Poorly optimized assets (JavaScript, CSS, and images)
High server response times
These issues are not uncommon for websites built a few years ago without ongoing optimization. Many PHP development companies in USA encounter such challenges, especially when websites evolve without scalable backend solutions.
Key Optimization Techniques We Applied
1. Optimizing Database Performance
The website’s dynamic content relied on complex and sometimes redundant SQL queries. We restructured these queries and added indexing where necessary. By reducing query execution time, we achieved noticeable backend performance gains.
2. Implementing Caching
To reduce load on the server and improve response time for repeat visitors, we enabled:
Opcode caching with OPcache
Object caching using Redis
Full-page caching for static and semi-dynamic content
Caching is one of the most effective ways for top PHP development companies in USA to immediately enhance site speed with minimal risk to core functionality.
3. Asset Optimization
We minified all CSS and JavaScript files, removed unused styles, and bundled them efficiently to reduce HTTP requests. Additionally, we enabled Gzip compression and browser caching via .htaccess to improve frontend performance.
4. Image and Media Optimization
Large image files were replaced with compressed versions in modern formats like WebP. We also implemented lazy loading to defer offscreen images from loading until they were needed.
5. Server Configuration Enhancements
Our team fine-tuned PHP-FPM and Apache configurations to ensure that the server handled traffic more efficiently. We increased memory limits, adjusted timeout settings, and introduced monitoring tools to keep track of resource usage.
Results Achieved
After deploying these improvements, the client experienced:
70% faster page load times
A 40% drop in bounce rate
Improved search engine visibility
A smoother and more responsive admin dashboard
These outcomes are a testament to what experienced PHP development companies can accomplish with the right blend of strategy, tools, and technical expertise.
Long-Term Strategy
Speed optimization isn’t a one-time fix. We helped the client set up automated performance reports and regular maintenance routines. This proactive approach ensures their website remains fast even as traffic increases or new features are introduced.
Final Thoughts
For businesses running PHP-based websites, performance optimization should be an ongoing priority. Whether you're maintaining a legacy application or building something new, partnering with professionals matters.
Our success in this project reflects the value that top PHP development companies in USA bring to the table. With hands-on experience, performance tuning capabilities, and scalable development practices, we help our clients stay competitive in the digital space.
If you're looking to enhance your website's performance, collaborating with trusted PHP development companies in USA can lead to transformative results.
0 notes
Text
6 Powerful Ways Power BI Transforms Your Business Operations
Let’s get straight to the point—Power BI’s top selling points are its robust features, intuitive design, and cost-effectiveness.
In today’s hyper-connected world, data is the new bacon—hot, in-demand, and irresistible! And why not? It drives customer behavior, shapes internal strategies, and helps business leaders make smart decisions.
But here's the catch: raw data alone isn’t valuable unless it’s well-structured, visualized, and actionable. That’s where Microsoft Power BI steps in, transforming your data chaos into clarity.

What is Power BI and Why Should You Care?
According to Microsoft, Power BI is a unified, scalable business intelligence (BI) platform that enables you to connect, model, and visualize any kind of data. It supports self-service BI, as well as enterprise-level analytics.
Power BI helps you gather, visualize, and analyze large volumes of business-critical data in a way that’s simple, engaging, and easy to digest. You can finally ditch those dull spreadsheets and lengthy reports and get everything you need—right on a single dashboard, through eye-catching graphs and interactive charts.
Power BI also shares a familiar interface with Microsoft Excel, so even non-tech-savvy users can jump in and start using it with minimal training. Plus, it integrates effortlessly with Microsoft 365 tools, cloud platforms, and external databases.
6 Ways Power BI Enhances Your Business Processes
Let’s break down how Power BI can elevate your operations, streamline decision-making, and maximize return on investment.
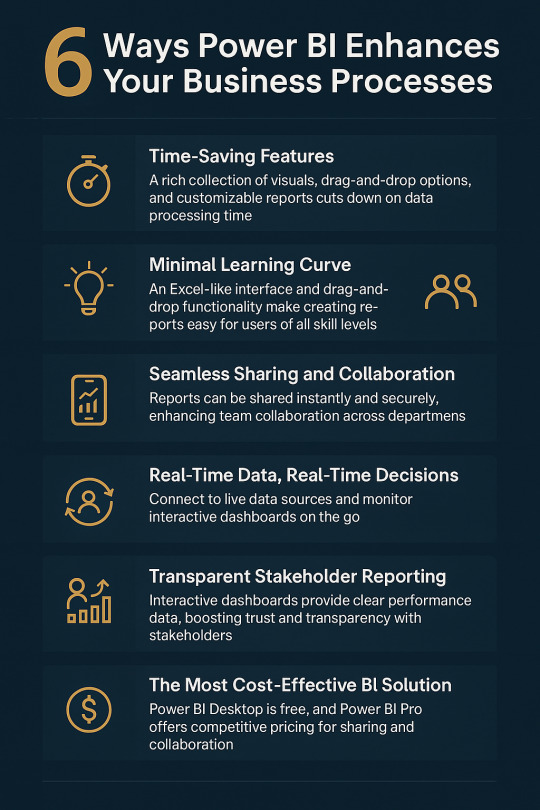
1. Time-Saving Features That Make a Big Difference
Power BI comes packed with a rich library of pre-built visuals, drag-and-drop elements, and highly customizable reports that significantly reduce the time spent on data processing.
Key time-saving features include:
Natural language queries: Ask questions like “What were sales last month?” and get instant charts.
Bookmarks, filters, and parameters: Personalize data stories based on your audience.
Zoom sliders: Easily navigate complex data.
DAX (Data Analysis Expressions): A powerful formula language for creating complex measures.
With Microsoft continuously adding updates, Power BI is always getting smarter.
2. Minimal Learning Curve
One of the biggest fears businesses have when adopting new software is the learning curve. But Power BI removes that barrier entirely.
Thanks to its Excel-like interface and drag-and-drop functionality, even first-time users can build impressive reports and dashboards. Your team doesn't need to be made up of data scientists—they just need a little curiosity and creativity.
For more advanced users, there’s support for:
M-Query for data transformation
DAX for advanced calculations
Python and SQL integration for deep-level analytics
Whether you’re a beginner or a pro, Power BI caters to all skill levels.
3. Seamless Sharing and Collaboration
Power BI takes team collaboration to the next level.
With Power BI Pro, users can:
Share reports instantly across departments
Embed dashboards into SharePoint, Teams, or your website
Schedule automatic report updates
Grant secure access to stakeholders and clients
Forget endless email chains and outdated attachments. With Power BI, everyone gets real-time access to the same data, keeping teams aligned and productive.
4. Real-Time Data, Real-Time Decisions
In a rapidly changing market, real-time insights can be a game-changer.
Power BI allows you to connect to live data sources—whether it's social media, SQL servers, CRM platforms, or cloud apps. By setting up an on-premises data gateway, your dashboards stay continuously updated.
You can even view interactive dashboards from your mobile device, so you’re never out of the loop—even on the go.
Example: Your support team can monitor live call logs to instantly spot and resolve customer wait-time issues.
That’s the power of timely decision-making.
5. Build Trust with Transparent Stakeholder Reporting
Let’s face it—no one likes long, text-heavy reports anymore.
Power BI enables you to present complex business performance data in an engaging, visual format that your stakeholders will love. From executives to investors, interactive dashboards help convey KPIs and results clearly and persuasively.
Reports can be accessed from any device at any time, building transparency and boosting stakeholder confidence.
And the best part? Updates are reflected automatically, ensuring they’re always seeing the most current data.
6. The Most Cost-Effective BI Solution on the Market
Cost plays a major role in decision-making, and Power BI truly stands out in this regard. Power BI Desktop is completely free—just download it and begin building interactive, data-rich reports right away.
For sharing and collaboration, Power BI Pro is available at just $9.99 per user per month. It allows you to publish dashboards on-premises and effortlessly share them with your team by simply sending a link.
Compared to other business intelligence tools, Power BI offers a highly competitive pricing model. When you factor in its powerful features and capabilities, it becomes clear that Power BI delivers exceptional value for your investment.
FAQs
1. Is Power BI suitable for beginners? Yes! With its Excel-like feel and drag-and-drop features, Power BI is designed for users at all levels.
2. How secure is Power BI for business data? Power BI uses Microsoft’s robust security protocols, including data encryption, role-based access, and compliance with GDPR.
3. Can I customize dashboards for different departments? Absolutely. Power BI lets you create department-specific views, filters, and dashboards based on the role or access level.
4. Does Power BI work offline? Power BI Desktop works offline for data modeling and report building. Online features like sharing and collaboration require internet access.
5. How often does Power BI get updates? Microsoft releases monthly feature updates, keeping the platform modern and user-friendly.
#power bi consulting services#generative ai#power bi solutions#data analytics#data analytics services#Power BI
0 notes
Text
Why Is My eCommerce Site Slow Even with Good Hosting?
Introduction
You’re paying for high-performance hosting, but your eCommerce site still loads slowly. Pages lag, product images crawl in, and your bounce rate is skyrocketing. Sound familiar?
Good hosting is only part of the performance puzzle. In this blog, we’ll explore why your eCommerce website development efforts might still result in a slow site — and exactly what you can do to fix it.
Common Reasons Your eCommerce Site Is Still Slow 1. Unoptimized Images Large image files are one of the top culprits of slow load times. Avoid uploading raw photos from DSLR or phone cameras. Use tools like TinyPNG or WebP formats to compress images without losing quality.
Tip: Use lazy loading for product images and carousels.
2. Too Many Third-Party Scripts Live chats, trackers, heatmaps, and plugins often add JavaScript bloat. Scripts from Facebook Pixel, Google Tag Manager, and review widgets can block rendering.
Tip: Load non-critical scripts asynchronously or defer them.
3. Heavy Themes or Builders Are you using a feature-heavy theme or drag-and-drop builder? Themes built for flexibility can be bloated. Shopify and WooCommerce themes with unnecessary animations or sliders slow everything down.
Tip: Use lightweight, performance-optimized themes (like Dawn for Shopify or Astra for WooCommerce).
4. Inefficient Code or Customizations Custom code by freelancers or agencies might not be optimized. Loops, queries, or AJAX calls in product pages could slow down your site.
Tip: Audit your codebase regularly or use tools like GTmetrix and PageSpeed Insights to find bottlenecks.
5. Uncached Dynamic Content Even with good hosting, uncached pages can cause lags. Product pages, category filters, and carts are often dynamically generated.
Tip: Use page caching (e.g., Varnish, WP Rocket) and CDN edge caching (Cloudflare, BunnyCDN).
6. Large or Unoptimized Database Your store database grows with every product, order, and customer. Poor indexing or bloated tables cause slow queries. This is especially common in WooCommerce or Magento.
Tip: Optimize your database monthly using plugins like WP-Optimize or direct SQL commands.
7. Overloaded Frontend with Too Many Requests Each button, font, icon, and script is an HTTP request. Too many requests slow everything down.
Tip: Minify CSS and JS files, combine where possible, and reduce HTTP requests using tools like Autoptimize.
8. No Content Delivery Network (CDN) Even with fast hosting, visitors farther from your server face delays in loading your website.
Tip: Use a CDN like Cloudflare or BunnyCDN to serve assets closer to your users worldwide.
How to Diagnose the Real Problem Use these free tools to pinpoint the exact cause:
Google PageSpeed Insights — shows Core Web Vitals
GTmetrix — waterfall view of every request
Chrome DevTools — identify blocking assets
Pingdom — great for global speed tests
Hosting Alone Isn’t Enough Your hosting might be fast, but your site architecture, plugins, and content delivery strategy matter just as much.
Think of hosting as a highway. If your store is a traffic jam of scripts, bloated images, and detours, speed still suffers. That’s why many businesses turn to a best eCommerce website development company that can take performance optimization seriously from the ground up.
Conclusion If you’re wondering, “Why is my eCommerce site slow even with good hosting?”, the answer likely lies in:
Poor frontend performance
Unoptimized assets
Database or plugin bloat
Start with a full site audit. Optimize images, scripts, and theme. Use caching and a CDN.
Speed isn’t just about user experience — it’s an SEO and sales factor. A few strategic improvements can significantly reduce load times, improve conversions, and lower bounce rates. For scalable and reliable results, consider working with an experienced eCommerce solutions provider in India that understands performance, user behavior, and growth strategies.
0 notes
Text
Exploring the Role of Azure Data Factory in Hybrid Cloud Data Integration

Introduction
In today’s digital landscape, organizations increasingly rely on hybrid cloud environments to manage their data. A hybrid cloud setup combines on-premises data sources, private clouds, and public cloud platforms like Azure, AWS, or Google Cloud. Managing and integrating data across these diverse environments can be complex.
This is where Azure Data Factory (ADF) plays a crucial role. ADF is a cloud-based data integration service that enables seamless movement, transformation, and orchestration of data across hybrid cloud environments.
In this blog, we’ll explore how Azure Data Factory simplifies hybrid cloud data integration, key use cases, and best practices for implementation.
1. What is Hybrid Cloud Data Integration?
Hybrid cloud data integration is the process of connecting, transforming, and synchronizing data between: ✅ On-premises data sources (e.g., SQL Server, Oracle, SAP) ✅ Cloud storage (e.g., Azure Blob Storage, Amazon S3) ✅ Databases and data warehouses (e.g., Azure SQL Database, Snowflake, BigQuery) ✅ Software-as-a-Service (SaaS) applications (e.g., Salesforce, Dynamics 365)
The goal is to create a unified data pipeline that enables real-time analytics, reporting, and AI-driven insights while ensuring data security and compliance.
2. Why Use Azure Data Factory for Hybrid Cloud Integration?
Azure Data Factory (ADF) provides a scalable, serverless solution for integrating data across hybrid environments. Some key benefits include:
✅ 1. Seamless Hybrid Connectivity
ADF supports over 90+ data connectors, including on-prem, cloud, and SaaS sources.
It enables secure data movement using Self-Hosted Integration Runtime to access on-premises data sources.
✅ 2. ETL & ELT Capabilities
ADF allows you to design Extract, Transform, and Load (ETL) or Extract, Load, and Transform (ELT) pipelines.
Supports Azure Data Lake, Synapse Analytics, and Power BI for analytics.
✅ 3. Scalability & Performance
Being serverless, ADF automatically scales resources based on data workload.
It supports parallel data processing for better performance.
✅ 4. Low-Code & Code-Based Options
ADF provides a visual pipeline designer for easy drag-and-drop development.
It also supports custom transformations using Azure Functions, Databricks, and SQL scripts.
✅ 5. Security & Compliance
Uses Azure Key Vault for secure credential management.
Supports private endpoints, network security, and role-based access control (RBAC).
Complies with GDPR, HIPAA, and ISO security standards.
3. Key Components of Azure Data Factory for Hybrid Cloud Integration
1️⃣ Linked Services
Acts as a connection between ADF and data sources (e.g., SQL Server, Blob Storage, SFTP).
2️⃣ Integration Runtimes (IR)
Azure-Hosted IR: For cloud data movement.
Self-Hosted IR: For on-premises to cloud integration.
SSIS-IR: To run SQL Server Integration Services (SSIS) packages in ADF.
3️⃣ Data Flows
Mapping Data Flow: No-code transformation engine.
Wrangling Data Flow: Excel-like Power Query transformation.
4️⃣ Pipelines
Orchestrate complex workflows using different activities like copy, transformation, and execution.
5️⃣ Triggers
Automate pipeline execution using schedule-based, event-based, or tumbling window triggers.
4. Common Use Cases of Azure Data Factory in Hybrid Cloud
🔹 1. Migrating On-Premises Data to Azure
Extracts data from SQL Server, Oracle, SAP, and moves it to Azure SQL, Synapse Analytics.
🔹 2. Real-Time Data Synchronization
Syncs on-prem ERP, CRM, or legacy databases with cloud applications.
🔹 3. ETL for Cloud Data Warehousing
Moves structured and unstructured data to Azure Synapse, Snowflake for analytics.
🔹 4. IoT and Big Data Integration
Collects IoT sensor data, processes it in Azure Data Lake, and visualizes it in Power BI.
🔹 5. Multi-Cloud Data Movement
Transfers data between AWS S3, Google BigQuery, and Azure Blob Storage.
5. Best Practices for Hybrid Cloud Integration Using ADF
✅ Use Self-Hosted IR for Secure On-Premises Data Access ✅ Optimize Pipeline Performance using partitioning and parallel execution ✅ Monitor Pipelines using Azure Monitor and Log Analytics ✅ Secure Data Transfers with Private Endpoints & Key Vault ✅ Automate Data Workflows with Triggers & Parameterized Pipelines
6. Conclusion
Azure Data Factory plays a critical role in hybrid cloud data integration by providing secure, scalable, and automated data pipelines. Whether you are migrating on-premises data, synchronizing real-time data, or integrating multi-cloud environments, ADF simplifies complex ETL processes with low-code and serverless capabilities.
By leveraging ADF’s integration runtimes, automation, and security features, organizations can build a resilient, high-performance hybrid cloud data ecosystem.
WEBSITE: https://www.ficusoft.in/azure-data-factory-training-in-chennai/
0 notes
Text

Expert Microsoft PowerApps Consulting Services: Unlocking Business Potential
Introduction
In today’s fast-paced digital landscape, businesses require agile solutions to enhance productivity, streamline operations, and improve customer experiences. Microsoft PowerApps, a powerful low-code application development platform, enables organizations to build custom applications tailored to their unique needs. However, to maximize its potential, expert consulting services are essential.
This article explores the benefits of Microsoft PowerApps consulting services, how they help businesses innovate, and the key aspects to consider when selecting a consulting partner.
Understanding Microsoft PowerApps
Microsoft PowerApps is a cloud-based, low-code application platform that allows users to create custom business applications without extensive coding knowledge. It integrates seamlessly with Microsoft 365, Dynamics 365, and other third-party applications, making it a versatile tool for businesses of all sizes.
Key Features of Microsoft PowerApps:
Low-Code Development: Build applications using a drag-and-drop interface with minimal coding.
Seamless Integration: Connect with Microsoft services, databases, APIs, and third-party platforms.
AI-Driven Capabilities: Enhance applications with artificial intelligence for automation and insights.
Cross-Platform Compatibility: Develop apps that work on web, mobile, and tablet devices.
Robust Security: Implement enterprise-grade security features to protect business data.
The Role of PowerApps Consulting Services
While PowerApps simplifies application development, expert consulting services help businesses optimize the platform’s full potential. Consultants provide strategic guidance, technical expertise, and customized solutions to address specific business challenges.
Benefits of PowerApps Consulting Services:
1. Accelerated App Development
With expert consultants, businesses can develop and deploy applications faster, reducing the time-to-market and improving operational efficiency.
2. Tailored Solutions
Consultants design custom applications that align with business objectives, ensuring that workflows and automation processes are optimized.
3. Seamless Integration with Existing Systems
PowerApps consultants help integrate applications with Microsoft 365, Dynamics 365, SharePoint, and other third-party platforms, ensuring data consistency and workflow efficiency.
4. Enhanced User Experience and Adoption
By focusing on user-centric design, consultants ensure that applications are intuitive, responsive, and easy to use, increasing adoption rates among employees.
5. Automation and AI Implementation
PowerApps consulting services include implementing AI-driven features, automation, and predictive analytics to enhance business intelligence and decision-making.
6. Scalability and Performance Optimization
Consultants ensure that applications are scalable and optimized for performance, supporting business growth and digital transformation.
Key Services Offered by PowerApps Consultants
1. Custom Application Development
Building tailored applications to meet specific business needs.
Creating interactive dashboards and reports.
2. Workflow Automation
Streamlining processes using Power Automate and AI-driven automation.
Reducing manual efforts and improving efficiency.
3. Data Integration and Connectivity
Connecting PowerApps with databases like SQL Server, Azure, SharePoint, and APIs.
Ensuring smooth data flow across business systems.
4. User Training and Support
Providing hands-on training to employees for effective app usage.
Offering ongoing support and maintenance for PowerApps solutions.
5. Security and Compliance Management
Implementing role-based access controls and data security measures.
Ensuring compliance with industry regulations such as GDPR and HIPAA.
Choosing the Right PowerApps Consulting Partner
Selecting the right consulting partner is crucial to achieving successful PowerApps implementation. Here are key factors to consider:
1. Expertise and Experience
Choose a consulting firm with a proven track record of successful PowerApps projects across different industries.
2. Customization Capabilities
Ensure the consultants can tailor applications to fit your business requirements and integrate them with existing systems.
3. Client Testimonials and Case Studies
Look for reviews, case studies, and testimonials that demonstrate the consultant’s ability to deliver results.
4. Scalability and Future Support
Select a partner that offers ongoing support, scalability, and future enhancements as your business grows.
5. Cost-Effectiveness
Compare pricing models and choose a consultant that provides high-quality services within your budget.
The Future of PowerApps and Business Innovation
As Microsoft continues to enhance PowerApps, the future holds significant advancements, including:
AI-Powered Business Applications: Leveraging machine learning and AI for predictive analytics and intelligent automation.
Enhanced Integration with IoT: Connecting PowerApps with IoT devices for real-time data monitoring and automation.
Advanced Collaboration Tools: Improving remote work efficiency with enhanced PowerApps integration in Microsoft Teams.
No-Code Innovations: Making app development even more accessible to non-technical users.
Conclusion
Microsoft PowerApps consulting services play a vital role in helping businesses unlock their full potential. By leveraging expert guidance, businesses can create customized applications, automate workflows, and integrate seamlessly with existing systems, leading to increased efficiency and productivity.
With the right PowerApps consulting partner, businesses can accelerate digital transformation, improve decision-making, and stay ahead in today’s competitive market. Whether you are a startup or an enterprise, investing in PowerApps consulting services is a strategic step toward achieving business success in the digital age.
0 notes
Text
Top Programming Languages for Web Development

Introduction
Web development is an exciting and constantly changing field, and choosing the right language is crucial for success. If you're looking to build sleek front-end interfaces, powerful back-end systems, or full-stack applications, understanding the Top Programming Languages for Web Development is essential. In this article, we will explore the best languages for web development and how to choose the right one for your needs.
The Languages on Front End Development
Front-end development is all about user experience because a well-designed web site should not just look good, but also work smoothly.
HTML-The Building Block of Web Pages
HyperText Markup Language (HTML) is the complete structure of any webpage. It provides a typical structure and elements for the website concerning headings, paragraphs, images, and links.
CSS-Designing for the Web
Cascading Style Sheets (CSS) enable developers to make stunning-looking websites. It takes care of colors, layouts, animations, and responsiveness, making these web pages both pleasing and functional.
JavaScript-The Interactivity Language
JavaScript enlivens websites and allows interaction elements like drop-down menus, sliders, and live updates. It happens to be dependent on equally HTML and CSS, which is crucial for the overall working of web pages today.
Backend Development Languages
The backend of a website deals with data, logic, and the processing that happens server-side.
Python-The Versatile Powerhorse
Python, being very simple and efficient, is mostly used for backend development owing to rapid application development with honest semantics and architecture through various frameworks like Django and Flask.
PHP-The Backbone of Dynamic Websites
PHP runs about 80% of the websites and WordPress sites. This server-side scripting language was designed specifically for web applications and was developed from the ground up to interface nicely with databases.
Java-Safe & Scalable
Due to its security, stability, and scalability, Java is preferred for large-scale applications. It is widely used in enterprise-level web development.
Node.js (JavaScript)-Fast and Efficient
A great strength of Node.js is the flat-out speed running JavaScript on the server side. Since JavaScript is used for both front and back-end development, that makes it much easier to develop an application.
Languages for Full-Stack Development
Full-stack developers are responsible for backend and frontend work.
JavaScript (with Node.js)-One Language to Rule Them All
JavaScript is suitable for full-stack development due to handling both client and server development using Node.js.
Python (Django & Flask) Rapid Development
Python, with Django and Flask, greatly facilitates full-stack development by systematically mapping out all templates for frontend use and then diving into all related logic for the backend.
Other Web-Related Technologies
SQL-Databases for the Web
SQL (structured query language) is an important skill for database management in web applications. The use of SQL allows web developers to store, retrieve, and manipulate information with great ease.
TypeScript-Helping JavaScript
TypeScript is an extension of JavaScript that allows static typing and improved code quality. It would be a good choice for building a massive web app.
Ruby on Rails-Ease and Productivity
Ruby on Rails is a great framework for people short on time. It favors convention over configuration, which allows developers to spend less time and energy developing.
How to Select the Best Language for Web Development
A Few Factors to Consider
Project requirements-Different languages suit different types of projects.
Ease of learning-Beginners who want something easy might well choose Python or JavaScript.
Job opportunities-JavaScript, Python, and Java are in great demand.
Community support-A robust community will ensure regular updates and help solve your problems.
Best Languages for Beginners
HTML, CSS, and JavaScript-the triple main must-learn programming languages for web development.
Python-Syntax so easy it can be learned very fast, great for the backend.
Best Languages for Advanced Developers
Java-Preferred for enterprise applications.
TypeScript-Greatly helpful for large projects.
js-Preferred for fast, scalable application development.
Conclusion
Web development is a highly stimulating and dynamic field, yet there are endless programming languages. Whether you are a novice or a professional, the choice of the language depends on your purpose and project requirements. JavaScript is still the language to work with in full-stack development, while Python and PHP will continue to render heavyweight competition for backend programming. Learn and practice as much as possible to figure out what will suit you best!
Location: Ahmedabad, Gujarat
Call now on +91 9825618292
Get information from https://tccicomputercoaching.wordpress.com/
0 notes
Text
Structured Query Language (SQL) is the most popular language used in computers to create and manage databases. It is a language which has its own syntax and grammar. It does not belong to a particular company but is a universal language. The Structured Query Language can be pronounced Sequel or SQL. Like other computer languages like C, C++, Pascal, Java etc. We need a way to use it on our computer. We need a program that uses SQL as its means of communication. SQL is monitored by an independent organization, but each company adds a few features to its own implementation. MySQL is an application which is getting increasingly popular. The increasing popularity indicates that it is good, efficient, effective and reliable. In a simple manner, SQL is a non-procedural English-like language which processes data in groups of records rather than one record at a time. A few functions of SQL are the following: Storage of data Modification of data Retrieval of data Data deletion Generation of tables and other database projects. How Hard Is It To Learn SQL SQL is database layer query language and is not very difficult to learn. It does not require any prior programming experience to learn SQL queries. Learning SQL can be really easy if you already know a programming language. The fastest way to learn SQL is to start learning by doing it. History Of SQL A paper styled “A Relational Model of Data for Large Shared Data Banks” by Edgar F. Codd wrote in 1970 defined the relational database model. It became the basis for developing the SQL. Codd was a researcher associated with IBM. Based on his findings, in 1974 IBM began working on a new language for relational database management systems. The new language was originally called SEQUEL, or Structured English Query Language. The language went through a few modifications, implementations and the name was also changed a few times before it was finally called SQL. Subsequently, many SQL-based offerings hit the market where IBM had a key role to play. SQL is a language which is easy for beginners to learn than other programming languages like Java, C++, PHP or C#. Some of the relational database management systems which use SQL are Oracle, Sybase, Microsoft SQL Server, Access, Ingres etc. Most database systems use SQL. Most of them have their own proprietary extensions that are usually used only on their system. “Select”, “Insert”, “Update”, ”Delete”, “Create” and “Drop” are the standard SQL commands which can be used to achieve almost everything that one needs to do with a database. For those students who want to learn to programme from scratch, many free online courses will be of help. Step 1: Strong Determination To Learn Not every person loves SQL and hence, many of your friends and family will try their level best to discourage you from learning the language. It is true that the world of programming is flooded with different competing languages and it is not really possible to pick the one which is the best. A language which works perfectly for you might not serve the same purpose for someone else. Hence, instead of paying attention to what the critics of SQL have to say, you must focus all your attention on learning the language you picked. Know About Types Of Jobs And Skill Required For SQL Here are some of the positions that require applicants to have SQL skills: Database Developer The database developer should have the experience and the skills such as with Spring, XML, PL/SQL, Apache Camel, and Agile Methodologies. He or she also should have the ability to work closely with applications and web developers. Excellent problem-solving skills and strong relationship management skills are added advantage. Database Administrator (DBA) The database administrator should have the ability to with the computers that have the data. He should understand how computers store and retrieve data and also should have the knowledge to create a database. And the knowledge of database
organization and how it affects the computer and network performance is a must for this position. Also must have the ability to solve the technical problems which are caused by the database design and malfunction. Data Analyst The database analyst should have technical and soft skills. Technical skills mean a basic knowledge of statistics to a rigorous understanding of Machine Learning and the computer skills such as a Statistical Language (R, SAS, SPSS), a scripting Language (Python, Matlab), a Spreadsheet (Excel), and Querying Language (SQL, Hive, Pig). The soft skills needed are; defining problem, knowing the audience and the delivery. Data Warehouse Engineer Data Warehouse Engineer should have the ability to dealing with people and the knowledge various aspects of data warehousing on the areas such as Overall end-to-end data warehousing architecture, understanding of client/server, server-side computing architectures and the understanding of database optimization concepts for tuning data access queries SQL Reports Writer SQL Reports Writer should have the overall knowledge of SQL and good communication skills, and various computer applications which are necessary for this position. Step 2: Start Simple Learning SQL can be frustrating and require a lot of hard work on reading and practicing queries and commands. Do not try to do everything at the beginning. - Practice Basic SQL. - Take it slow and learn simple queries first, then move to complex query writing. - Watch some video tutorial. - Practice with SQL assignment, example, and coding. You can find academic SQL assignment help at assign code website in case you are stuck. Step 3: Install My SQL and My SQL Workbench Why MySQL We have chosen MySQL since its simple, free and easy to learn. You can start with any database of your choice (if easily available). The below steps would still help you. Installation My SQL database is an open source and freely available database. You can easily download the My SQL server and its client workbench for quickly getting started. Download and Install My SQL Community Edition Database Download and Install My SQL Workbench Step 4: Learn SQL Fundamentals It's important to learn the fundamental concept of SQL first. Once you know the basic you can do more advanced things on SQL easily. An Overview Of Relational Database A relational database system contains one or more objects that are called tables. The data for the database is stored in these tables. Tables comprise of rows and columns. Rows contain the records or data for the columns. Columns contain the column name, data type and any other attributes for the column. Selecting Data In order to query the database and retrieve selected data that match the criteria, the select statement is used. The column names which follow the select keyword determine which columns will be returned in the results. One can select as many column names as one wants or can use a “*” to select all columns. The table name that follows the keyword “from” specifies the table that will be queried to retrieve the desired results. The optional “where” clause indicates which data values or rows will be returned or displayed. It is done based on the criteria described after the keyword “where.” Create Table “Create table” statement is used for creating a new table. In order to create a new table, the keywords “create table” must be used followed by the table name, an open parenthesis, the first column name, the data type for that column, any optional constraints and a closing parenthesis in order. Use of an open parenthesis before beginning the table and a closing parenthesis after the table is crucial. Each column definition should be separated with a comma. All SQL statements must end with a semicolon. Insert Data To insert or add a row of data into the table the “insert” statement is used. The keywords “insert into” must be used to insert records into a table followed by the table name, an open parenthesis,
a list of column names separated by commas, a closing parenthesis, the keyword “values” followed by the list of values enclosed in parenthesis. The values will behold in rows and they will match up with the specified column names. Update Data For updating records the “update” statement is used. A “where” clause must be carefully constructed for this purpose. In order to delete records or rows from the table, the “delete” statement is used. If the “where” clause is left all records will be deleted. To delete a table and all rows in a table the “drop table” command is used. Drop table is different from deleting all the records in a table. Only column and constraint information remain when all of the records in the table are deleted. Table definition and all rows get removed when dropping the table. Step 5: Read Some Good Books from Experts Although you can learn a lot of things on the internet and web-based tutorials. I recommend you to pick best mysql book. My favorite book is MySQL Crash course, I highly recommended it for beginners. Step 6: Start Writing and Running Simple Queries Write simple queries on My SQL and observe the results. Some simple query exercise that you can try are listed below resources SQL Exercise By Stanford A course by Stanford University requires the students to do following exercises. SQL Zoo Tutorials This tutorial contains some basic exercise that you can start with. MySQL Exercises, Practice, Solution Step 7: Simple Is Not Enough: Try Complex Queries and Performance Improvements Once you feel comfortable on simple queries and practice exercises you can move to complex queries. At this stage, I will recommend you to start focusing on the performance aspect of queries. Try to write and query that perform better. There are many ways to write SQL query however the performance may change. You need to write the queries efficiently that can return results in a short time. Learning SQL is a very important step in developing our database skills. If one has all his data in the SQL database, he needs to know how to retrieve it properly. It is also essential to know how to leverage the power of SQL to perform advanced table joins and other complex queries. Databases can be manipulated using the Data Manipulation Language (DML) which is a subset of SQL. One will be able to learn how to create databases and tables, delete data from databases and comprehend other complexities such as NULL values. A very common use of SQL is to perform searches against large volumes of data. Searching is made easy with many operators of SQL. The users just need to be aware of the multiple options available and they should be able to decide which technique is the best for them in a given situation. These tips should be practiced on a regular basis especially when writing queries. Hi my dear friends, I am a freelance writer in ClazWork scholarship essay writing service. I have prepared the number of articles, assignments, projects, professional essays document, thesis papers etc. I have 4 years experience in M Phil thesis writing papers. All the fields of papers are available in our company. Recently I will publish the article name as “Learning Tips for using SQL”
0 notes
Text
Mastering Power BI Dashboards
In today’s data-driven world, businesses rely heavily on insightful analysis to make informed decisions. Power BI, developed by Microsoft, has emerged as one of the leading business intelligence tools that help organizations convert raw data into interactive and visually compelling dashboards. Whether you are a business analyst, data professional, or a beginner exploring data visualization, mastering Power BI dashboards can significantly enhance your analytical capabilities.
Understanding Power BI Dashboards
A Power BI dashboard is a collection of visual elements, including charts, graphs, maps, and tables, designed to present a consolidated view of data. Unlike reports, which can be multiple pages long, dashboards are single-page, interactive snapshots that provide key insights at a glance. They pull data from multiple sources, ensuring that businesses can track key performance indicators (KPIs) and trends effectively.
Dashboards in Power BI are often used for:
Business Performance Monitoring: Tracking sales, revenue, and operational efficiency.
Customer Insights: Understanding purchasing behaviors and customer engagement.
Financial Analysis: Evaluating profit margins, expenses, and budget allocations.
Marketing Performance: Analyzing campaign success and return on investment.
Why Power BI Dashboards Are Essential
Power BI dashboards are widely used across industries due to their flexibility, scalability, and integration capabilities. Here are some key reasons why they have become indispensable:
1. Real-Time Data Analysis
Power BI dashboards can connect to live data sources, ensuring that users receive up-to-date insights in real-time. This capability is crucial for businesses that rely on dynamic data, such as e-commerce platforms or financial institutions.
2. User-Friendly Interface
With a drag-and-drop functionality, Power BI makes it easy to create stunning dashboards without requiring advanced coding skills. This democratizes data analysis, allowing even non-technical users to build meaningful visualizations.
3. Seamless Integration
Power BI integrates seamlessly with various Microsoft tools like Excel, Azure, and SQL Server, as well as third-party applications such as Google Analytics, Salesforce, and SAP. This ensures smooth data flow and analysis from multiple sources.
4. Customization and Interactive Features
Users can customize dashboards based on their specific requirements, apply filters, and use drill-down features to explore detailed insights. This level of interactivity makes dashboards more engaging and useful for decision-making.
5. Enhanced Collaboration
Power BI’s cloud-based service allows teams to share dashboards securely, enabling collaborative decision-making. Users can also access dashboards on mobile devices, ensuring data accessibility from anywhere.
How to Build an Effective Power BI Dashboard
Creating a well-structured Power BI dashboard requires a clear understanding of business objectives, data sources, and visualization techniques. Follow these steps to build an impactful dashboard:
Step 1: Define Your Objectives
Before designing a dashboard, determine what insights you need to extract. Are you tracking sales growth? Analyzing website traffic? Understanding customer demographics? Defining clear objectives ensures that your dashboard serves its intended purpose.
Step 2: Collect and Prepare Data
Gather data from relevant sources, such as databases, APIs, spreadsheets, or cloud services. Clean and transform the data to ensure accuracy, consistency, and usability. Power BI’s Power Query Editor helps in cleaning and shaping data efficiently.
Step 3: Choose the Right Visualizations
Select charts, graphs, and tables that best represent your data. Some commonly used visualizations in Power BI dashboards include:
Bar Charts: Best for comparing categorical data.
Line Charts: Ideal for tracking trends over time.
Pie Charts: Suitable for showing proportions.
Maps: Useful for geographical analysis.
KPI Indicators: Highlight performance metrics at a glance.
Step 4: Design an Intuitive Layout
A well-organized layout enhances readability and engagement. Place the most important insights at the top, use contrasting colors to highlight key metrics, and avoid cluttering the dashboard with unnecessary elements.
Step 5: Implement Filters and Slicers
Filters and slicers allow users to interact with the dashboard and customize the data displayed. This adds flexibility and makes the dashboard more user-centric.
Step 6: Test and Optimize
Before sharing the dashboard, test its functionality by exploring different scenarios. Optimize loading speed by minimizing unnecessary calculations and large datasets. Ensure that the dashboard is responsive across different devices.
Best Practices for Power BI Dashboards
To create high-impact Power BI dashboards, follow these best practices:
Keep It Simple: Avoid overcrowding the dashboard with too many visuals. Focus on key insights.
Use Consistent Colors and Themes: Maintain a uniform color scheme to enhance visual appeal.
Leverage Data Storytelling: Present data in a way that tells a compelling story, making it easier for users to interpret.
Ensure Data Accuracy: Regularly update data sources to maintain credibility.
Enable Performance Optimization: Optimize DAX calculations and data models to enhance dashboard efficiency.
Conclusion
Mastering Power BI dashboards is a valuable skill that can boost career opportunities in data analytics, business intelligence, and decision-making roles. With its user-friendly interface, real-time data capabilities, and seamless integration, Power BI has become the go-to tool for professionals across various industries. Whether you are a beginner or an experienced analyst, learning Power BI through the best course can enhance your ability to create powerful dashboards that drive business success. Start exploring Power BI today and unlock the potential of data visualization for informed decision-making.
0 notes