#my stats were fine for undergrad physics so hopefully they're okay in general?
Photo
Summary
From a sample of 100 writeblrs...
Chapter Word Count
Mean: 3.9k +/- 0.3k
Median: 3.0k +/- 0.5k
Mode: 2.0k +/- 0.5k
Range of Chapter Word Counts (Max-Min)
Mean: 4.8k +/- 0.5k
Median: 3.3k +/- 0.5k
Mean->Minimum Word Count
Mean: 2.0k +/- 0.2k
Median: 1.5k +/- 0.5k
Mean->Maximum Word Count
Mean: 2.7k +/- 0.4k
Median: 2.0k +/- 0.5k
For writeblrs, the usual chapter length is 3.0k +/- 0.3k. With longer chapters reaching 5.0k +/- 0.8k and shorter chapters reaching 1.5k +/- 0.8k. The median was chosen since there were significant outliers affecting the mean.
Thanks all for sending your data! I go into detail of random stuff under the cut (including an explanation of each graph).
@cogesque, @if-only-we-could-read-it, @etjwrites, @owlsofstarlight you all requested to be tagged in the results. Hope this lives up to expectations! :)
Interesting stuff to note:
Unexpectedly low results for to (3,4] band or a peak at (4,5] and (9,10]. I think this probably has something to do with the way people estimate. Towards the lower numbers, you’re more likely to guess in 0.5k or 1.0k intervals, however, as the numbers increase you’re unlikely to be this specific. This makes sense to the human brain since the error in lower results is more significant. For example, the percentage error when saying 1 when you mean 0.5 is much larger than if you said 11 rather than 10.5. This possibly leads to rounding which, generally speaking, do not affect the overall result (assuming the rounding is symmetric) but display strangely on the histogram. Results that are around 5.0k (4-6) probably suffer as people round to 5, the same as with 10.0k. In a future data collection, this could be rectified by ensuring that averages taken are precise (not estimates).
Ranges suggest that writers are more likely to write significantly over their average word count and less likely to write significantly under their average word count. This could be accounted for by the fact that that the average word count is around 3.0k, not leaving much room for lower word counts. Another possibility is that writers underestimate their average or that they only very rarely write significantly more (the range given included an outlier as their maximum).
Graph-By-Graph (for a break down of the data):
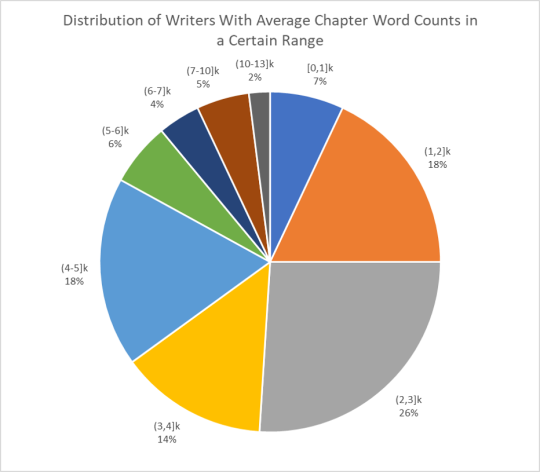
1. Pie Chart of Distribution of Writers’ Average Word Counts
Results show:
0-1k - 7%
1-2k - 18%
2-3k - 26%
3-4k - 14%
4-5k - 18%
5-6k - 6%
6-7k - 4%
7-10k - 5%
10-13k - 2%
This is up to and including, so in the range of 1-2k includes writers who stated their word counts were 1.5k or 2.0k. Showing the percentage of writers whose average chapter word count was within a certain range.
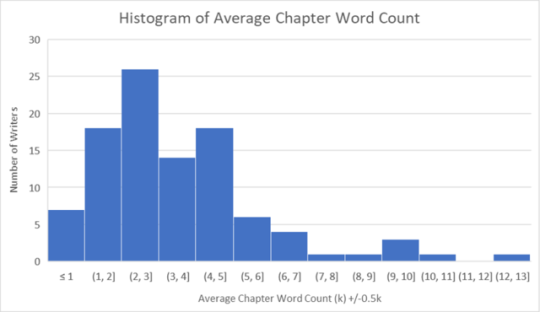
2. Histogram
Results show:
≤1k - 7
1-2k - 18
2-3k - 26
3-4k - 14
4-5k - 18
5-6k - 6
6-7k - 4
7-8k - 1
8-9k - 1
9-10k - 3
10-11k - 1
11-12k - 0
12-13k - 1
This is up to and including, so in the range of 1-2k includes writers who stated their word counts were 1.5k or 2.0k. It shows the same data as the pie chart but in a different format with numbers of writers rather than a percentage of.
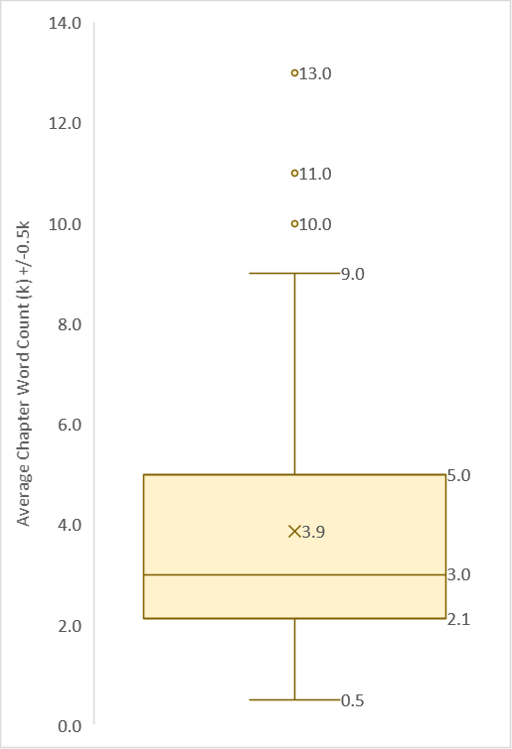
3. Box Plot of Average Chapter Word Counts
Results lay within the range of 0.5-9.0k, with outliers at 10.0k, 11.0k and 13.0k. Most of these results were found within the range of 2.1-5.0k with the median result being 3.0k and the mean result being 3.9k.
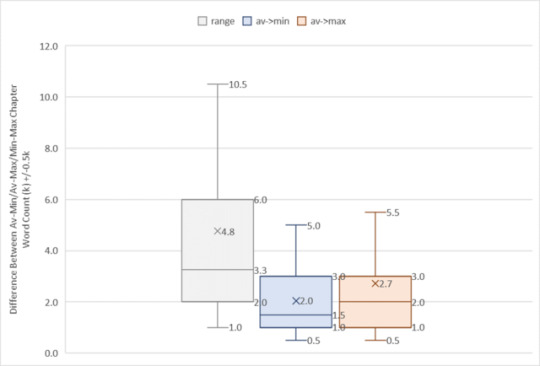
4. Box Plot of Ranges
A) Range. Results lay within the range of 1.0-10.5k, with outliers at 14.0k, 15.0k, 16.0k, 20.0k and 23.0k (not shown on the graph). Most of these results were found within the range of 2.0-6.0k with the median result being 3.3k and the mean result being 4.8k.
B) Average to Minimum. Results lay within the range of 0.5-5.0k, with outliers at 7.0k and 9.0k (not shown on the graph). Most of these results were found within the range of 1.0-3.0k with the median result being 1.5k and the mean result being 2.0k.
C) Average to Maximum. Results lay within the range of 0.5-5.5k, with outliers at 7.0k, 8.0k, 8.5k, 11.0k and 20.5k (not shown on the graph). Most of these results were found between the range of 1.0-3.0k with the median being 2.0k and the mean result being 2.7k.
General Guide to Statistics
Mean: average value of the sample.
Median: middle value of the sample.
Mode: most common value of the sample.
#writeblrs#writers of tumblr#writing stats#please don't kill me if this isn't the proper way to do it!#my stats were fine for undergrad physics so hopefully they're okay in general?#who knows!
110 notes
·
View notes
Last Seen Blogs

mgr0aj
log.


highland-falls
Due to lack of interest tomorrow is cancelled

shadowycopauthorwombat
Untitled

isfjmel-phleg
But sometimes there are secrets trying to understand people