#pointandfigure
Text
Techninė analizė. Kryžiukai ir nuliukai
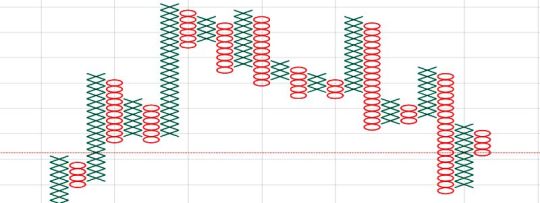
Kryžiukai ir nuliukai (KiN, Point and Figure) yra dar vienas kainos grafiko tipo pavyzdys, kuris remiasi tik kainų pokyčiais, be laiko
#trading #money #pricechart #pointandfigure #kryziukaiirnuliukai #technineanalize
Kryžiukai ir nuliukai (KiN, Point and Figure) yra dar vienas kainos grafiko tipo pavyzdys, kuris remiasi tik kainų pokyčiais, be laiko intervalų. Tokiu būdu KiF grafikai yra panašūs į Renko, Kagi ir Line Break grafikus. Pagrindinis KiN grafikų supratimas yra tas, kad jas sudaro stulpelių serija, sudaryta iš ‘X’ arba ‘0’.
Continue reading Untitled
View On WordPress
#Investavimas#Kagi#Kryžiukai ir Nuliukai#Line Break chart#Money#Pinigai#Point and Figure#Renko chart#Techninė analizė
1 note
·
View note
Text
A Visual Thesis on S&P 500
I will be using various technical analysis methods to arrive at a view on the S&P 500 Index. The methods used will range from systematic (rules based system) to discretionary (seat of the pants) based system where the view is totally subjective.
So lets begin our journey by painting a broad picture on the S&P 500 Index by focusing first on some of the more systematic models, some of which are proprietary and then later in the presentation we will morph towards a more discretionary assessment to establish a view. We begin with a simple trend following system. A cross from below the volatility channel resulting in a close above results in Buy Signal while a cross from above the volatility channel resulting in a close below results in a Sell Signal.

The chart above indicates that the S&P 500 remains very much in Buy Mode since November 9th.
The next chart below looks at the Advance Decline line and the Advance Decline Volume line with the S&P 500 Index. A technical analyst usually looks for subtle divergences between the Index and the indicators however on the chart below we see no signs for concern as all the lines are trending higher.

I have built a variety of indicators that I have named Risk Allocator Models (RA) for lack of a better term but in a way they measure risk and they help an investor mitigate or add risk at what are usually opportune times. I have modelled them in a visual manner to make the signals seem more intuitive. These RA models are displayed below as histograms with a move above zero indicating a BUY Signal and a move below zero indicating a SELL Signal.


So the RA models in the charts above confirm a bullish thesis if one is looking at the charts from a rules based perspective. However while we continue to look at this market non subjectively lets look at some charts that do not seem as bullish.

The chart above using an RA model that has given me some of the best Buy and Sell Signals at market bottoms and tops respectively has surprisingly been in Sell Mode since January 6th 2017 and hence has missed out on about 3-4 percent upside.
This next chart below has an indicator in the lower panel that gives us Buy signals and the occasional Sell signal when the indicator moves outside the price band. The last signal given is a Buy signal however the indicator is showing some signs of exhaustion which could see a possibility of a repeat of 2011.

Lets move on to more discretionary methods of technical analysis and we will start off with a Point and Figure Chart which has almost become a rare form of charting at least within the institutional community.

There are two price projections from the near term chart which suggest a range between 2270-2390 from the lower reversal pattern and a projection of 2270-2380 from the higher consolidation pattern. These are guidelines and currently we are close to breaching the upper range of the projection for both counts.
Another more controversial and even more subjective form of technical analysis is Elliott Wave theory. Below is a weekly chart of the S&P 500 with the Elliott Wave counts labelled accordingly.

Before we drill down further to the daily chart, I would like to draw your attention to degree of the count from Wave 4. I believe the impulse wave pattern from wave 4 in 2016 currently in progress is just forming Wave (1) of Wave 5.

The pattern on the daily chart suggests that we are very close to completing wave 5 of Wave (1) of Wave 5. So if we are close to completion of wave 5 what is our price target ??

Our price target as can be seen on the intraday chart is a cluster of resistance we see at 2378-2382 with an important level at 2384.51. These levels actually coincide with the Point and Figure targets mentioned earlier. So it might be a good time to take some precaution as the magnitude of the correction could result in a 5-7% correction.
So this brings us to a fairly important question as to why I believe this impulse pattern post Brexit is just Wave (1) of Wave 5. The primary reason would be the magnitude of the move from Wave 4 has been modest. There is a second reason why I feel this market will eventually go higher and for that we will go back to a longer term point and figure chart.

As I have to do these counts on the Point and Figure chart manually you may not be able to see the targets quite clearly but the horizontal point and figure projection above points to a target range of 2798 - 2913.
So to summarize we will stay long term bullish on this market although we are near term very cautious expecting a 5-7% correction imminently.
0 notes
Photo

One day Course on “Trade the Markets Point & Figure way” in Pune ! Book your seat before it’s too late!
This is an opportunity to learn a complete new approach to trading and become an expert trader!
Register now @ https://goo.gl/yeuFYJ
#pointandfigure #pnfchart #trade #stockmarket
0 notes
Photo

One day Course on “Trade the Markets Point & Figure way” in Pune ! Book your seat @ http://www.definedge.com/trade-the-markets-pf-way-pune/
This is an opportunity to learn a complete new approach to trading and become an expert trader!
#pointandfigure #pnfchart #trade #stockmarket
0 notes
Photo

One day Course on “Trade the Markets Point & Figure way” in Pune ! Book your seat before it’s too late!
This is an opportunity to learn a complete new approach to trading and become an expert trader!
Register now @ https://goo.gl/qsAJj4
#pointandfigure #pnfchart #trade #stockmarket
0 notes
Photo

One day Course on “Trade the Markets Point & Figure way” in Pune ! Book your seat before it’s too late!
This is an opportunity to learn a complete new approach to trading and become an expert trader!
Register now @ https://goo.gl/qsAJj4
#pointandfigure #pnfchart #trade #stockmarket
0 notes
Photo

One day Course on “Trade the Markets Point & Figure way” in Pune ! Book your seat before it’s too late!
This is an opportunity to learn a complete new approach to trading and become an expert trader!
Register now @ https://goo.gl/qsAJj4
#pointandfigure #pnfchart #trade #stockmarket
0 notes
Photo

Only One day left for One Day Course “Trade the Markets Point & Figure way” in Mumbai this Weekend!
If you haven't booked your tickets book it now > https://goo.gl/qsAJj4
#pointandfigure #pnfchart #trade #StockMarket
0 notes
Photo

Only 2 days left for One Day Course “Trade the Markets Point & Figure way” in Mumbai this Weekend!
This is an opportunity to learn a complete new approach to trading and become an expert trader!
If you haven't booked your tickets book it now > https://goo.gl/qsAJj4
#pointandfigure #pnfchart #trade #StockMarket
0 notes
Photo

One-day Course On Advanced Point & Figure Techniques !!!
This advanced course will also help you understand where you are and where you wish to be in your trading career. We will help you identify and close this gap as well.
This is an opportunity to learn a complete new approach to trading and become an expert #trader!
What you will learn ??
a.Complete understanding of all #PointandFigure formations
b.How to find clear and objective patterns
c.How to find strength
d.Very short term to long term trading / investing setups using Point and Figure charts.
e.Mid cap #stocks_trading setups.
f.System trading using Point and Figure charts.
g.How to use scanners and back testing using Point and Figure.
h.Discover 6 steps to trade the markets successfully
Register Now @ https://goo.gl/KEKOn2
0 notes
Photo
One day Course on “Trade the Markets Point & Figure way” at Bengaluru on 24th March 2018! Book your seats! This is an opportunity to learn a complete new approach to trading!
Register now @ http://www.definedge.com/trade-the-markets-pf-way/
0 notes
Last Seen Blogs

betterhalfcelebs
The Best Of Women

jourdybaby
Theshipcaptain

buckybarnesbutt
not us.

oberserver
Simultaneously Splitting within the Intergalactic

dotlilith
Swamp Legend