#spssdataanalysis
Explore tagged Tumblr posts
Visit Tumblr Blog
Explore Tumblr blogs with no restrictions, modern design and the best experience.
Last Seen Tumblr Blogs


Fun Fact
Total funding amounts to $125.3M.
Text
How to Run Statistical Analysis in SPSS
How to Run a Statistical Analysis in SPSS? we provide Step-by-Step SPSS tutorial videos, it is absolutely FREE! Please scroll down and enjoy our Free Online SPSS Resources.
please visit👇
www.onlinespss.com
#spss #rstudio #stata #amos #statistics #dataanalysis
#data analysis#spss#statistics#ibm spss#spssdataanalysis#rstudio#spss sas stata statisticshelp statisticalanalysis statistician factoranalysis#meta analysis
0 notes
Text
What Is SPSS and Its Importance in Research & Data Analysis?

SPSS help or SPSS refers to Statistical Package for the Social Science, launched in the year 1968 and it has been acquired by IBM in 2009. Due to its diverse properties and different statistical methods, the program is widely utilised by researchers in order to conduct data analysis and evaluation by applying different statistical models. The market researchers, government agencies, survey companies, health care workers, educational researchers and different industries across the globe are utilising SPSS software for conducting in-depth critical research and data analysis. This statistical program is a user-friendly software system that helps the researchers to include a large volume of data and conduct critical analysis. It is hereby helpful for the researcher to visualise a large amount of data and sort it out for better analysis. Text analysis and survey feedback analysis can also be conducted through SPSS which provides powerful insights into the gathered data and information. It is mainly utilised for analysing the numeric data collected from first-hand sources. It is hereby beneficial for the researchers to use SPSS in order to progress in the study and perform in-depth analysis in evaluating the gathered data.
The properties of SPSS include different statistical models through which the researchers can conduct data analysis. In this regard, the descriptive analysis is widely conducted through SPSS, where the researchers try to represent the data and information through graphs, charts and tables. In this regard, the mean, median, mode, standard deviations and variance are some of the common statistical consulting measures, through which the researchers conduct descriptive analytics. SPSS is hereby suitable for using these programs in order to interpret the data and evaluate it critically. All the above-mentioned statistical measures are effective in identifying the recent trends as well as predicting future trends. SPSS hereby provides a scope to visualise the gathered data in a systematic way where a large volume of data can also be managed efficiently. A wide variety of visual representations includes density charts, radical boxplots, tabular forms, graphical representation, charts etc., through which it is effective to represent the data easily and analyse it to draw final conclusions.
For such properties, SPSS is widely utilised by researchers to conduct social science research, writing assignments, and others. For writing a thesis or essays they opt for SPSS assignment help also. A linear regression model is another major method of representing the data and information, where SPSS supports conducting regression analysis. The multivariate regression model can also be run through this software package. In this regard, the researchers try to identify the relationship between the variables, for which the correlation and regression are being performed well through SPSS. It is efficient for the researchers to consider the dependent variables and independent variables for analysing interlink and drawing the final conclusion. Data analysis in quantitative research methodology as well as thesis paper analysis, testing the hypothesis and identifying correlation coefficient and regression are mostly adopted in order to conduct in-depth critical analysis. The researchers are trying to identify the existing variables in the data set and sort it out with proper naming and coding in order to input the data into the SPSS. After data sorting and management, it is beneficial for the researchers to perform SPSS statistics programs in order to critically analyse the gathered data.

Moreover, bivariate statistics are also utilised in SPSS, for analysing multiple variables through this software system. The methods such as T-test, P-value test and ANOVA. The researchers try to identify the multiple variables in the data set and utilise multi-variant models in SPSS for analysing the influence of the variables in the data set. Such practice is effective for the researchers to evaluate the data critically and meet the research objectives. Hereby, different properties of SPSS further influence the researchers to use this in conducting in-depth critical research. SPSS is playing a crucial role in data analysis, where it is possible to manage a large volume of data along with diverse variables in a specific data set. The researchers find it easy to handle and perform different statistical analyses easily through this single software package. Hence, in order to perform the research effectively with in-depth data analysis and evaluation, SPSS data analysis is helpful to interpret the data and establish the final report. Easy interpretation of the report and critical analysis by considering all the variables in the data set are hereby beneficial for the researchers to progress in the study and test the research hypothesis to meet the ultimate study objectives. The inbuilt tools such as correlation and regression analysis, mean, median and mode, standard deviation as well as covariance ANOVA and T-test etc. are effective for the researchers to utilise and make the research successful. Through SPSS, the researchers can draw the final conclusion by evaluating the gathered data.
#spss#spsshelp#spssdataanalysis#spssassignmenthelp#analysis#dataanalysis#spsssoftware#spssstatistics#statisticalconsulting
0 notes
Link
How to Run Survival Analysis Test in SPSS
0 notes
Text
Data Collection for Resources with SPSS Help: Qualitative and Quantitative

Introduction
SPSS is the most trusted analytical software and SPSS help is its assistance to be provided by the experts to understand the workings of this tool. This programme was developed by SPSS Inc. in 1968 which was later acquired by IBM in 2009 for various analytical tasks such as business intelligence, data management, criminal investigation, multivariate analysis, and much more. Due to its easy-to-use platform, flexibility, and scalability, it is popular amongst people with different working skills.
Qualitative and quantitative research methodologies:
In research, the qualitative and quantitative methodology is the crucial part of the research where the researchers and data analysts are able to choose the best methods for conducting the study in a systematic way. Data and information are important for further critical analysis and in-depth evaluation, and it is mandatory for the researchers to collect authentic data and information. There are different ways to gather valid information and data, appropriate for the research. The researchers and data analysts are experienced to review the different sources of data and information for further data collection and analysis. There are mainly two types of data collection methods, primary and secondary.
Primary data collection:
It is the practice of gathering data from first-hand sources like surveys, questionnaires, case study analyses and interviews. First-hand data is considered a primary source of data through which it is possible to gather real-life experiences, personal opinions and perspectives of the respondents. The strategies of survey questionnaires, interview sessions, and case study reviews are effective to collect primary data and information. The researchers are efficient to collect the numeric data and information directly from the participants.
Secondary data collection:
It is different from the primary data collection method, where the researchers review the secondary sources of information which are books, journals, articles and online published articles. Gathering authentic data and relevant information is mandatory for the researcher to conduct the study and fulfil the research aim. The secondary data collection method is effective to review the literature, gather theories and models related to the study and develop own understanding for better qualitative analysis and evaluation of the research. Own knowledge and skills further help the researcher to conduct the study with critical evaluation and in-depth analysis.
In order to analyse the primary and secondary data and information, there are two techniques of data analysis, which are quantitative and qualitative. According to the type of the gathered data and information, the researchers are trying to choose the best data analysis technique to meet the research objectives, that is quantitative and qualitative research.
Quantitative data analysis:
The quantitative analysis method is mainly utilised for analysing the primary data, which are in numeric form or others. The data analysis is being conducted through charts, graphs, and other statistical tools for better analysis and data evaluation. The analysis is concerned with numerical data and identifying the average answers and quantitative phenomena. Descriptive statistics is being utilised, where the researchers are efficient to develop graphs, charts and tables for representing the data and analysing it critically. SPSS is the software system that is utilised widely by researchers for analysing numeric data successfully. The statistical functions including the mean, median, mode, standard deviation, variance, correlation and coefficient are helpful for the researcher to analyse the data and explore the impacts of independent variables on the dependent ones. This is the best way to test the research hypothesis and draw final conclusions for meeting the research objectives. The sample size is mainly large where the respondent’s data will be analysed efficiently through static models.
Qualitative data analysis:
The qualitative data analysis method is different from the quantitative research methodology, and in this regard, the researchers mainly use the existing theories and concepts for data analysis and evaluation. The qualitative data analysis is concerned with non-statistical data and the typical data includes, for example, gender nationality religion, qualitative information etc. The secondary data is being utilised by this method, and in-depth evaluation, case study analysis and thematic analysis are the major ways to conduct the qualitative study. The sample is small and the researcher tries to interpret the social interactions for completing the research. The sample size is small as compared to the quantitative data analysis technique.

Conclusion
Hereby, as per the data collection method, the researchers choose the right data analytics technique for further critical evaluation. It is possible for the data analyst to represent the data in a systematic way and perform quantitative qualitative research methodology as per the research topic and the hypothesis. The numeric data analysis can be conducted through quantitative data analysis, where mainly SPSS data analysis is widely utilized. The survey data and large volume sample are being analysed critically through the quantitative data analysis technique. On the other hand, the interview transcript, and secondary data are analysed through qualitative methods, mainly by case study analysis and thematic analysis. In this regard, the theories and concepts are useful for the researchers to improve their own understanding and acknowledge the research aim and objectives. Authenticity and validity of the data and information are necessary to be maintained for critical evaluation. Ethical consideration is playing a crucial role to perform the research activities in a systematic way and in this context; it is possible for the data analysts and researchers to choose the best way for completing the study successfully.
0 notes
Text
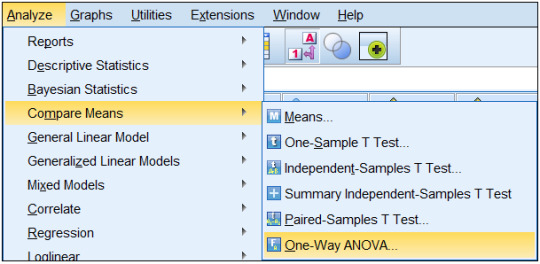
One-Way ANOVA
One-Way ANOVA ("analysis of variance") compares the means of two or more independent groups in order to determine whether there is statistical evidence that the associated population means are significantly different. One-Way ANOVA is a parametric test.This test is also known as:One-Factor ANOVAOne-Way Analysis of VarianceBetween Subjects ANOVAThe variables used in this test are known as:Dependent variableIndependent variable (also known as the grouping variable, or factor)This variable divides cases into two or more mutually exclusive levels, or groupsCommon UsesThe One-Way ANOVA is often used to analyze data from the following types of studies:Field studiesExperimentsQuasi-experimentsThe One-Way ANOVA is commonly used to test the following:Statistical differences among the means of two or more groupsStatistical differences among the means of two or more interventionsStatistical differences among the means of two or more change scoresNote: Both the One-Way ANOVA and the Independent Samples t-Test can compare the means for two groups. However, only the One-Way ANOVA can compare the means across three or more groups.Note: If the grouping variable has only two groups, then the results of a one-way ANOVA and the independent samples t-test will be equivalent. In fact, if you run both an independent samples t-test and a one-way ANOVA in this situation, you should be able to confirm that t2=F.Data RequirementsYour data must meet the following requirements:Dependent variable that is continuous (i.e., interval or ratio level)Independent variable that is categorical (i.e., two or more groups)Cases that have values on both the dependent and independent variablesIndependent samples/groups (i.e., independence of observations)There is no relationship between the subjects in each sample. This means that:subjects in the first group cannot also be in the second groupno subject in either group can influence subjects in the other groupno group can influence the other groupRandom sample of data from the populationNormal distribution (approximately) of the dependent variable for each group (i.e., for each level of the factor)Non-normal population distributions, especially those that are thick-tailed or heavily skewed, considerably reduce the power of the testAmong moderate or large samples, a violation of normality may yield fairly accurate p valuesHomogeneity of variances (i.e., variances approximately equal across groups)When this assumption is violated and the sample sizes differ among groups, the p-value for the overall F test is not trustworthy. These conditions warrant using alternative statistics that do not assume equal variances among populations, such as the Browne-Forsythe or Welch statistics (available via Options in the One-Way ANOVA dialog box).When this assumption is violated, regardless of whether the group sample sizes are fairly equal, the results may not be trustworthy for post hoc tests. When variances are unequal, post hoc tests that do not assume equal variances should be used (e.g., Dunnett’s C).No outliersNote: When the normality, homogeneity of variances, or outliers assumptions for One-Way ANOVA are not met, you may want to run the nonparametric Kruskal-Wallis test instead.Researchers often follow several rules of thumb for one-way ANOVA:Each group should have at least 6 subjects (ideally more; inferences for the population will be more tenuous with too few subjects)Balanced designs (i.e., the same number of subjects in each group) are ideal; extremely unbalanced designs increase the possibility that violating any of the requirements/assumptions will threaten the validity of the ANOVA F test.
Need help?
Please visit our website for more details, here is the link; www.onlinespss.com
or please feel free to email us;
#SPSSdataanalysis #datamining #dataanalysis #dataanalysisservices #dataanalysisservice #dataanalysisspss #statisticsservice #statisticaldataanalysis #statisticalanalysis #datacollection #statistcalconsulting #statisticalconsultingfirms #data #dataanalyticsspss #dataanalytics #datascience #bigdata #education #SPSSdataanalysis #SPSSdataanalysisservices #datacollection #datacollectionservices #bigdataanalytics#statswork #statisticalanalysishelp #statisticalanalyseshelp#spssproject #assignmenthelp #spsshelp #dataanalysis #spsshomeworkhelp #statistics #biostatistics #SPSSAssignmenthelp #SPSShomeworkhelp #SPSShelp #SPSSproject #SPSStutor #OnlineSPSS #SPSShelpUSA #SPSShelpUK #SPSSClasses #statisticsassignmenthelp #statisticshomeworkhelp #statisticstutor #statisticshelp #homeworkhelp #assignmenthelp #rlanguagehelp #rprogramminghelp #rassignmenthelp #rhomeworkhelp #myassignmenthelponline #domyspssassignment
1 note
·
View note
Text
Get Help with your Data Analysis Task

Statistical data analysis is the most crucial parts of every research. However, it is one of the hardest parts in research. The type of data analysis conducted mainly depends on the study’s hypotheses and the nature of research conducted. Most times researchers are often indecisive of whether a study is qualitative or quantitative. A qualitative research is the type of research that is conducted to explore underlying reasons, opinions and motivations. On the other hand, a quantitative research is the type of research that is conducted to solve a problem by generating numeric data. It is often used to quantify attitudes, ideas, behavior. It is for this distinctive difference between the two types of research that their analysis methods differ. Common quantitative data analysis techniques include , Anova test, t-tests, regression and correlation tests.
Freelance data analysis is an online platform available at our website where our clients get to choose and hire our data analyst. Additionally, clients are also able to consult and be advised accordingly in relation to the type of data analysis. Need help? Please visit our website for more details, here is the link;
www.onlinespss.com
or please feel free to email us; E: [email protected]
0 notes
Text
Analysing data using SPSS TYPES OF DATA: Nominal Data: These are data which classify or categorise some attribute they may be coded as numbers but the numbers has no realmeaning, its just a label they have no default or natural order. Examples:, town of residence, colour of car, male or female (this lat one is an example of a dichotomous variable, it can take two mutually exclusive values. Ordinal Data: These are data that can be put in an order, but don’t have a numerical meaning beyond the order. So for instance, the difference between 2 and 4 in the example of a Lickert scale below might no be the same as the difference between 2 and 5. Examples: Questionnaire responses coded: 1 = strongly disagree, 2 = disagree, 3 = indifferent, 4 = agree, 5 = strongly agree. Level of pain felt in joint rated on a scale from 0 (comfortable) to 10 (extremely painful). Interval Data: These are numerical data where the distances between numbers have meaning, but the zero has no real meaning. With interval data it is not meaningful to say than one measurement is twice another, and might not still be true if the units were changed. Example: Temperature measured in Centigrade, a cup of coffee at 80°c isn't twice as hot a one at 40°c. Ratio Data: These are numerical data where the distances between data and the zero point have real meaning. With such data it is meaningful to say that one value is twice as much as another, and this would still be true if the units were changed. Examples: Heights, Weights, Salaries, Ages. If someone is twice as heavy as someone else in pounds, this will still be true in kilograms. How to find out Data Analysis in SPSS Continue Reading; https://www.onlinespss.com/services/spss-analysis/ You can find more information on our website and it is FREE! Click here to visit our web page Please feel free to contact us if you need any further information. Email: [email protected] #SPSSdataanalysis #datamining #dataanalysis #dataanalysisservices #dataanalysisservice #dataanalysisspss #statisticsservice #statisticaldataanalysis #statisticalanalysis #datacollection #statistcalconsulting #statisticalconsultingfirms #data #dataanalyticsspss #dataanalytics #datascience #bigdata #education #SPSSdataanalysis #SPSSdataanalysisservices #datacollection #datacollectionservices #bigdataanalytics #statswork #statisticalanalysishelp #statisticalanalyseshelp #spssproject #assignmenthelp #spsshelp #dataanalysis #spsshomeworkhelp #statistics #biostatistics #SPSSAssignmenthelp #SPSShomeworkhelp #SPSShelp #SPSSproject #SPSStutor #OnlineSPSS #SPSShelpUSA #SPSShelpUK #SPSSClasses #statisticsassignmenthelp #statisticshomeworkhelp #statisticstutor #statisticshelp #homeworkhelp #assignmenthelp #rlanguagehelp #rprogramminghelp #rassignmenthelp #rhomeworkhelp #myassignmenthelponline #domyspssassignment

0 notes
Photo

Do you need help with SPSS?
You can find more information on our website and it is FREE! Click here to visit our web page. www.onlinespss.com
#spssproject #assignmenthelp #spsshelp #dataanalysis #spsshomeworkhelp #statistics #biostatistics #SPSSAssignmenthelp #SPSShomeworkhelp #SPSShelp #SPSSproject #SPSStutor #OnlineSPSS #SPSShelpUSA #SPSShelpUK #SPSSdataanalysis #datamining #SPSSClasses #statisticsassignmenthelp #statisticshomeworkhelp #statisticstutor #statisticshelp #homeworkhelp #assignmenthelp #rlanguagehelp #rprogramminghelp #rassignmenthelp #rhomeworkhelp #myassignmenthelponline #domyspssassignment #domyspsshomework #spsshomework
Submit your request by filling in the accurate details in the form mentioned below. The provided information shall help us allocate an appropriate academic writer to you.
It’s FREE to get a quote for your project! We’ll get in touch with you within 5 minutes!
Here is the link; https://www.onlinespss.com/submit-your-project/
0 notes
Text
This guide will explain, step by step, how to perform SPEARMAN'S RANK CORRELATION TEST in the SPSS statistical software by using an example. The guide will also explain how to perform posthoc tests to investigate significant results further.
https://www.onlinespss.com/how-to-run-spearmans-rank-corre…/ You can find more information on our website and it is FREE! Click here to visit our web page. www.onlinespss.com
#spssproject #assignmenthelp #spsshelp #dataanalysis #spsshomeworkhelp #statistics #biostatistics #SPSSAssignmenthelp #SPSShomeworkhelp #SPSShelp #SPSSproject #SPSStutor #OnlineSPSS #SPSShelpUSA #SPSShelpUK #SPSSdataanalysis #datamining #SPSSClasses #statisticsassignmenthelp #statisticshomeworkhelp #statisticstutor #statisticshelp #homeworkhelp #assignmenthelp #rlanguagehelp #rprogramminghelp #rassignmenthelp #rhomeworkhelp #myassignmenthelponline #domyspssassignment #domyspsshomework #spsshomework
Submit your request by filling in the accurate details in the form mentioned below. The provided information shall help us allocate an appropriate academic writer to you.
It’s FREE to get a quote for your project! We’ll get in touch with you within 5 minutes!
Here is the link; https://www.onlinespss.com/submit-your-project/
0 notes
Text
Need help?
We have been providing online statistics assignment help&project help for years and over that period, we have managed to assist students and businessperson in the following statistics topics:
-SPSS -STATA -AMOS -LISREL -MATLAB -SAS -R STUDIO -E-VIEWS #spssproject #assignmenthelp #spsshelp #dataanalysis #spsshomeworkhelp #statistics #biostatistics #SPSSAssignmenthelp #SPSShomeworkhelp #SPSShelp #SPSSproject #SPSStutor #OnlineSPSS #SPSShelpUSA #SPSShelpUK #SPSSdataanalysis #datamining #SPSSClasses #statisticsassignmenthelp #statisticshomeworkhelp #statisticstutor #statisticshelp #homeworkhelp #assignmenthelp #rlanguagehelp #rprogramminghelp #rassignmenthelp #rhomeworkhelp #myassignmenthelponline #domyspssassignment
Need help? Submit Your Statistics Project-Homework-Assignment Submit your request by filling in the accurate details in the form mentioned below. The provided information shall help us allocate an appropriate academic writer to you. It’s FREE to get a quote for your project! We’ll get in touch with you within 5 minute Here is the link; https://www.onlinespss.com/submit-your-project/
0 notes
Text
What is the Reliability Analysis Test?
How to Run the Reliability Analysis Test in SPSS? How to report the Reliability test for independence results? How to Interpret a Reliability Analysis Results in APA Style?
See more... https://www.onlinespss.com/how-to-run-reliability-analysis…/
#spssproject #assignmenthelp #spsshelp #dataanalysis #spsshomeworkhelp #statistics #biostatistics #SPSSAssignmenthelp #SPSShomeworkhelp #SPSShelp #SPSSproject #SPSStutor #OnlineSPSS #SPSShelpUSA #SPSShelpUK #SPSSdataanalysis #datamining #SPSSClasses #statisticsassignmenthelp #statisticshomeworkhelp #statisticstutor #statisticshelp #homeworkhelp #assignmenthelp #rlanguagehelp #rprogramminghelp #rassignmenthelp #rhomeworkhelp #myassignmenthelponline #domyspssassignment #domyspsshomework #spsshomework
Submit your request by filling in the accurate details in the form mentioned below. The provided information shall help us allocate an appropriate academic writer to you.
It’s FREE to get a quote for your project! We’ll get in touch with you within 5 minutes!
Here is the link; https://www.onlinespss.com/submit-your-project/
0 notes