
takedayasushi
clip
Webの切り抜き等 - innovation, marketing, data, security, gadget, etc. -
253 posts
Don't wanna be here? Send us removal request.
Last Seen Blogs

jimindoingthesplits
never forget jimin can do the splits

h92creation01-blog
Untitled

thegrayd
TheGrayArea

viledictorian
VileDictorian

letusbuildasnowman
Elsanna
Photo

Results of every World Baseball Classic tournament
by u/mzp3256
25 notes
·
View notes
Photo

Who works from home in 2022? Rates by industry
by u/DavidWaldron
25 notes
·
View notes
Photo

Browser Wars Timeline: 1994-2022
Having trouble reading infographic here?
Check out the full size infographic at - https://infographicjournal.com/browser-wars-timeline-1994-2022/
5 notes
·
View notes
Photo

Fruit Efficient-C Analysis
by u/Inevitable-Clue9840
99 notes
·
View notes


Photo

Disney has more subscribers than Netflix now
by u/giteam
24 notes
·
View notes
Photo

Google Flights Search Volume Is Back to Pre-Pandemic Highs
by u/jsiddharth24
15 notes
·
View notes
Photo

If there were only 10 people on earth, this is how wealth would be distributed.
by u/rubenbmathisen
103 notes
·
View notes
Photo
SEO と Content Marketing の深さ具合が凄い(笑)
確かにExpertiseに差が出る感覚はあります

Wondering what it takes to be a Growth Marketer? 🤔 Check out this great infographic of skills and experience one needs to get started! 👇 #growthhacking via @ http://www.liveinfographic.com/ ai-bees, June 03, 2022 at 04:32PM
4 notes
·
View notes
Photo

S&P 500: Male vs. Female CEO via @ http://www.liveinfographic.com/ sikeig, June 03, 2022 at 08:32PM
20 notes
·
View notes
Video
vimeo
チェッカーズ「ジュリアに傷心」MV / Checkers "Julia ni Heartbreak" (1985) Music Video (2022) from ShiShi Yamazaki on Vimeo.
テレビ朝日 "ザ・ニュージックビデオ" 内企画
0 notes
Photo

109 billion people have lived and died. via @ http://www.liveinfographic.com/ lllinayat, March 18, 2022 at 10:21AM
7 notes
·
View notes
Text
アップデート情報
🌟 新機能
Web版で、新しいベータ版投稿エディターの大幅なアップデートが行われています。引き続き、フィードバックをお寄せください!
Web版で読み込み時間を改善するために、一部画像の最適化をテストしています(時々、PNGがJPEGとして扱うわれていることに気づくかもしれません)。
モバイルアプリで、2段階認証設定のロールアウトが完了しました。この設定を表示するには、アプリの最新バージョンを使用する必要があります。
ログインや登録の際にページを移動しなくてすむように、Web版で新たにログインや登録のポップアップが表示されるようになりました。
🛠️ バグ修正
Web版で、質問やフォトセットを含む投稿をクリックリブログしたり、クイック予約投稿したりできない問題が修正されました。
前回お伝えした新しい投稿の検索インデックスの問題は解決され、その期間の投稿が検索できるようになりました。
Web版で、選択したカラーパレットが7日間経つと忘れられてしまう問題が修正されました。
Web版のアクティビティでブログ名をクリックすると、そのブログに移動するようにしました。
Android版Tumblrアプリ(バージョン23.6)で、2段階認証コード入力欄のアクセシビリティが調整されました。
Android版Tumblrアプリ(バージョン23.6)で、クイックリブログ、クイック予約投稿、クイック共有のためのフローティングブログセレクター(投稿にあるそれぞれのアイコンを長押しすると表示されます)が改良されました。
🚧 現在対応中
IFTTTとの連携の新バージョンをロールアウトするため、現在IFTTTと取り組んでいます!先週は、その準備のために既存の連携にいくつかの不具合がありましたが、すでに通常通りに戻りました。
🌱今後の予定
先週はTumblrのHack Weekでした!今週中に@engineeringブログにハイライトを投稿する予定です。
問題が発生していませんか?そんな時は、サポートリクエスト(英語でのみ対応)を送ってください。できるだけ迅速に対応させていただきます。
共有したいフィードバックがありますか?「Work in Progress」ブログ(英語のみ)をチェックして、コミュニティで議論を始めましょう。
35 notes
·
View notes
Photo

What Fruits Are In Season? Easy Reference Chart via @ http://www.liveinfographic.com/ luckprecludes, January 28, 2022 at 10:22PM
9 notes
·
View notes
Text
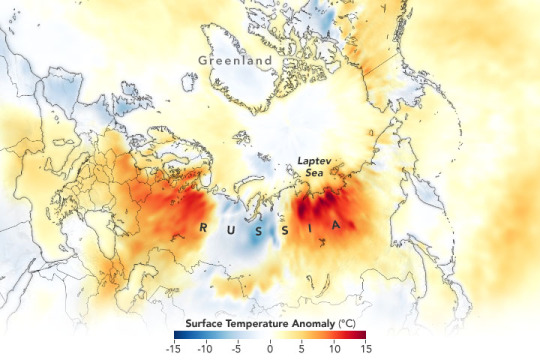
How Climate Change Showed Up in 2021
2021 was tied for the sixth-hottest year since modern record keeping began. We work together with the National Oceanic and Atmospheric Administration to track temperatures around the world and study how they change from year to year.
For decades, the overall global temperature has been increasing because of human activities. The last decade has been the warmest on record. Each individual year’s average temperature, however, can be affected by things like ocean circulation, volcanic eruptions, and specific weather events.
For instance, last year we saw the beginning of La Niña – a pattern of cooler waters in the Pacific – that was responsible for slightly cooling 2021’s average temperature. Still, last year continued a long-term trend of global warming.
Globally, Earth’s temperature in 2021 was nearly 2°F warmer than the late 19th Century, for the seventh year in a row.
The Record
Studying 142 Years
Since 1880, we can put together a consistent record of temperatures around the planet and see that it was much colder in the late-19th century. Before 1880, uncertainties in tracking global temperatures are larger. Temperatures have increased even faster since the 1970s, the result of increasing greenhouse gases in the atmosphere.
Tracking Millions of Individual Observations
Our scientists use millions of individual observations of data from more than 20,000 weather stations and Antarctic research stations, together with ship- and buoy-based observations of sea surface temperatures, to track global temperatures.

Reviewing Multiple Independent Records
Our global temperature record – GISTEMP – is one of a number of independent global temperature records, all of which show the same pattern of warming.
The Consequences
Everywhere Experiences Climate Change Differently
As Earth warms, temperature changes occur unevenly around the globe. The Arctic is currently warming about four times faster than the rest of the planet – a process called Arctic amplification. Similarly, urban areas tend to warm faster than rural areas, partly because building materials like asphalt, steel and concrete retain heat.
Droughts and Floods in Warmer Weather
More than 88% of the Western US experienced drought conditions in 2021. At the same time, communities in Western Europe saw two months’ worth of rain in 24 hours, breaking records and triggering flash floods. Because a hotter climate means more water can be carried in the atmosphere, areas like the Western US suffer drought from the increased 'thirstiness' of the atmosphere, while precipitation events can become more extreme as the amount of moisture in the atmosphere rises.
Sea Levels Continue to Rise
Melting ice raises sea levels around the world, as meltwater drains into the ocean. In addition, heat causes the ocean water to expand. From 1993 to today, global mean sea level has been rising around 3.4 millimeters per year. In 2021, sea level data from the recently launched NASA/ESA Sentinel-6 Michael Freilich mission became available to the public.
There is Hope
“This is not good news, but the fact that we are able to track this in real time and understand why it’s changing, and get people to notice why it’s changing and how we can change things to change the next trajectory, that gives me hope. Because we’re not in the dark here. We’re not the dinosaurs who are unaware the comet is coming. We can see the comet coming, and we can act.” – Dr. Gavin Schmidt, director of NASA GISS, where the global temperature record is calculated
Make sure to follow us on Tumblr for your regular dose of space!
5K notes
·
View notes