
Don't wanna be here? Send us removal request.
Statistics
We looked inside some of the posts by thesis-research and here's what we found interesting.
Average Info
Notes Per Post
0
Likes Per Post
0
Reblog Per Post
0
Reply Per Post
0
Time Between Posts
16 days
Number of Posts By Type
Text
3
Last Seen Tumblr Blogs


Fun Fact
Tumblr was the first site to host the blog for President Barack Obama in 2011.
Text
Battle our neighborhoods - My blog
Introduction
New York City's demographics show that it is a large and ethnically diverse metropolis. It is the largest city in the United States with a long history of international immigration. New York City was home to nearly 8.5 million people in 2014, accounting for over 40% of the population of New York State and a slightly lower percentage of the New York metropolitan area, home to approximately 23.6 million. Over the last decade the city has been growing faster than the region. The New York region continues to be by far the leading metropolitan gateway for legal immigrants admitted into the United States.
Throughout its history, New York City has been a major point of entry for immigrants; the term "melting pot" was coined to describe densely populated immigrant neighborhoods on the Lower East Side. As many as 800 languages are spoken in New York, making it the most linguistically diverse city in the world. English remains the most widely spoken language, although there are areas in the outer boroughs in which up to 25% of people speak English as an alternate language, and/or have limited or no English language fluency. English is least spoken in neighborhoods such as Flushing, Sunset Park, and Corona.
With it's diverse culture , comes diverse food items. There are many resturants in New york City, each beloning to different categories like Chinese , Indian , French etc.
So as part of this project , we will list and visualize all major parts of New York City that has great indian resturants.
Data
For this project we need the following data :
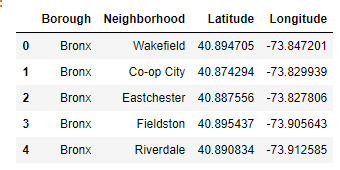
New York City data that contains list Boroughs, Neighborhoods along with their latitude and longitude.
Indian resturants in each neighborhood of new york city.
GeoSpace data
Data source : https://cocl.us/new_york_dataset
Description : This data set contains the required information. And we will use this data set to explore various neighborhoods of new york city.
Data source : Fousquare API
Description : By using this api we will get all the venues in each neighborhood. We can filter these venues to get only indian resturants.
Data source : https://data.cityofnewyork.us/City-Government/Borough-Boundaries/tqmj-j8zm
Description : By using this geo space data we will get the New york Borough boundaries that will help us visualize choropleth map.
Approach
Collect the new york city data from https://cocl.us/new_york_dataset
Using FourSquare API we will find all venues for each neighborhood.
Filter out all venues that are Indian Resturants.
Find rating , tips and like count for each Indian Resturants using FourSquare API.
Using rating for each resturant , we will sort that data.
Visualize the Ranking of neighborhoods using folium library(python)
Questions that can be asked using the above mentioned datasets
What is best location in New York City for Indian Cuisine ?
Which areas have potential Indian Resturant Market ?
Which all areas lack Indian Resturants ?
Which is the best place to stay if I prefer Indian Cuisine ?
Analysis
We will import the required libraries for python.
pandas and numpy for handling data.
request module for using FourSquare API.
geopy to get co-ordinates of City of New York.
folium to visualize the results on a map
Through analysis I got to know there are total of 306 different Neighborhoods in New York
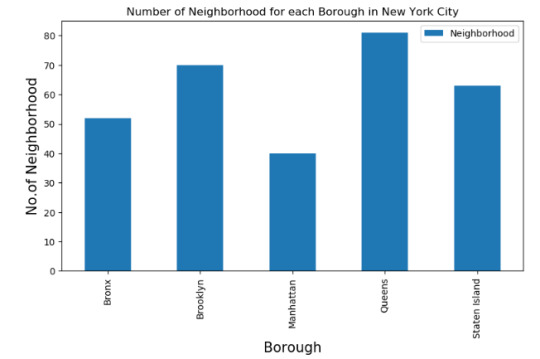
The above chart shows that Queens has highest number of neighborhoods. Now we will collect Indian restaurants for each Neighborhood.
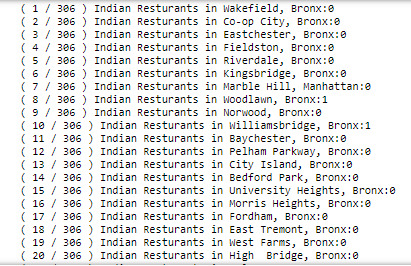
Now that we have got all the indian restaurants in new york city , we will analyze it.
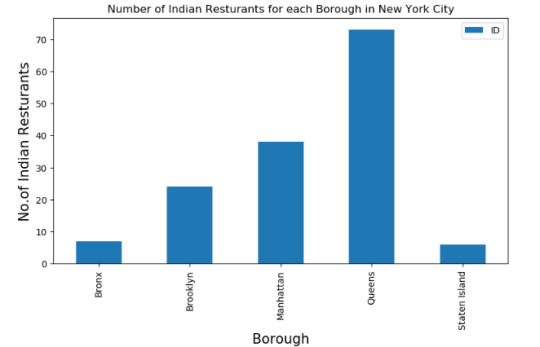
We see that Queens has the largest number of Indian restaurants.
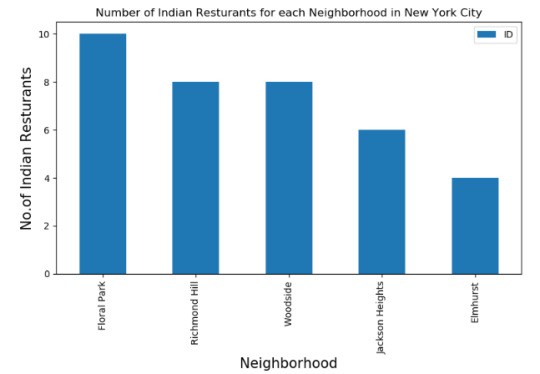
So Floral Park in Queens has the highest number of Indian Resturants with a total count of 9.
Now we will get the ranking of each resturant for further analysis.
Conclusion
Astoria(Queens), Blissville(Queens), Civic Center(Manhattan) are some of the best neighborhoods for indian cuisine.
Manhattan have potential Indian Restaurant Market/
Staten Island ranks last in average rating of Indian Restaurants.
Manhattan is the best place to stay if you prefer Indian Cuisine.
Limitations
The ranking is purely on basis of rating of restaurants
The accuracy of data depends purely depends on the data provided by FourSquare
0 notes
Text
My first program in Python
Hi All,
I have created my first python program. It was related to the total number of tickets created in a helpdesk. This is my actual work on a daily basis so that it will be easy for me to interpret with the details
I have created the report in such a way that it pulls the below data.
To find the number of rows & columns in the data file
Column names list
Complete info about the file
List of data with Priority details listed
List of data with Technician details listed
Finally a table which displays data that falls under priority “P2″ for Technician “App Support Tier1″
Number of rows & columns of the data which has the abouve data
Program

Result
The attached screenshot shows the entire results Also there is no error which can be seen.

Variables
Based on my above program, the reports are run without any error.
The variables I have used are , Priority & Technician in this case.
So missing values can be used in such a way that, if P2 tickets for App support are missing then it can be calculated by deducted the rows count of whole data minus the rows count of selected data.
0 notes
Text
Relationship between online food delivery and Obesity
Introduction
The topic I would like to research is Obesity which is a burning issue now as almost 30% of the world adult population is obese.I wanted to research an associated cause to this obesity. Of Course there might be lot of causes associating with obesity which includes stress, lifestyle and many more. But I would like to concentrate on the online food delivery which even though is not directly linked to obesity, it is a silent factor that is associated with obesity.
Hypothesis - Obesity linked with Online food delivery
Individual dietary macronutrients have each been theorized to be the prime culprit for population obesity, but these explanations are unlikely. Rather, obesity probably resulted from changes in the caloric quantity and quality of the food supply in concert with an industrialized food system that produced and marketed convenient, highly processed foods from cheap agricultural inputs. Such foods often contain high amounts of salt, sugar, fat, and flavor additives and are engineered to have supernormal appetitive properties driving increased consumption. Ubiquitous access to convenient and inexpensive food also changed normative eating behavior, with more people snacking, eating in restaurants, and spending less time preparing meals at home. While such changes in the food environment provide a likely explanation of the obesity epidemic, definitive scientific demonstration is hindered by the difficulty in experimentally isolating and manipulating important variables at the population level.
Data sets used
I would like to analyse the data sets like
Population involved in buying online foods
Age group that are interested in online foods
What food do they prefer the most
Which age group prefers what food
What time do they usually crave for food
Why do they go for online food delivery
Category of group whether men or women
Whether working group or students or homemaker
Bibliography
https://books.google.co.in/books?hl=en&lr=&id=JR8DhPHpC_AC&oi=fnd&pg=PP9&dq=thesis+on+obesity&ots=47OIokYf7J&sig=6FOF5-0WOvlOoDwAT8vujZ0DyEc#v=onepage&q&f=false
https://www.sciencedirect.com/science/article/abs/pii/S0749379712001468
0 notes