
Don't wanna be here? Send us removal request.
Statistics
We looked inside some of the posts by waywardtheoristartisan-blog and here's what we found interesting.
Average Info
Notes Per Post
1
Likes Per Post
1
Reblog Per Post
0
Reply Per Post
0
Time Between Posts
8 days
Number of Posts By Type
Text
5
Last Seen Tumblr Blogs


Fun Fact
If you dial 1-866-584-6757, you can leave an audio post for your followers.
Text
MY SUBMISSION
Python Program
import pandas as pd
import numpy as np
import seaborn as sb
import matplotlib.pyplot as plt
# load gapminder dataset
data = pd.read_csv('gapminder.csv',low_memory=False)
# lower-case all DataFrame column names
data.columns = map(str.lower, data.columns)
# bug fix for display formats to avoid run time errors
pd.set_option('display.float_format', lambda x:'%f'%x)
# setting variables to be numeric
data['suicideper100th'] = data['suicideper100th'].convert_objects(convert_numeric=True)
data['breastcancerper100th'] = data['breastcancerper100th'].convert_objects(convert_numeric=True)
data['hivrate'] = data['hivrate'].convert_objects(convert_numeric=True)
data['employrate'] = data['employrate'].convert_objects(convert_numeric=True)
# display summary statistics about the data
# print("Statistics for a Suicide Rate")
# print(data['suicideper100th'].describe())
# subset data for a high suicide rate based on summary statistics
sub = data[(data['suicideper100th']>12)]
#make a copy of my new subsetted data
sub_copy = sub.copy()
# Univariate graph for breast cancer rate for people with a high suicide rate
plt.figure(1)
sb.distplot(sub_copy["breastcancerper100th"].dropna(),kde=False)
plt.xlabel('Breast Cancer Rate')
plt.ylabel('Frequency')
plt.title('Breast Cancer Rate for People with a High Suicide Rate')
# Univariate graph for hiv rate for people with a high suicide rate
plt.figure(2)
sb.distplot(sub_copy["hivrate"].dropna(),kde=False)
plt.xlabel('HIV Rate')
plt.ylabel('Frequency')
plt.title('HIV Rate for People with a High Suicide Rate')
# Univariate graph for employment rate for people with a high suicide rate
plt.figure(3)
sb.distplot(sub_copy["employrate"].dropna(),kde=False)
plt.xlabel('Employment Rate')
plt.ylabel('Frequency')
plt.title('Employment Rate for People with a High Suicide Rate')
# Bivariate graph for association of breast cancer rate with HIV rate for people with a high suicide rate
plt.figure(4)
sb.regplot(x="hivrate",y="breastcancerper100th",fit_reg=False,data=sub_copy)
plt.xlabel('HIV Rate')
plt.ylabel('Breast Cancer Rate')
plt.title('Breast Cancer Rate vs. HIV Rate for People with a High Suicide Rate')
# END
Output

This graph is unimodal, with its highest pick at 0-20% of breast cancer rate. It seems to be skewed to the right as there are higher frequencies in lower categories than the higher categories.

This graph is unimodal, with its highest pick at 0-1% of HIV rate. It seems to be skewed to the right as there are higher frequencies in lower categories than the higher categories.

This graph is unimodal, with its highest pick at the median of 55-60% employment rate. It seems to be a symmetric distribution as there are lower frequencies in lower and higher categories.
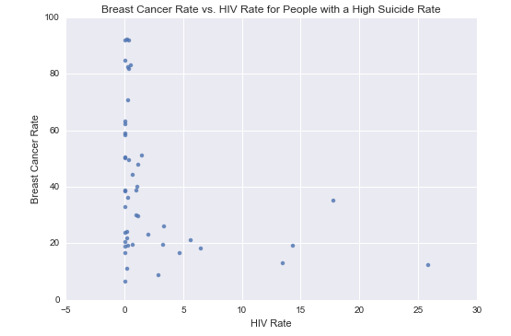
This graph plots the breast cancer rate vs. HIV rate for people with a high suicide rate. It shows that people with breast cancer are not infected with HIV.
-------------------------------------------------------------------------
0 notes
Text
Tanmay Bhat turns 33: Know how well-educated your favourite stand-up comedian are!
Tanmay Bhat, who turns 33 today, is a Bachelor Degree in Advertising. Check out the list of other comedians and their educational qualification.
Stand-up Comedy has caught up with the Indian youth big time in the past few years. With YouTube gaining popularity a whole new generation of comedians has emerged. The success of these stand-up comedians comes from their ability to connect with their audience through their unique content.
1)The Laughing Buddha-Tanmay Bhatt
Tanmay Bhat is an Indian YouTuber, stand-up comedian, script writer, performer, producer, and cofounder of the creative agency All India Bakchod (AIB) along with Gursimranjeet Singh Khamba. Bhat went to Seth Chunilal Damodardas Barfiwala Highschool, Mumbai. He was a hard-working student and would top in his school and college. Initially, he wanted to become a Marine Engineer but later he realized his true passion was comedy and geared his career accordingly.
2)The Relatable-Abhishek Upmanyu
Abhishek Upamanyu’s USP is his reliability. He is a native of Delhi but is currently settled in Mumbai to pursue stand-up comedy. This combination of residencies allows him to bring out the reality of traveling and living in both cities using humorous analogies and stark poker faces. He has done B.E in chemical engineering from Punjab university.
3)The Sakt Laund-Zakir Khan
Zakir Khan rose to fame after winning Comedy Central’s ‘India’s Best Stand-up Comedian’ in 2012. He gained more popularity after working closely with AIB’s news show- On Air with AIB. Zakir’s USP is his language, keeping topics light and his constant attempt to console himself about never wooing a girl. He has done his schooling at St. Paul Higher secondary school, Indore. He is a college dropout he discontinued his B. Com degree.
4)The Unpredictable-Kunal Kamra
Kunal Kamra used Twitter to gain popularity. In 2013 he began tweeting his jokes. With the positive response received he started his YouTube chat series called ‘Shut up Ya Kunal’. This led him to becoming a widely popular Indian stand-up comedian and social media star who found his biggest following on YouTube. Kamra grew up in Mumbai, and joined Jai Hind College for a degree in commerce. He dropped in second year to start working as a production assistant in Prasoon Pandey’s ad film production house Corcoise Films, where he stayed for eleven years.
5) Being Bassi-Anubhav Singh Bassi
Anubhav Singh Bassi from being a lawyer, a UPSC aspirant, to opening a food business with friends to eventually ending up on stage as a stand-up comedian, Anubhav Singh Bassi journey has been equivalent to that of a roller coaster. He had done his schooling at Dewan Public School, Meerut. He did his LLB degree from Dr.Ram Manohar Lohiya National Law University Lucknow, Uttar Pradesh.
5)The Feminist-Aditi Mittal
Aditi Mittal is one of the first female stand-up comedians in India. She is a comedian as well as a successful writer as she has written columns for Grazia Magazine, DNA, FirstPost.com and Financial Times. She has done her Graduation in Mass Communication Performing Arts from Fairleigh Dickinson University, Canada, USA.
XPERT APP LINK:Hey,Be it Ratan Tata for business or Sachin Tendulkar for cricket, Xpert helps you follow, ask & learn from the best in every profession. Try it: https://xpert.page.link/7a9L and use my invite code x5ev to signup!
0 notes
Text
CASE STUDY OF NESARC DATA
CODE:
import pandas import numpy data = pandas.read_csv('nesarc_pds.csv', low_memory=False) sub1=data[(data['AGE']>=18)&(data['AGE']<=25)&(data['CHECK321']==1)] sub2=sub1.copy() print('count for original S3AQ3B1') c1=sub2['S3AQ3B1'].value_counts(sort=False) print(c1) sub2['S3AQ3B1']=sub2['S3AQ3B1'].replace(9,numpy.nan) print('count for S3AQ3B1,with 9 set for nan') c2=sub2['S3AQ3B1'].value_counts(sort=False,dropna=False) print(c2) print('count for original S3AQ3C1') c4=sub2['S3AQ3C1'].value_counts(sort=False) print(c4) sub2['S3AQ3C1']=sub2['S3AQ3C1'].replace(99,numpy.nan) print('count for S3AQ3C1,with 99 set for nan') c3=sub2['S3AQ3C1'].value_counts(sort=False,dropna=False) print(c3) print('count for original TAB12MDX') c5=sub2['TAB12MDX'].value_counts(sort=False) print(c5) data.loc[(data['S2AQ3']!=9)& (data['S2AQ8A'].isnull()),'S2AQ8A']=11
recode1 = {1: 6,2: 5,3: 4,4: 3,5: 2,6: 1} sub2['USFREQ']=sub2['S3AQ3B1'].map(recode1) print('percentage fir S3AQ3B1') p7=sub2['USFREQ'].value_counts(sort=False,normalize=True) print(p7) sub2['NUMCIGMO_EST']=sub2['USFREQ']*sub2['S3AQ3C1'] sub3=sub2[['IDNUM','S3AQ3C1','USFREQ','NUMCIGMO_EST']] u=sub3.head(25) print(u)
OUTPUT:
count for original S3AQ3B1 1.0 1320 2.0 68 4.0 88 3.0 91 5.0 65 6.0 71 9.0 3 Name: S3AQ3B1, dtype: int64 count for S3AQ3B1,with 9 set for nan 1.0 1320 2.0 68 4.0 88 3.0 91 5.0 65 6.0 71 NaN 3 Name: S3AQ3B1, dtype: int64 count for original S3AQ3C1 3.0 114 10.0 387 20.0 365 5.0 163 8.0 42 1.0 83 2.0 111 98.0 1 30.0 38 4.0 84 12.0 25 6.0 60 13.0 7 7.0 45 15.0 99 40.0 30 14.0 3 11.0 3 60.0 2 17.0 2 25.0 13 16.0 5 27.0 1 80.0 1 9.0 6 35.0 1 24.0 1 19.0 1 18.0 3 28.0 1 99.0 9 Name: S3AQ3C1, dtype: int64 count for S3AQ3C1,with 99 set for nan 3.0 114 10.0 387 20.0 365 5.0 163 8.0 42 1.0 83 2.0 111 98.0 1 30.0 38 4.0 84 12.0 25 NaN 9 6.0 60 13.0 7 7.0 45 15.0 99 40.0 30 14.0 3 11.0 3 60.0 2 17.0 2 25.0 13 16.0 5 27.0 1 80.0 1 9.0 6 35.0 1 24.0 1 19.0 1 18.0 3 28.0 1 Name: S3AQ3C1, dtype: int64 count for original TAB12MDX 0 810 1 896 Name: TAB12MDX, dtype: int64 percentage fir S3AQ3B1 6.0 0.775103 5.0 0.039930 3.0 0.051674 4.0 0.053435 2.0 0.038168 1.0 0.041691 Name: USFREQ, dtype: float64 IDNUM S3AQ3C1 USFREQ NUMCIGMO_EST 20 21 3.0 6.0 18.0 76 77 3.0 5.0 15.0 102 103 10.0 6.0 60.0 121 122 10.0 6.0 60.0 135 136 20.0 6.0 120.0 149 150 5.0 6.0 30.0 154 155 8.0 6.0 48.0 173 174 1.0 6.0 6.0 177 178 10.0 6.0 60.0 183 184 20.0 6.0 120.0 187 188 2.0 3.0 6.0 209 210 3.0 6.0 18.0 219 220 5.0 4.0 20.0 222 223 1.0 6.0 6.0 278 279 98.0 6.0 588.0 336 337 20.0 6.0 120.0 363 364 20.0 6.0 120.0 398 399 2.0 5.0 10.0 412 413 5.0 6.0 30.0 417 418 20.0 6.0 120.0 508 509 30.0 6.0 180.0 511 512 1.0 2.0 2.0 519 520 20.0 6.0 120.0 522 523 10.0 6.0 60.0 529 530 4.0 6.0 24.0
1)PRIMARY VARIABLE
A)S3AQ3B1 -frequency of cigarettes based on number of days
B)S3AQ3B1 -frequency of cigarette based on number of cigarette consumed
C)TAB12MDX -tobacco consumption(1-yes,0-no)
2)SECONDARY VARIABLE:
A)NUMCIGMO_EST -estimated number of cigarette consumed in 1 month
B)USFREQ -frequency of cigarette consumed per day
3)HERE WE ALSO USED NAN WHERE USER WAS NOT CONFIRMED ABOUT HIS CIGARETTE CONSUMPTION PATTERN.
0 notes
Text
PROJECT REPORT
code:
import pandas import numpy data = pandas.read_csv('nesarc_pds.csv', low_memory=False) print(len(data)) print(len(data.columns)) c1=data["TAB12MDX"].value_counts(sort=False) print(c1) p1=data["TAB12MDX"].value_counts(sort=False, normalize=True) print(p1) c2=data["S3AQ3C1"].value_counts(sort=False) print(c2) p2=data["S3AQ3C1"].value_counts(sort=False, normalize=True) print(p2) c3=data["S3AQ3C2"].value_counts(sort=False) print(c3) p3=data["S3AQ3C2"].value_counts(sort=False, normalize=True) print(p3) sub1=data[(data['AGE']>=18)&(data['AGE']<=25)&(data['CHECK321']==1)] sub2=sub1.copy()
output:
43093 3010 0 38131 1 4962 Name: TAB12MDX, dtype: int64 0 0.884854 1 0.115146 Name: TAB12MDX, dtype: float64 20.0 5366 2.0 884 1.0 934 4.0 573 8.0 299 16.0 40 24.0 7 57.0 1 50.0 106 9.0 49 22.0 10 27.0 2 98.0 15 5.0 1070 18.0 59 14.0 25 80.0 47 66.0 1 29.0 3 33.0 1 99.0 262 11.0 23 37.0 2 55.0 2 25.0 155 3.0 923 10.0 3077 6.0 463 12.0 230 75.0 2 17.0 22 13.0 34 34.0 1 60.0 241 45.0 8 19.0 5 35.0 30 7.0 269 30.0 909 40.0 993 28.0 3 21.0 1 70.0 12 15.0 851 23.0 2 39.0 1 Name: S3AQ3C1, dtype: int64 20.0 0.297896 2.0 0.049076 1.0 0.051851 4.0 0.031810 8.0 0.016599 16.0 0.002221 24.0 0.000389 57.0 0.000056 50.0 0.005885 9.0 0.002720 22.0 0.000555 27.0 0.000111 98.0 0.000833 5.0 0.059402 18.0 0.003275 14.0 0.001388 80.0 0.002609 66.0 0.000056 29.0 0.000167 33.0 0.000056 99.0 0.014545 11.0 0.001277 37.0 0.000111 55.0 0.000111 25.0 0.008605 3.0 0.051241 10.0 0.170821 6.0 0.025704 12.0 0.012769 75.0 0.000111 17.0 0.001221 13.0 0.001888 34.0 0.000056 60.0 0.013379 45.0 0.000444 19.0 0.000278 35.0 0.001665 7.0 0.014934 30.0 0.050464 40.0 0.055127 28.0 0.000167 21.0 0.000056 70.0 0.000666 15.0 0.047244 23.0 0.000111 39.0 0.000056 Name: S3AQ3C1, dtype: float64 12 12 3 155 20 17 13 1 7 7 4 69 11 1 98 1 24 1 15 13 2 323 25 2 40360 10 42 30 1 9 1 5 99 40 5 50 4 99 90 8 8 1 1837 6 44 Name: S3AQ3C2, dtype: int64 12 0.000278 3 0.003597 20 0.000394 13 0.000023 7 0.000162 4 0.001601 11 0.000023 98 0.000023 24 0.000023 15 0.000302 2 0.007495 25 0.000046 0.936579 10 0.000975 30 0.000023 9 0.000023 5 0.002297 40 0.000116 50 0.000093 99 0.002089 8 0.000186 1 0.042629 6 0.001021 Name: S3AQ3C2, dtype: float64
CHECK321:IF CIGARETTE DRUNK IN LAST 12 MONTH
S3AQ3C2 :FREQUENCY WHEN SMOKED CIGARETTE
S3AQ3C1 :QUANTITY OF SMOKE CIGARETTE
0 notes
Text
After looking through the codebook for the this course provided in course itself,i have choose gapminder codebook,i am interested in finding whether the suicide rate in any country is associated with employment rate or not/
It is a common belief that if a person is having his job and earns adequate amount of income,he might be stress free,but according to me even though a person mat be employed but it might even be possible that still is suffering from such a high level of stress that he/she may commit suicide for work/family reasons.
In developed countries employment rate may be high but still in some cases even suicide rate may also be high,so in my data analytics i will try to put forward result in front of people and maybe clear some of their misconceptions.
In my codebook i will include following variables:
1)country name
2)employment rate
3)suicide per 100 persons
4)alcohol consumption
5)income per person
6)life expectancy
7)CO2 emission
My second topic will be comparison between life expectancy,alcohol consumption,CO2 emission,income per person.
questions related to second topic:
1)Whether country having only high per person income consumes more alcohol or not?
2)Whether CO2 emission plays a major role in decreasing life expectancy?
1 note
·
View note