
A data scientist's microblog with events, project updates, interesting links and reads. Also @piccolbo
Don't wanna be here? Send us removal request.
Statistics
We looked inside some of the posts by workstream-piccolbo and here's what we found interesting.
Average Info
Notes Per Post
0
Likes Per Post
0
Reblog Per Post
0
Reply Per Post
0
Time Between Posts
13 days
Number of Posts By Type
Text
2
Quote
9
Link
3
Video
1
Photo
2
Last Seen Tumblr Blogs


Fun Fact
1,644 Tumblr posts in 1 second.
Text
What turned California forests into a tinderbox? Fire suppression, paradoxically | Valerie Trouet | Opinion | The Guardian
0 notes
Text
Share via
drive-through sites see only children 5 and older.
And people wonder why there are fewer pediatric covid cases.
0 notes
Quote
We’ve always walked into this with our eyes wide open. We’ve always prepared for a surge. [...] We’re in that band, where I feel like we anticipated the likelihood as we’ve reopened, of the numbers increasing, and they have. -- Gov. Newsom
In case anyone thought the the current worsening of the situation in CA is an accident. Here is the Governor himself planning it out, on 6/22.
0 notes
Quote
Deaths from COVID-19 represent a substantial burden in terms of per-person YLL, more than a decade, even after adjusting for the typical number and type of LTCs found in people dying of COVID-19
Years of Life Lost is one statistics that approximates our subjective perception that the loss of a young life is more tragic than that of an old person. Between the extremes of therapeutic obstinacy and callous statements like "they were about to die anyway", YLL estimates for COVID-19 deaths are a rational approach to the subject. COVID-19 – exploring the... | Wellcome Open Research
0 notes
Quote
The true number of next-day deaths has been outside the 95% intervals 70% of the time.
Influential Covid-19 model shouldn't guide U.S. policies, critics say - STAT
0 notes
Quote
Nationally, the percentage of visits for influenza-like illness (ILI) and COVID-19-like illness (CLI) is elevated compared to what is normally seen at this time.
COVIDView | CDC This mother of all understatements gives me great confidence the CDC is on top of the situation.
0 notes
Quote
CONCLUSIONS/SIGNIFICANCE: Any type of general mask use is likely to decrease viral exposure and infection risk on a population level, in spite of imperfect fit and imperfect adherence, personal respirators providing most protection. Masks worn by patients may not offer as great a degree of protection against aerosol transmission.
Professional and home-made face masks reduce exposure to respiratory infections among the general population. - PubMed - NCBI
0 notes
Quote
the second rise in deaths only appeared when cities removed social distancing measures,
Coronavirus: Trump’s Easter timeline for social distancing is dangerous - Vox
0 notes
Quote
"I don't think shelter in place really works for one locality," Governor Cuomo said in an interview
What a difference two days make for a mediocre politician facing an exponential curve.
Cuomo dismisses idea of NYC order to shelter in place - CBS News
New York governor orders shutdown of all nonessential businesses
0 notes
Quote
Here’s another case where the Spanish flu can teach us a valuable lesson. In 1918, ignoring warnings, the city of Philadelphia threw a parade to support the war effort. [...] In contrast, the city of St. Louis played things safe by preemptively closing schools, playgrounds, libraries, and churches.
What the 1918 Spanish Flu Pandemic Can Teach Us About Coronavirus
0 notes
Video
youtube
"The only thing to fear is lack of fear itself". Compare that with world leaders talking about avoiding panic.
(via Exponential growth and epidemics - YouTube)
0 notes
Link
Frustrated with Johns Hopkins minimal trend presentation, I built my own. Data is the same, accessed through https://github.com/RamiKrispin/coronavirus
Smoothing done at ggplot2 defaults, may be more confusing than helpful at the low end. Fails for low values, turned off when smoothing = 0. The minimum number cursor allows you to include more countries, but the display gets a bit crowded.
0 notes
Photo
Internationally covid-19 cases took 20 days to go from 100 to 1000 but only 15 to reach 10000. There are only 6 orders of magnitude to go before exceeding the human population, that is 90 days if this faster rate doesn't change. Of course herd immunity and/or prevention measures will bend the curve at some point as China managed to do, but no sign so far.
0 notes
Link
0 notes
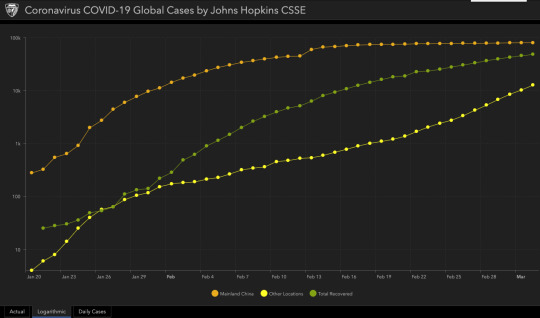
Photo

The Chinese must be doing something right, and we'd better take a close look. Rest of the world still on a bad trajectory. Orange is cumulative cases in China, green recoveries therein, yellow cumulative cases internationally. In log scale, a constant slope means a constant percent increase. Keep in mind that these are confirmed, reported cases. Best epidemiological estimates are much higher -- which is good and bad because it means most cases are mild but go undetected.
0 notes
Quote
that leaves companies with only one justification for moving to an open plan office: less floor space, and therefore a lower rent.
It's Official: Open-Plan Offices Are Now the Dumbest Management Fad of All Time | Inc.com
0 notes