
Statistics
We looked inside some of the posts by zaworm and here's what we found interesting.
Average Info
Notes Per Post
1
Likes Per Post
1
Reblog Per Post
0
Reply Per Post
0
Time Between Posts
11 days
Number of Posts By Type
Text
17
Last Seen Tumblr Blogs


Fun Fact
70% of Tumblr users say the Dashboard is their favorite place to spend time online.
Text
Practice Peer-graded Assignment: Milestone Assignment 1: Title and Introduction to the Research Question
1) Title: Net national income per capita and its association with key predictors
2) I have chosen the World Bank capstone data set and the question I would like to answer is: are there key predictors that influence the net national income per capita and can these indicators be used by other countries to make adjustments such that they can increase their income.
3) The motivation to answer this question is to see if there are achievable goals that can be set by poorer countries to increase their income and in the end ultimately help their citizens and reduce poverty.
4) The potential implications of answering this question would be to benefit the poorer citizens around the world. Ultimately poorer countries may be able to look at what increases their nations income and what activities may be wasting and not contributing to income per capita. The goal would be to reduce poverty of capable countries or for countries to increase their income.
0 notes
Text
Machine Learning for Data Analysis Week 4 Running a k-means Cluster Analysis
1.Background
I have decided to look at Mars craters and ask the following question:
A. Is the depth dependant on the diameter of the crater?
B. Is the depth dependant on the latitude? Are craters closer to the poles shallower?
2.Notes about the Results
* see section 3 for full code and section 4 for code output
The dataset was limited to craters that had a diameter of 100 km or less and a crater depth that was greater than 0 km.
Shallow craters were defined as craters with a depth of 180m (0.18km) or less. This was the binary response variable.
Craters close to the pole were defined +-40 poleward (ie craters that were not close to the pole had latitudes of -60 to +60 degrees). The latitude variable was classified as 0 if the craters were close to the pole and 1 if they were not close to the poles. This was a binary explanatory variable (=1 IS_NOT_NEAR_POLES)
Wide Diameter craters were defined as craters that had a diameter larger than 5km. (=1 IS_WIDE_CRATER)
A k-means cluster analysis was conducted to identify underlying subgroups of craters based on their similarity of responses on 5 variables that represent characteristics:IS_WIDE_CRATER, IS_NOT_NEAR_POLES, LONGITUDE_CIRCLE_IMAGE, DIAM_CIRCLE_IMAGE, LATITUDE_CIRCLE_IMAGE All clustering variables were standardized to have a mean of 0 and a standard deviation of 1.
Data were randomly split into a training set that included 70% of the observations and a test set that included 30% of the observations. A series of k-means cluster analyses were conducted on the training data specifying k=1-9 clusters, using Euclidean distance. The variance in the clustering variables that was accounted for by the clusters (r-square) was plotted for each of the nine cluster solutions in an elbow curve to provide guidance for choosing the number of clusters to interpret.
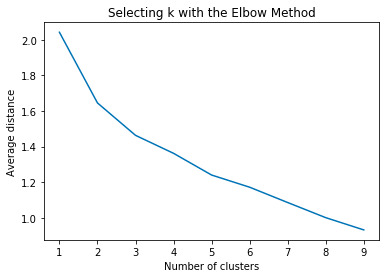
Figure 1. Elbow curve of r-square values for the nine cluster solutions
The elbow curve was inconclusive, suggesting that the 2,3 and 5-cluster solutions might be interpreted. The results below are for an interpretation of the 3-cluster solution.
Canonical discriminant analyses was used to reduce the 5 clustering variable down a few variables that accounted for most of the variance in the clustering variables. A scatterplot of the first two canonical variables by cluster (Figure 2 shown below) indicated the observations.
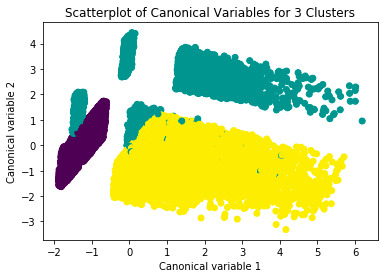
Figure 2. Plot of the first two canonical variables for the clustering variables by cluster.
In order to externally validate the clusters, an Analysis of Variance (ANOVA) was conducting to test for significant differences between the clusters on crater depth. A tukey test was used for post hoc comparisons between the clusters. Results indicated significant differences between the clusters on crater depth
cluster 0 0.233786 1 0.247493 2 0.508011 standard deviations for DEPTH_RIMFLOOR_TOPOG by cluster DEPTH_RIMFLOOR_TOPOG cluster 0 0.164277 1 0.335329 2 0.411583 Multiple Comparison of Means - Tukey HSD, FWER=0.05 ================================================== group1 group2 meandiff p-adj lower upper reject -------------------------------------------------- 0 1 0.0137 0.0239 0.0014 0.026 True 0 2 0.2742 0.001 0.2672 0.2813 True 1 2 0.2605 0.001 0.2485 0.2725 True --------------------------------------------------
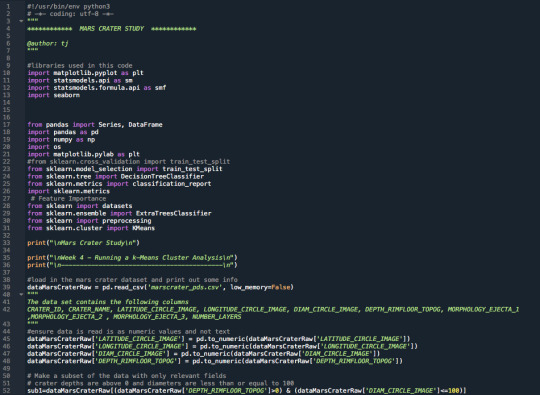
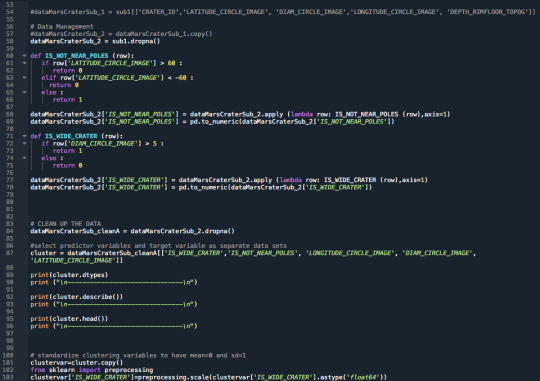
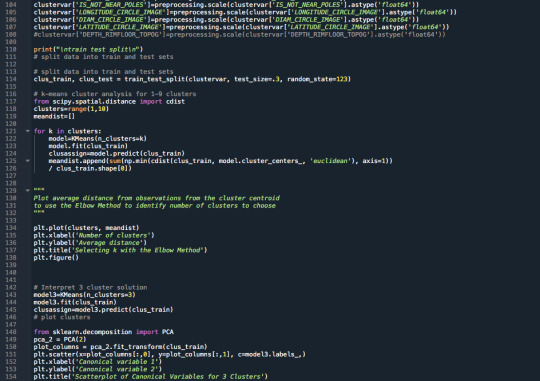
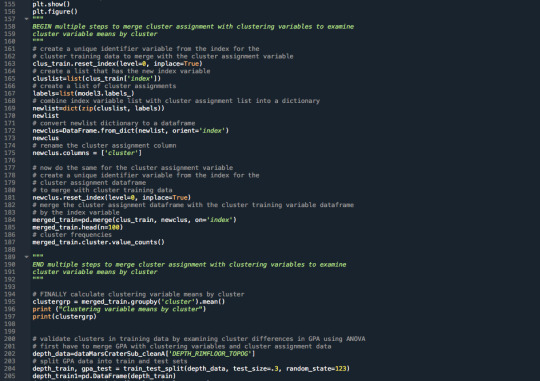
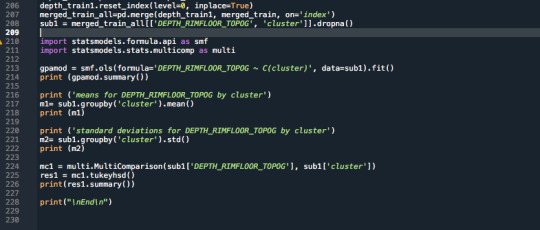
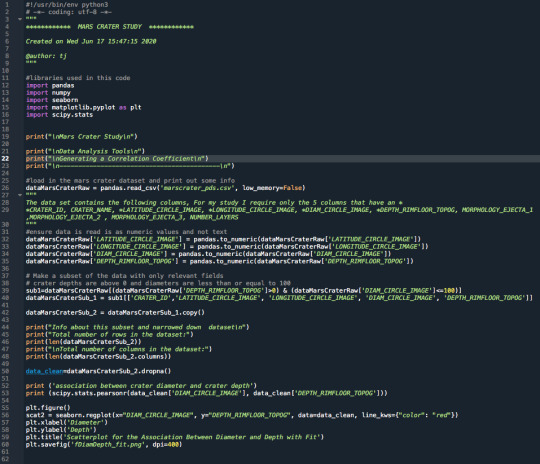
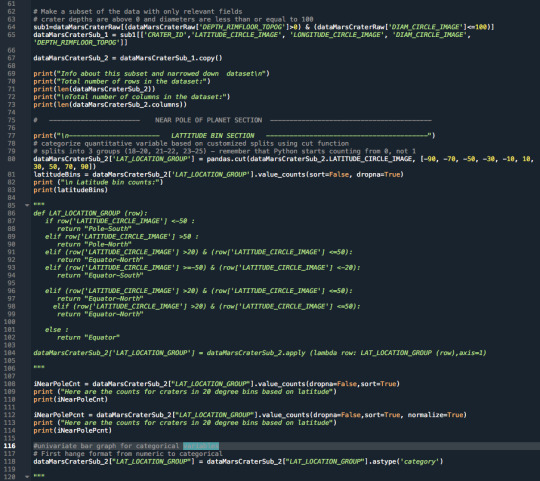
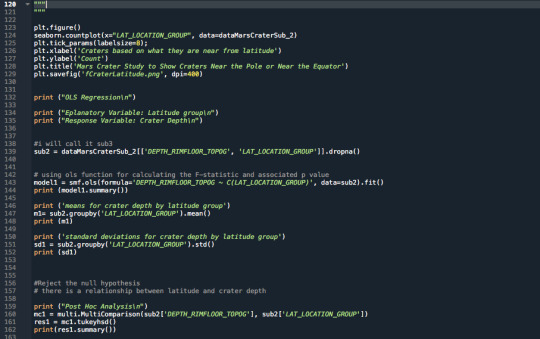
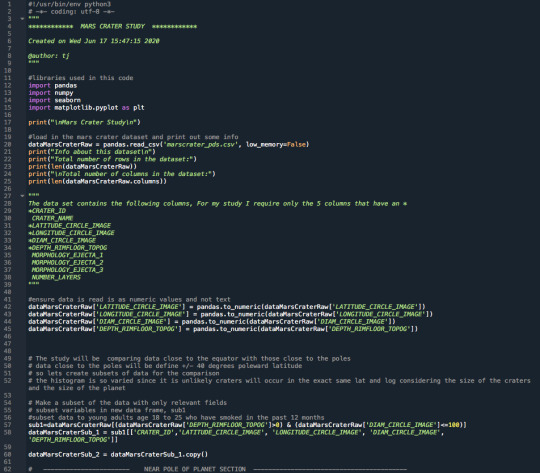
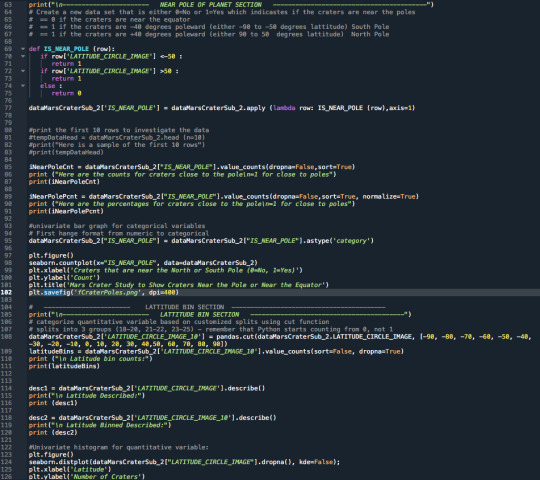
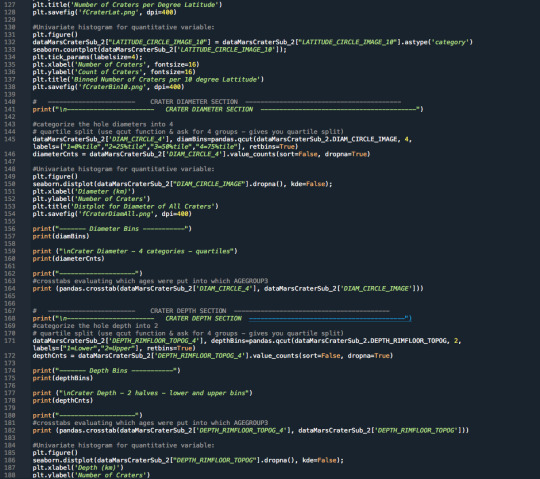
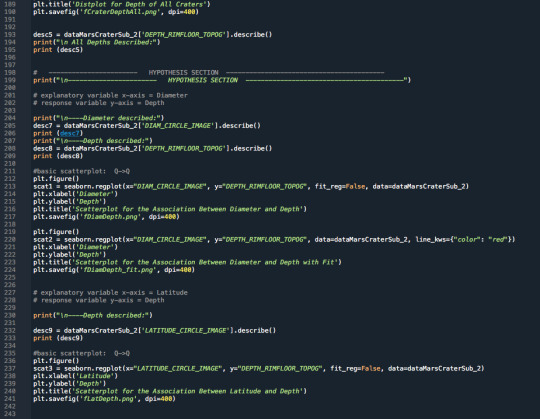
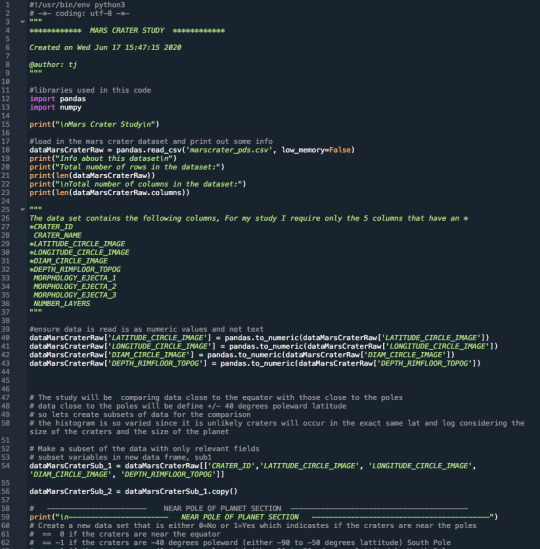
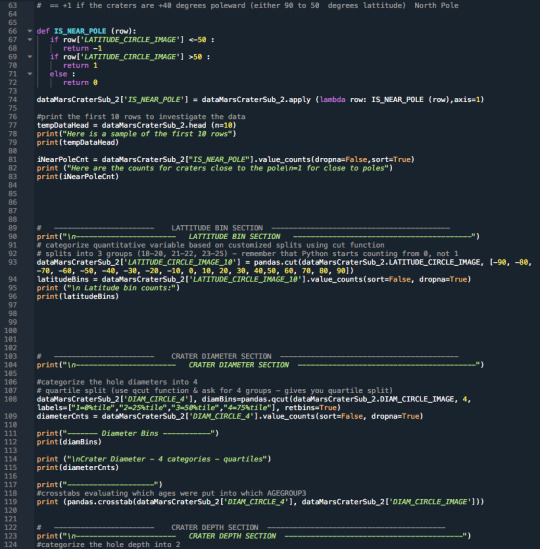
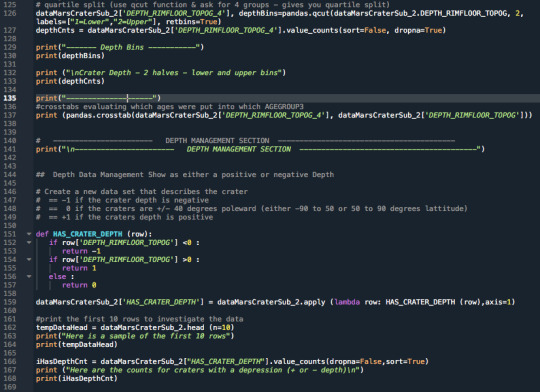
3.Raw Python Code:
The raw Python code is shown in the photos below. I decided to use screenshots for easier readability as it includes syntax highlighting.
4.Code Output:
Below is the raw output from the code. The interpretation and comments on the results are shown above in Section 2.
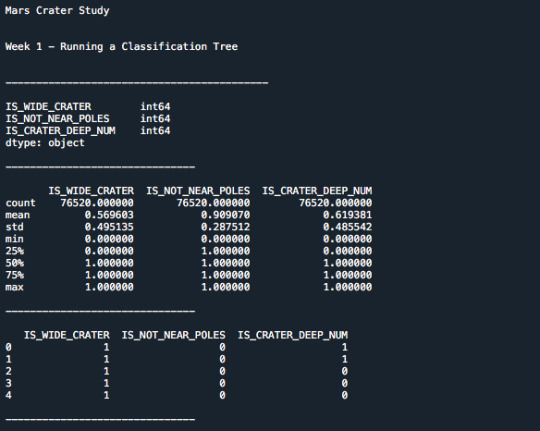
Mars Crater Study
Week 4 - Running a k-Means Cluster Analysis
-------------------------------------------
IS_WIDE_CRATER int64
IS_NOT_NEAR_POLES int64
LONGITUDE_CIRCLE_IMAGE float64
DIAM_CIRCLE_IMAGE float64
LATITUDE_CIRCLE_IMAGE float64
dtype: object
-------------------------------
IS_WIDE_CRATER ... LATITUDE_CIRCLE_IMAGE
count 76520.000000 ... 76520.000000
mean 0.569603 ... -9.997340
std 0.495135 ... 33.599395
min 0.000000 ... -86.700000
25% 0.000000 ... -34.660500
50% 1.000000 ... -12.159000
75% 1.000000 ... 14.828000
max 1.000000 ... 85.702000
[8 rows x 5 columns]
-------------------------------
IS_WIDE_CRATER IS_NOT_NEAR_POLES ... DIAM_CIRCLE_IMAGE LATITUDE_CIRCLE_IMAGE
0 1 0 ... 82.10 84.367
1 1 0 ... 82.02 72.760
2 1 0 ... 79.63 69.244
3 1 0 ... 74.81 70.107
4 1 0 ... 73.53 77.996
[5 rows x 5 columns]
-------------------------------
train test split
Clustering variable means by cluster
index ... LATITUDE_CIRCLE_IMAGE
cluster ...
0 180746.841806 ... 0.152403
1 258779.073548 ... -0.608429
2 197361.717082 ... -0.009083
[3 rows x 6 columns]
OLS Regression Results
================================================================================
Dep. Variable: DEPTH_RIMFLOOR_TOPOG R-squared: 0.146
Model: OLS Adj. R-squared: 0.146
Method: Least Squares F-statistic: 4572.
Date: Wed, 26 Aug 2020 Prob (F-statistic): 0.00
Time: 21:45:54 Log-Likelihood: -16413.
No. Observations: 53564 AIC: 3.283e+04
Df Residuals: 53561 BIC: 3.286e+04
Df Model: 2
Covariance Type: nonrobust
===================================================================================
coef std err t P>|t| [0.025 0.975]
-----------------------------------------------------------------------------------
Intercept 0.2338 0.002 103.365 0.000 0.229 0.238
C(cluster)[T.1] 0.0137 0.005 2.620 0.009 0.003 0.024
C(cluster)[T.2] 0.2742 0.003 91.239 0.000 0.268 0.280
==============================================================================
Omnibus: 20663.101 Durbin-Watson: 2.008
Prob(Omnibus): 0.000 Jarque-Bera (JB): 113044.488
Skew: 1.784 Prob(JB): 0.00
Kurtosis: 9.158 Cond. No. 4.47
==============================================================================
Warnings:
[1] Standard Errors assume that the covariance matrix of the errors is correctly specified.
means for DEPTH_RIMFLOOR_TOPOG by cluster
DEPTH_RIMFLOOR_TOPOG
cluster
0 0.233786
1 0.247493
2 0.508011
standard deviations for DEPTH_RIMFLOOR_TOPOG by cluster
DEPTH_RIMFLOOR_TOPOG
cluster
0 0.164277
1 0.335329
2 0.411583
Multiple Comparison of Means - Tukey HSD, FWER=0.05
==================================================
group1 group2 meandiff p-adj lower upper reject
--------------------------------------------------
0 1 0.0137 0.0239 0.0014 0.026 True
0 2 0.2742 0.001 0.2672 0.2813 True
1 2 0.2605 0.001 0.2485 0.2725 True
--------------------------------------------------
End
<Figure size 432x288 with 0 Axes>
0 notes
Text
Machine Learning for Data Analysis Week 3 Running a Lasso Regression Analysis
1.Background
I have decided to look at Mars craters and ask the following question:
A. Is the depth dependant on the diameter of the crater?
B. Is the depth dependant on the latitude? Are craters closer to the poles shallower?
2.Notes about the Results
* see section 3 for full code and section 4 for code output
The dataset was limited to craters that had a diameter of 100 km or less and a crater depth that was greater than 0 km.
Shallow craters were defined as craters with a depth of 180m (0.18km) or less. This was the binary response variable.
Craters close to the pole were defined +-40 poleward (ie craters that were not close to the pole had latitudes of -60 to +60 degrees). The latitude variable was classified as 0 if the craters were close to the pole and 1 if they were not close to the poles. This was a binary explanatory variable (=1 IS_NOT_NEAR_POLES)
Wide Diameter craters were defined as craters that had a diameter larger than 5km. (=1 IS_WIDE_CRATER)
A lasso regression analysis was run to test nonlinear relationships among a series of explanatory variables and a quantitative response variable which was the crater depth.
Data were randomly split into a training set that included 70% of the observations and a test set that included 30% of the observations.
The predictor variables were:
'IS_WIDE_CRATER','IS_NOT_NEAR_POLES', 'LONGITUDE_CIRCLE_IMAGE', 'DIAM_CIRCLE_IMAGE', 'LATITUDE_CIRCLE_IMAGE'
The results from the dictionary show that all of the values where used by the model as none are zero:
{'IS_WIDE_CRATER': 0.05552232138486251, 'IS_NOT_NEAR_POLES': 0.04471569339534235, 'LONGITUDE_CIRCLE_IMAGE': 0.00309458641422248, 'DIAM_CIRCLE_IMAGE': 0.1601521016998867, 'LATITUDE_CIRCLE_IMAGE': -0.00022362030166929382}
The value that is the largest is the diameter of the crater indicating as it is the strongest contributor to the explanatory variable.
If we plot the values we see the following
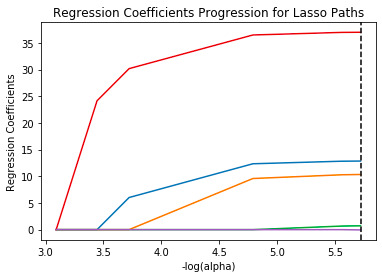
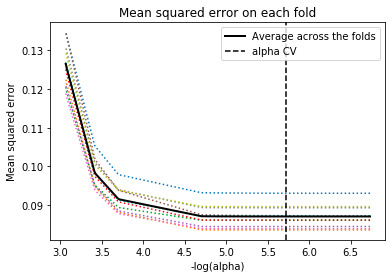
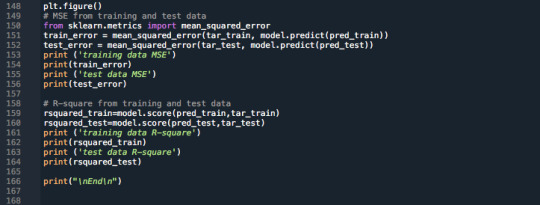
The training data mean square error was very similar to the test data mean square error and their values were:
training data MSE 0.08704722988847985 test data MSE 0.08545239592311873
Also the R square values for both the test and the training were essentially the same with their values as follows:
training data R-square 0.3119452335930013 test data R-square 0.31373693600486263
The least angle regression algorithm with k=10 fold cross validation was used to estimate the lasso regression model in the training set, and the model was validated using the test set. The change in the cross validation average (mean) squared error at each step was used to identify the best subset of predictor variables.Figure 1. Change in the validation mean square error at each stepThe mean squared error for each of the folds is shown below:
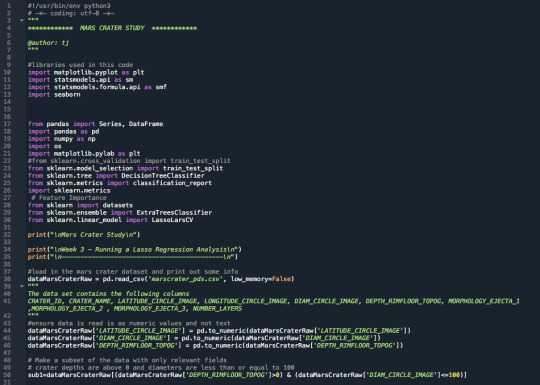
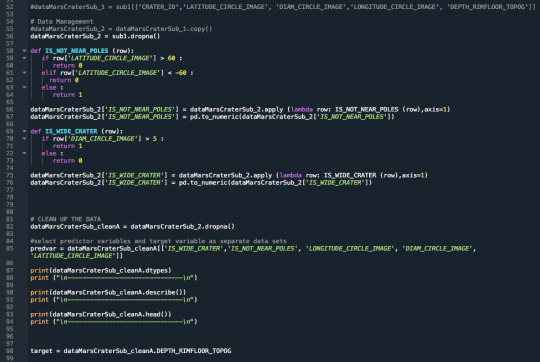
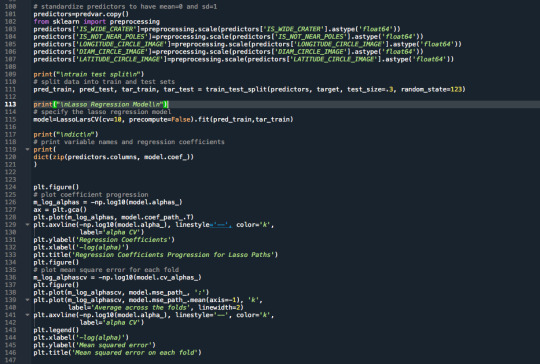
3.Raw Python Code:
The raw Python code is shown in the photos below. I decided to use screenshots for easier readability as it includes syntax highlighting.
4.Code Output:
Below is the raw output from the code. The interpretation and comments on the results are shown above in Section 2.
Mars Crater Study
Week 3 - Running a Lasso Regression Analysis
-------------------------------------------
CRATER_ID object CRATER_NAME object LATITUDE_CIRCLE_IMAGE float64 LONGITUDE_CIRCLE_IMAGE float64 DIAM_CIRCLE_IMAGE float64 DEPTH_RIMFLOOR_TOPOG float64 MORPHOLOGY_EJECTA_1 object MORPHOLOGY_EJECTA_2 object MORPHOLOGY_EJECTA_3 object NUMBER_LAYERS int64 IS_NOT_NEAR_POLES int64 IS_WIDE_CRATER int64 dtype: object
-------------------------------
LATITUDE_CIRCLE_IMAGE ... IS_WIDE_CRATER count 76520.000000 ... 76520.000000 mean -9.997340 ... 0.569603 std 33.599395 ... 0.495135 min -86.700000 ... 0.000000 25% -34.660500 ... 0.000000 50% -12.159000 ... 1.000000 75% 14.828000 ... 1.000000 max 85.702000 ... 1.000000
[8 rows x 7 columns]
-------------------------------
CRATER_ID CRATER_NAME ... IS_NOT_NEAR_POLES IS_WIDE_CRATER 0 01-000000 ... 0 1 1 01-000001 Korolev ... 0 1 2 01-000002 ... 0 1 3 01-000003 ... 0 1 4 01-000004 ... 0 1
[5 rows x 12 columns]
-------------------------------
train test split
Lasso Regression Model
dict
{'IS_WIDE_CRATER': 0.05552232138486251, 'IS_NOT_NEAR_POLES': 0.04471569339534235, 'LONGITUDE_CIRCLE_IMAGE': 0.00309458641422248, 'DIAM_CIRCLE_IMAGE': 0.1601521016998867, 'LATITUDE_CIRCLE_IMAGE': -0.00022362030166929382} training data MSE 0.08704722988847985 test data MSE 0.08545239592311873 training data R-square 0.3119452335930013 test data R-square 0.31373693600486263
End
0 notes
Text
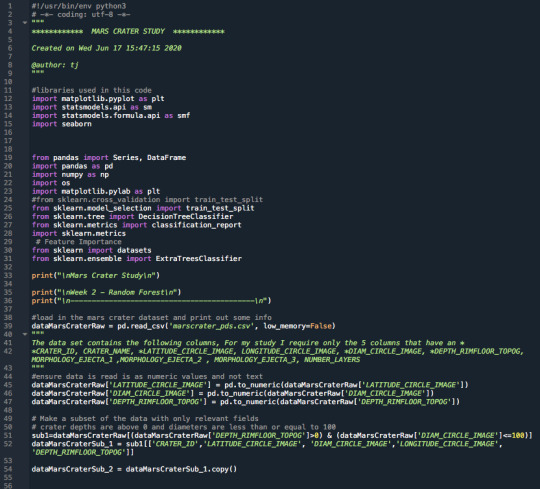
Machine Learning for Data Analysis Week 2 Running a Random Forest
1.Background
I have decided to look at Mars craters and ask the following question:
A. Is the depth dependant on the diameter of the crater?
B. Is the depth dependant on the latitude? Are craters closer to the poles shallower?
2.Notes about the Results
* see section 3 for full code and section 4 for code output
The dataset was limited to craters that had a diameter of 100 km or less and a crater depth that was greater than 0 km.
Shallow craters were defined as craters with a depth of 180m (0.18km) or less. This was the binary response variable.
Craters close to the pole were defined +-40 poleward (ie craters that were not close to the pole had latitudes of -60 to +60 degrees). The latitude variable was classified as 0 if the craters were close to the pole and 1 if they were not close to the poles. This was a binary explanatory variable (=1 IS_NOT_NEAR_POLES)
Wide Diameter craters were defined as craters that had a diameter larger than 5km. (=1 IS_WIDE_CRATER)
A randome forest analysis was run to test nonlinear relationships among a series of explanatory variables and a binary, categorical response variable.
The explanatory variables were:
'IS_WIDE_CRATER' (yes or no) 'IS_NOT_NEAR_POLES' (yes or no) 'LONGITUDE_CIRCLE_IMAGE' (longitude value) 'DIAM_CIRCLE_IMAGE' (crater diameter value) 'LATITUDE_CIRCLE_IMAGE' (latitude value)
The categorical response variable was the crater depth ( deep or shallow crater)
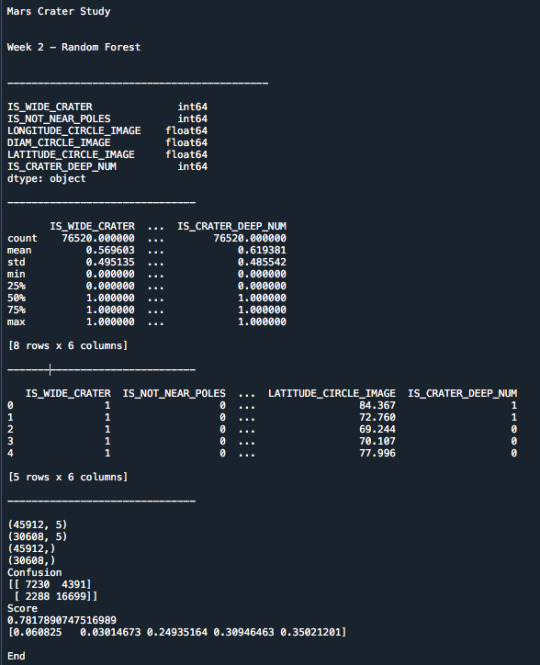
The confusion matrix shows:
[[ 7230 4391] [ 2288 16699]] Which shows 7230 true positives and 16699 true negatives for crater size. there is also 4391 false positives and 2288 false corrections.
With an accuracy score of 0.7817890747516989 which is rounded to 78% were correctly identified
The feature importance shows the following. [0.060825 0.03014673 0.24935164 0.30946463 0.35021201]
The first 2 variables are binary values that indicate if the crater is wide or not near the poles. The values are 6% and 3% which shows they are of little importance. The most important variable is the latitude with a value of 35%, followed by the diameter with a value of 31% and the longitude with a value of 24% on importance.
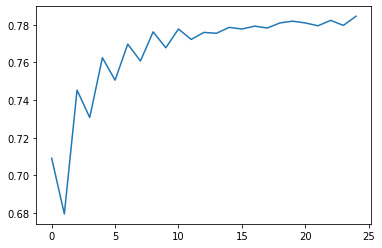
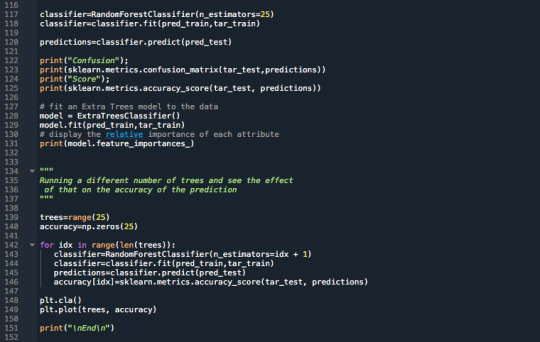
Performing a series of random forest classifications shows that after approximately 20 runs we have a convergences which shows that using a single decision tree would not have been appropriate as using too few would have resulted in accuracy of 68% versus 78% when using more.
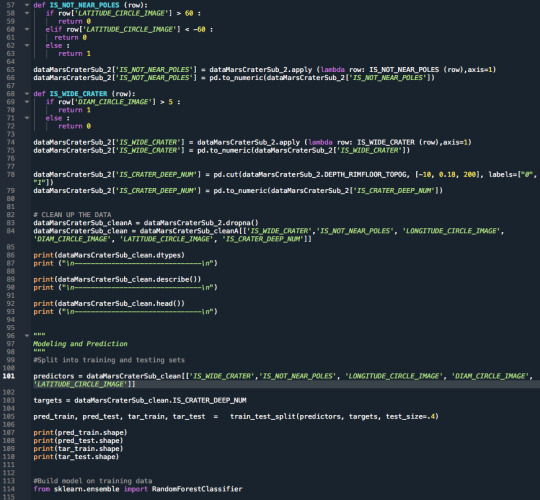
3.Raw Python Code:
The raw Python code is shown in the photos below. I decided to use screenshots for easier readability as it includes syntax highlighting.
4.Code Output:
Below is the raw output from the code. The interpretation and comments on the results are shown above in Section 2.
0 notes
Text
Machine Learning for Data Analysis Week 1 Running a Classification Tree
1.Background
I have decided to look at Mars craters and ask the following question:
A. Is the depth dependant on the diameter of the crater?
B. Is the depth dependant on the latitude? Are craters closer to the poles shallower?
2.Notes about the Results
* see section 3 for full code and section 4 for code output
The dataset was limited to craters that had a diameter of 100 km or less and a crater depth that was greater than 0 km.
Shallow craters were defined as craters with a depth of 180m (0.18km) or less. This was the binary response variable.
Craters close to the pole were defined +-40 poleward (ie craters that were not close to the pole had latitudes of -60 to +60 degrees). The latitude variable was classified as 0 if the craters were close to the pole and 1 if they were not close to the poles. This was a binary explanatory variable (=1 IS_NOT_NEAR_POLES)
Wide Diameter craters were defined as craters that had a diameter larger than 5km. (=1 IS_WIDE_CRATER)
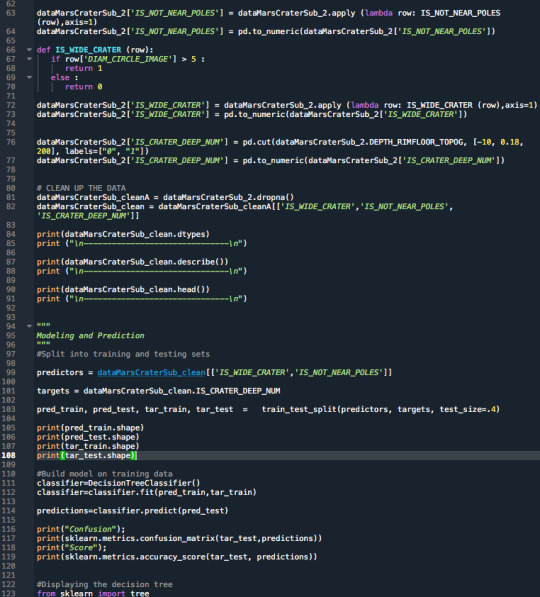
A decision tree analysis was run to test nonlinear relationships among a series of explanatory variables and a binary, categorical response variable.
The 2 explanatory variables were: diameter (wide crater) and latitude (craters not near the poles)
The categorical response variable was the crater depth ( deep or shallow crater)
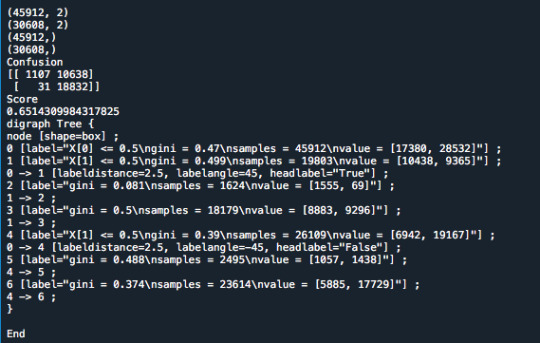
The confusion matrix shows:
[[ 1107 10638] [ 31 18832]]
Which shows 1107 true positives and 18832 true negatives for crater size. there is also 31 and 10638 false corrections.
The Score is 0.6514309984317825 which shows 65% were correctly identified.
The decision tree is as follows:
The first split is on the diameter of the crater and the second is on the crater latitude.
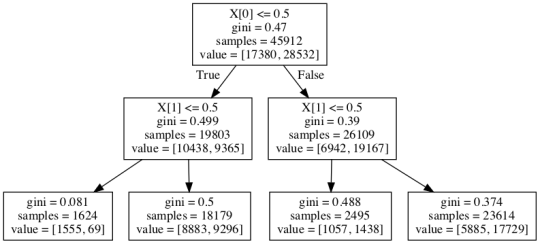
If we look at the lower left we see that craters with a small diameter and near the poles there are 1,555 are not deep craters whereas 69 are large craters.
If we look at the far right at the bottom we see that 5885 are not deep craters and 17729 are deep craters indicating that craters with a classified large diameter and latitude closer to the equator have larger craters.
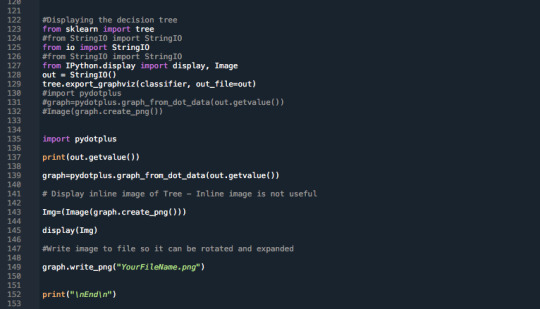
3.Raw Python Code:
The raw Python code is shown in the photos below. I decided to use screenshots for easier readability as it includes syntax highlighting.
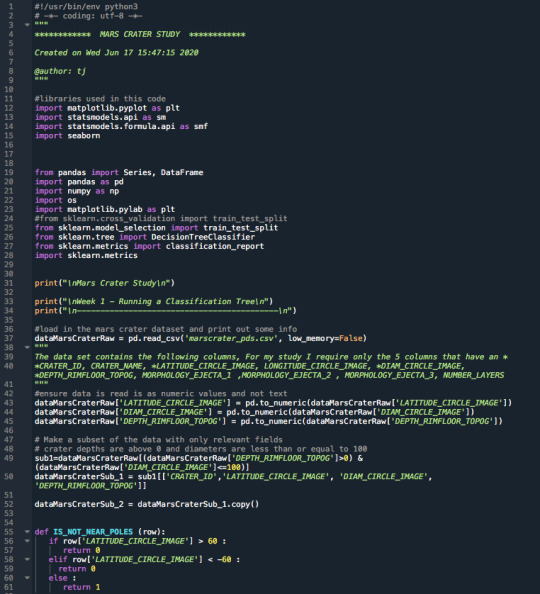
4.Code Output:
Below is the raw output from the code. The interpretation and comments on the results are shown above in Section 2.
0 notes
Text
Regression Modeling in Practice Week 4 Test a Logistic Regression Model
1.Background
I have decided to look at Mars craters and ask the following question:
A. Is the depth dependant on the diameter of the crater?
B. Is the depth dependant on the latitude? Are craters closer to the poles shallower?
2.Notes about the Results
* see section 3 for full code and section 4 for code output
The dataset was limited to craters that had a diameter of 100 km or less and a crater depth that was greater than 0 km.
Shallow craters were defined as craters with a depth of 180m (0.18km) or less. This was the binary response variable.
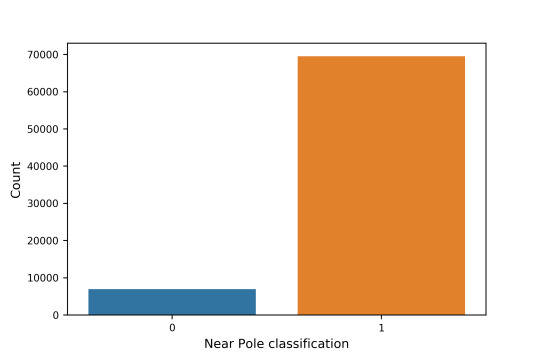
Craters close to the pole were defined +-40 poleward (ie craters that were not close to the pole had latitudes of -60 to +60 degrees). The latitude variable was classified as 0 if the craters were close to the pole and 1 if they were not close to the poles. This was a binary explanatory variable (=1 IS_NOT_NEAR_POLES)
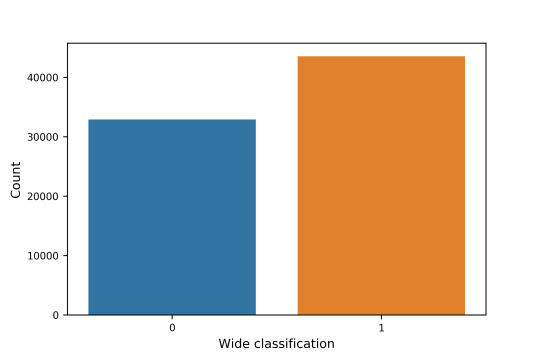
Wide Diameter craters were defined as craters that had a diameter larger than 5km. (=1 IS_WIDE_CRATER)
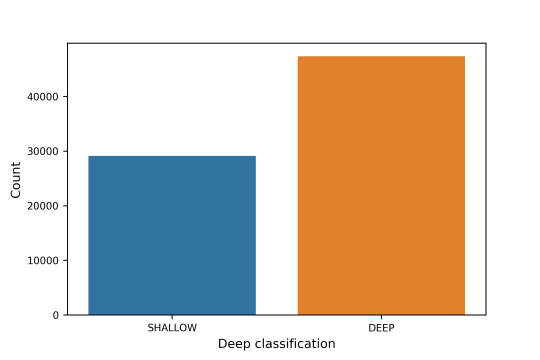
The visualization of the data can be shown by the binary explanatory and response variables below:
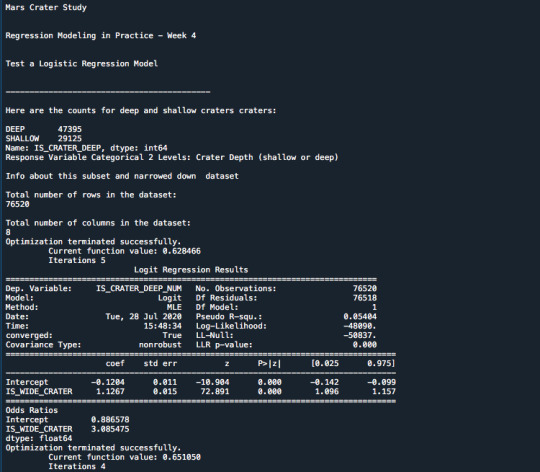
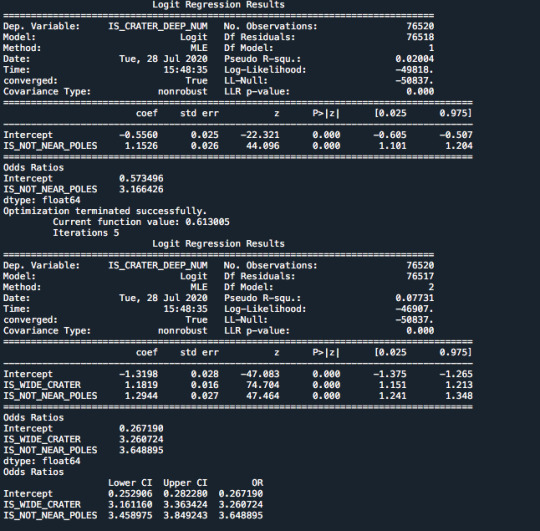
The first Logit Regression involved classifying the craters as either deep or shallow (into a binary variable). The regression compared wide craters against the depth and it P value of 0 showed there was statistical significance and a positive coefficient. I then compared crater latitude against the depth and showed there was statistical significance with a p value of 0.0 and a positive coefficient.
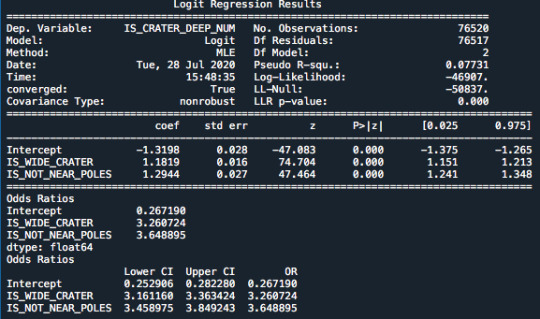
I then added both of the variables and performed a Logit Regression analysis and the results are shown below. The results show that there are no confounding variables and both are independently significant. The correlation coefficient for wide craters is 1.18 and for craters closed to the equator the value is 1.29. This shows that for wider diameter craters and craters closer to the equator the craters are generally deeper than less wide and craters close to the north and south pole.
The Odds ratio for wide craters is 3.26x with a 95% confidence interval of 3.16 to 3.36.
Wide craters are 3.26 times more likely to have deep craters than small diameter craters after controlling for crater latitude.
The Odds ratio for craters not near the poles is 3.66x with a 95% confidence interval of 3.45 to 3.85.
Also, craters with latitudes not near the poles are 3.65 times more likely to be deeper than craters closer to the poles, after controlling for the presence of crater diameter.
Because the confidence intervals on our odds ratios do not overlap, we can say that crater latitude is more strongly associated with crater depth than diameter.
The results show that the hypothesis was correct and both the latitude and diameter play a role in the crater depth.
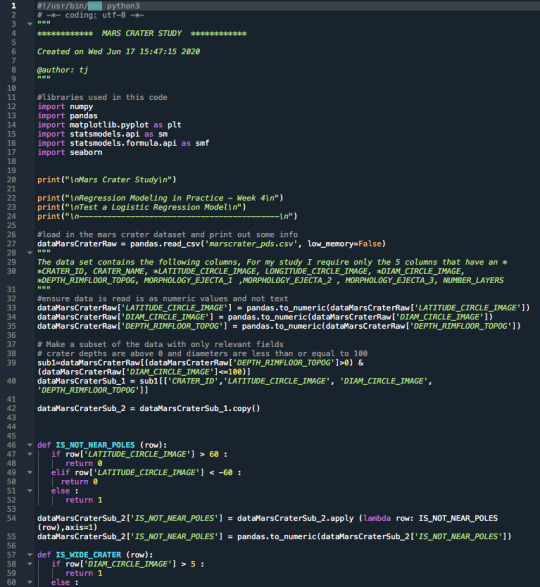
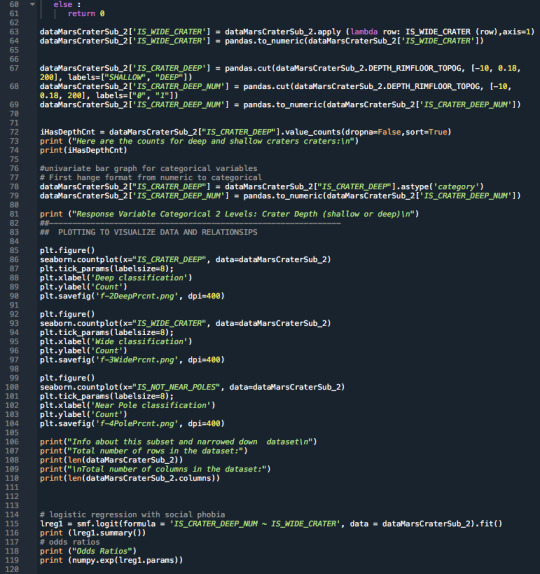
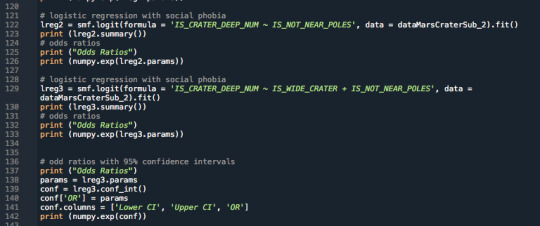
3.Raw Python Code:
The raw Python code is shown in the photos below. I decided to use screenshots for easier readability as it includes syntax highlighting.
4.Code Output:
Below is the raw output from the code. The interpretation and comments on the results are shown above in Section 2.
Mars Crater Study
Regression Modeling in Practice - Week 4
Test a Logistic Regression Model
-------------------------------------------
Here are the counts for deep and shallow craters craters:
DEEP 47395 SHALLOW 29125 Name: IS_CRATER_DEEP, dtype: int64 Response Variable Categorical 2 Levels: Crater Depth (shallow or deep)
Info about this subset and narrowed down dataset
Total number of rows in the dataset: 76520
Total number of columns in the dataset: 8 Optimization terminated successfully. Current function value: 0.628466 Iterations 5 Logit Regression Results ============================================================================== Dep. Variable: IS_CRATER_DEEP_NUM No. Observations: 76520 Model: Logit Df Residuals: 76518 Method: MLE Df Model: 1 Date: Tue, 28 Jul 2020 Pseudo R-squ.: 0.05404 Time: 15:48:34 Log-Likelihood: -48090. converged: True LL-Null: -50837. Covariance Type: nonrobust LLR p-value: 0.000 ================================================================================== coef std err z P>|z| [0.025 0.975] ---------------------------------------------------------------------------------- Intercept -0.1204 0.011 -10.904 0.000 -0.142 -0.099 IS_WIDE_CRATER 1.1267 0.015 72.891 0.000 1.096 1.157 ================================================================================== Odds Ratios Intercept 0.886578 IS_WIDE_CRATER 3.085475 dtype: float64 Optimization terminated successfully. Current function value: 0.651050 Iterations 4 Logit Regression Results ============================================================================== Dep. Variable: IS_CRATER_DEEP_NUM No. Observations: 76520 Model: Logit Df Residuals: 76518 Method: MLE Df Model: 1 Date: Tue, 28 Jul 2020 Pseudo R-squ.: 0.02004 Time: 15:48:35 Log-Likelihood: -49818. converged: True LL-Null: -50837. Covariance Type: nonrobust LLR p-value: 0.000 ===================================================================================== coef std err z P>|z| [0.025 0.975] ------------------------------------------------------------------------------------- Intercept -0.5560 0.025 -22.321 0.000 -0.605 -0.507 IS_NOT_NEAR_POLES 1.1526 0.026 44.096 0.000 1.101 1.204 ===================================================================================== Odds Ratios Intercept 0.573496 IS_NOT_NEAR_POLES 3.166426 dtype: float64 Optimization terminated successfully. Current function value: 0.613005 Iterations 5 Logit Regression Results ============================================================================== Dep. Variable: IS_CRATER_DEEP_NUM No. Observations: 76520 Model: Logit Df Residuals: 76517 Method: MLE Df Model: 2 Date: Tue, 28 Jul 2020 Pseudo R-squ.: 0.07731 Time: 15:48:35 Log-Likelihood: -46907. converged: True LL-Null: -50837. Covariance Type: nonrobust LLR p-value: 0.000 ===================================================================================== coef std err z P>|z| [0.025 0.975] ------------------------------------------------------------------------------------- Intercept -1.3198 0.028 -47.083 0.000 -1.375 -1.265 IS_WIDE_CRATER 1.1819 0.016 74.704 0.000 1.151 1.213 IS_NOT_NEAR_POLES 1.2944 0.027 47.464 0.000 1.241 1.348 ===================================================================================== Odds Ratios Intercept 0.267190 IS_WIDE_CRATER 3.260724 IS_NOT_NEAR_POLES 3.648895 dtype: float64 Odds Ratios Lower CI Upper CI OR Intercept 0.252906 0.282280 0.267190 IS_WIDE_CRATER 3.161160 3.363424 3.260724 IS_NOT_NEAR_POLES 3.458975 3.849243 3.648895
0 notes
Text
Regression Modeling in Practice Week 3 Test a Multiple Regression Model
1.Background
I have decided to look at Mars craters and ask the following question:
A. Is the depth dependant on the diameter of the crater?
The dataset was limited to craters that had a diameter of 100 km or less and a crater depth that was greater than 0 km.
2.Notes about the Results
* see section 3 for full code and section 4 for code output
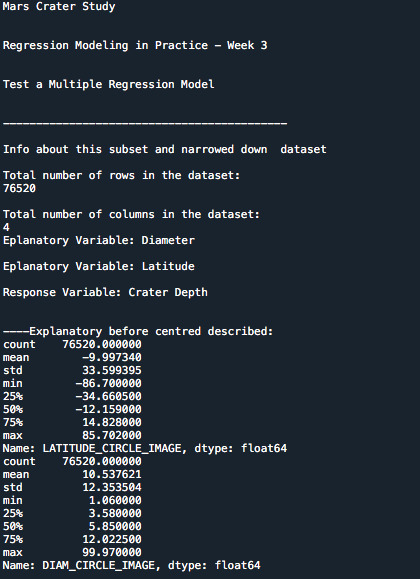
I ran the Regression Model to look at the relationship between crater depth and crater diameter and added the latitude variable to see how this affected the results.
The explanatory variables that I used are: Diameter Diameter Squared Latitude
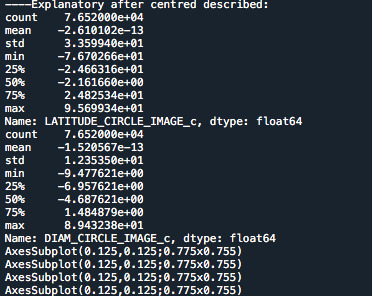
First I centered all of the variables and this can be seen below after I checked the mean to ensure the mean was zero after subtracting off the mean.
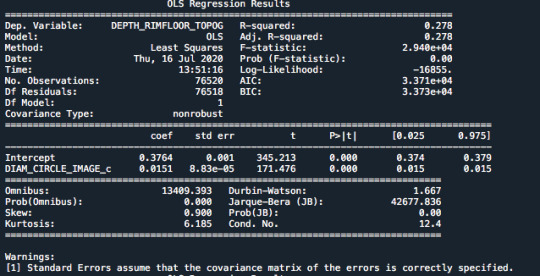
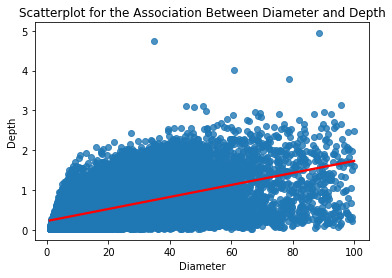
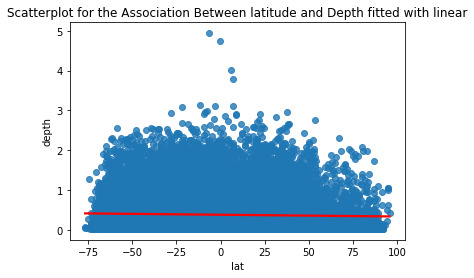
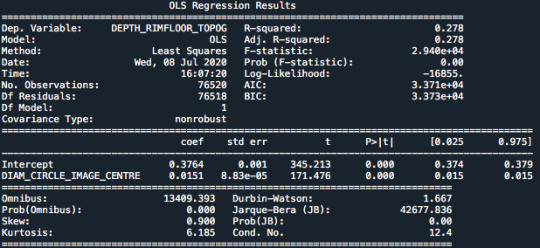
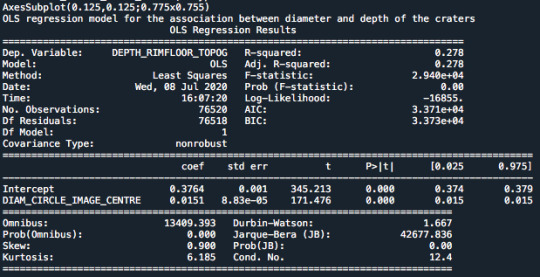
I then ran a regression analysis with my explanatory variable of crater diameter and the response variable was the crater diameter. The R squared value was 0.278 and the p value of 0.0 indicated there was a significant relationship between these two. the intercept was at 0.3764 and the slope is positive with a value of 0.0151 indicating there is a positive relationship.
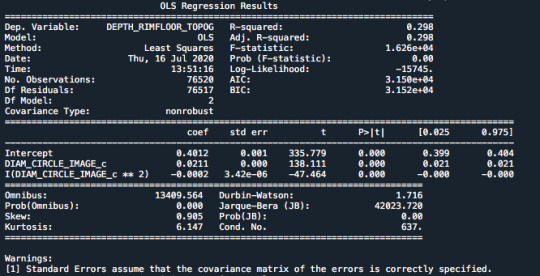
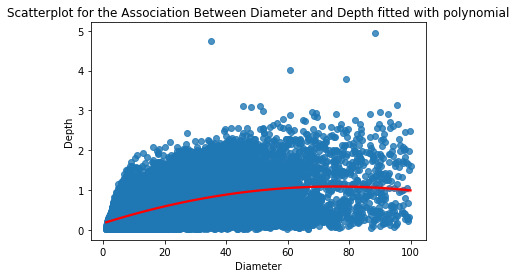
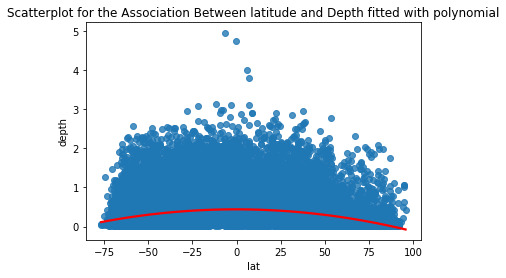
I then ran another regression analysis with my explanatory variable of crater diameter , and the crater diameter square to have a polynomial fit and the response variable was the crater diameter. The R squared value was only slightly better by using the polynomial and the value was 0.298 and the p value of 0.0 indicated there was a significant relationship between these two. The intercept was at 0.4. The value for the linear starts positive and the squared value is negative showing the concave shape of the curve
A plot of the fit line for linear and polynomial fit are shown below. the addition of the polynomial fit does a slightly better job at predicting the smaller portion and large diameter craters.
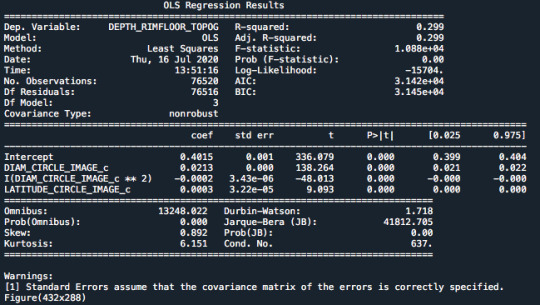
The addition of the latitude explanatory variable was included to see if the latitude had a significant influence on the depth of the craters. The regression analysis showed that the latitude had a p value of 0.0 indicating that there was a significant relationship. The R squared value also slightly improved showing a better correlation when including this variable. All of the variables are statistically significant since when they were all added the resultant P value is around 0.0 which is less than 0.05.
The intercept shows 0.4015 depth when the other variables are at their means since they were centred. Only about 29.9% of the variability is explained by these variables.
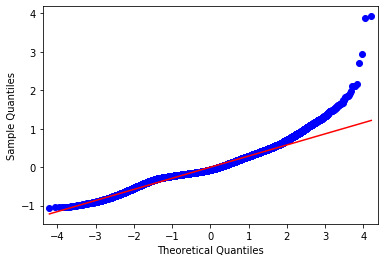
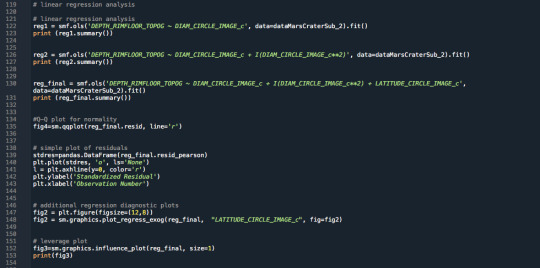
The qq plot shows the residuals deviate quite a bit from the fit line. Indicating that all the explanatory variables may not be properly fitting the relationship. Especially near the far right there is poor agreement.
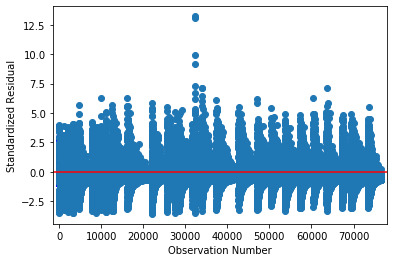
The residual plot shows that most fall within +/-2.5 standard deviations. We also see some extreme outliers at great than 5 standard deviations. The fit of the model is relatively poor and could be improved.
Next the Regressions plots were included to examine the residuals. This shows that the residuals are larger away from the south pole and there are randomly spread out around the best fit line. This shows that even though there is a significant statistical relationship, the correlation is pretty weak.
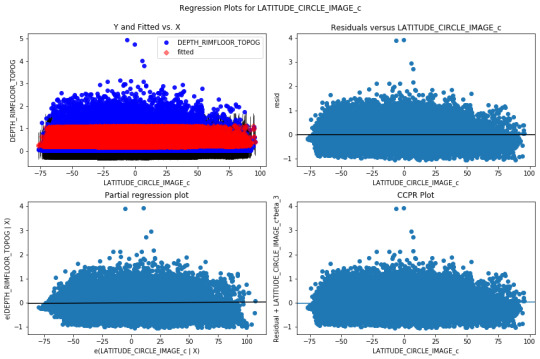
Finally, the influence plot was created and there are several outliers visible on the residual plot that show that some of these outliers have a large influence or bias.
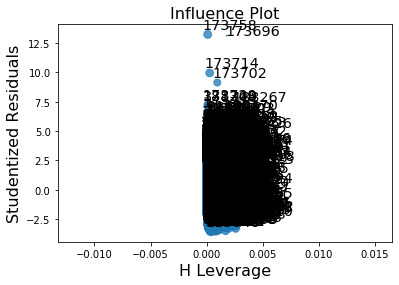
Overall the hypothesis was corrected however the dataset should be reduced and perhaps only look at a subsection of the crater as the relationship is poor. There were no confounding variables observed.
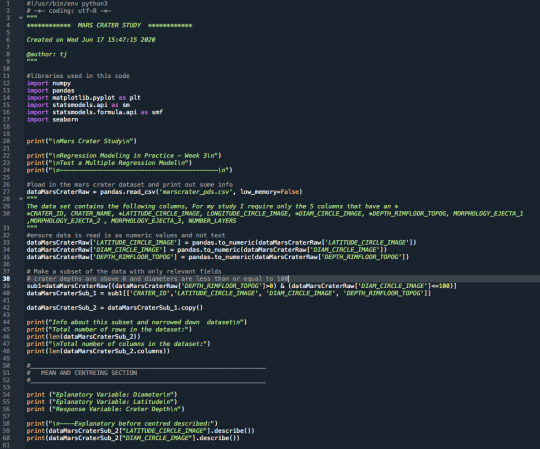
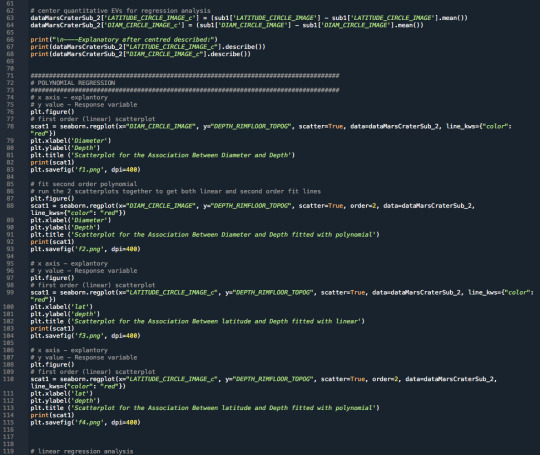
3.Raw Python Code:
The raw Python code is shown in the photos below. I decided to use screenshots for easier readability as it includes syntax highlighting.
4.Code Output:
Below is the raw output from the code. The interpretation and comments on the results are shown above in Section 2.
Mars Crater Study
Regression Modeling in Practice - Week 3
Test a Multiple Regression Model
-------------------------------------------
Info about this subset and narrowed down dataset
Total number of rows in the dataset: 76520
Total number of columns in the dataset: 4 Eplanatory Variable: Diameter
Eplanatory Variable: Latitude
Response Variable: Crater Depth
----Explanatory before centred described: count 76520.000000 mean -9.997340 std 33.599395 min -86.700000 25% -34.660500 50% -12.159000 75% 14.828000 max 85.702000 Name: LATITUDE_CIRCLE_IMAGE, dtype: float64 count 76520.000000 mean 10.537621 std 12.353504 min 1.060000 25% 3.580000 50% 5.850000 75% 12.022500 max 99.970000 Name: DIAM_CIRCLE_IMAGE, dtype: float64
----Explanatory after centred described: count 7.652000e+04 mean -2.610102e-13 std 3.359940e+01 min -7.670266e+01 25% -2.466316e+01 50% -2.161660e+00 75% 2.482534e+01 max 9.569934e+01 Name: LATITUDE_CIRCLE_IMAGE_c, dtype: float64 count 7.652000e+04 mean -1.520567e-13 std 1.235350e+01 min -9.477621e+00 25% -6.957621e+00 50% -4.687621e+00 75% 1.484879e+00 max 8.943238e+01 Name: DIAM_CIRCLE_IMAGE_c, dtype: float64 AxesSubplot(0.125,0.125;0.775x0.755) AxesSubplot(0.125,0.125;0.775x0.755) AxesSubplot(0.125,0.125;0.775x0.755) AxesSubplot(0.125,0.125;0.775x0.755) OLS Regression Results ================================================================================ Dep. Variable: DEPTH_RIMFLOOR_TOPOG R-squared: 0.278 Model: OLS Adj. R-squared: 0.278 Method: Least Squares F-statistic: 2.940e+04 Date: Thu, 16 Jul 2020 Prob (F-statistic): 0.00 Time: 13:51:16 Log-Likelihood: -16855. No. Observations: 76520 AIC: 3.371e+04 Df Residuals: 76518 BIC: 3.373e+04 Df Model: 1 Covariance Type: nonrobust ======================================================================================= coef std err t P>|t| [0.025 0.975] --------------------------------------------------------------------------------------- Intercept 0.3764 0.001 345.213 0.000 0.374 0.379 DIAM_CIRCLE_IMAGE_c 0.0151 8.83e-05 171.476 0.000 0.015 0.015 ============================================================================== Omnibus: 13409.393 Durbin-Watson: 1.667 Prob(Omnibus): 0.000 Jarque-Bera (JB): 42677.836 Skew: 0.900 Prob(JB): 0.00 Kurtosis: 6.185 Cond. No. 12.4 ==============================================================================
Warnings: [1] Standard Errors assume that the covariance matrix of the errors is correctly specified. OLS Regression Results ================================================================================ Dep. Variable: DEPTH_RIMFLOOR_TOPOG R-squared: 0.298 Model: OLS Adj. R-squared: 0.298 Method: Least Squares F-statistic: 1.626e+04 Date: Thu, 16 Jul 2020 Prob (F-statistic): 0.00 Time: 13:51:16 Log-Likelihood: -15745. No. Observations: 76520 AIC: 3.150e+04 Df Residuals: 76517 BIC: 3.152e+04 Df Model: 2 Covariance Type: nonrobust =============================================================================================== coef std err t P>|t| [0.025 0.975] ----------------------------------------------------------------------------------------------- Intercept 0.4012 0.001 335.779 0.000 0.399 0.404 DIAM_CIRCLE_IMAGE_c 0.0211 0.000 138.111 0.000 0.021 0.021 I(DIAM_CIRCLE_IMAGE_c ** 2) -0.0002 3.42e-06 -47.464 0.000 -0.000 -0.000 ============================================================================== Omnibus: 13409.564 Durbin-Watson: 1.716 Prob(Omnibus): 0.000 Jarque-Bera (JB): 42023.720 Skew: 0.905 Prob(JB): 0.00 Kurtosis: 6.147 Cond. No. 637. ==============================================================================
Warnings: [1] Standard Errors assume that the covariance matrix of the errors is correctly specified. OLS Regression Results ================================================================================ Dep. Variable: DEPTH_RIMFLOOR_TOPOG R-squared: 0.299 Model: OLS Adj. R-squared: 0.299 Method: Least Squares F-statistic: 1.088e+04 Date: Thu, 16 Jul 2020 Prob (F-statistic): 0.00 Time: 13:51:16 Log-Likelihood: -15704. No. Observations: 76520 AIC: 3.142e+04 Df Residuals: 76516 BIC: 3.145e+04 Df Model: 3 Covariance Type: nonrobust =============================================================================================== coef std err t P>|t| [0.025 0.975] ----------------------------------------------------------------------------------------------- Intercept 0.4015 0.001 336.079 0.000 0.399 0.404 DIAM_CIRCLE_IMAGE_c 0.0213 0.000 138.264 0.000 0.021 0.022 I(DIAM_CIRCLE_IMAGE_c ** 2) -0.0002 3.43e-06 -48.013 0.000 -0.000 -0.000 LATITUDE_CIRCLE_IMAGE_c 0.0003 3.22e-05 9.093 0.000 0.000 0.000 ============================================================================== Omnibus: 13248.022 Durbin-Watson: 1.718 Prob(Omnibus): 0.000 Jarque-Bera (JB): 41812.705 Skew: 0.892 Prob(JB): 0.00 Kurtosis: 6.151 Cond. No. 637. ==============================================================================
Warnings: [1] Standard Errors assume that the covariance matrix of the errors is correctly specified. Figure(432x288)
0 notes
Text
Regression Modeling in Practice Week 2 Testing a Basic Linear Regression Model
1.Background
I have decided to look at Mars craters and ask the following question:
A. Is the depth dependant on the diameter of the crater in the context of the moderator located near the poles or the equator? The dataset was limited to craters that had a diameter of 100 km or less and a crater depth that was greater than 0 km.
2.Notes about the Results
* see section 3 for full code and section 4 for code output
I ran the Regression Model to look at the relationship between crater depth and crater diameter.
Explanatory Variable: Diameter
Response Variable: Crater Depth
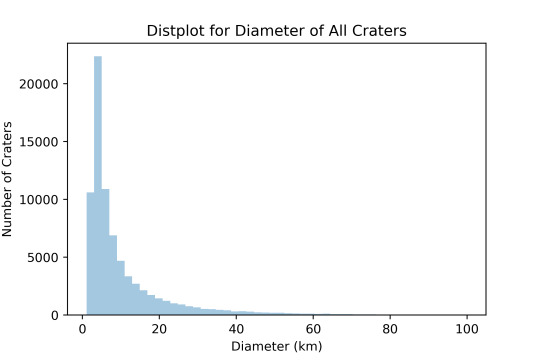
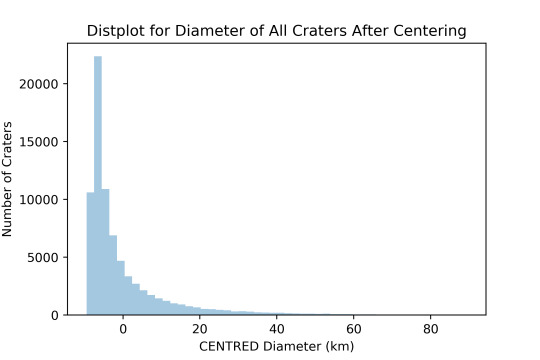
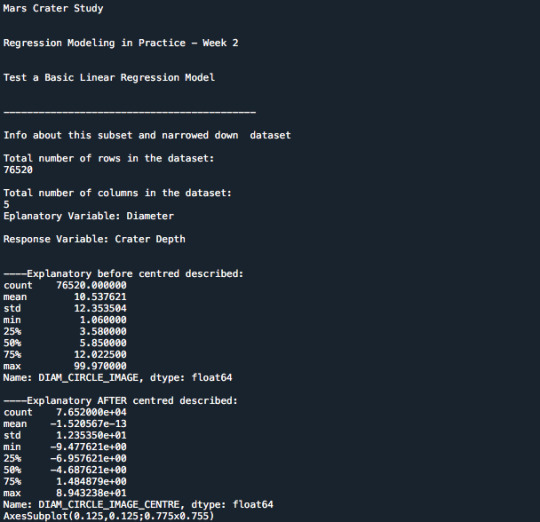
I first centred the Explanatory variable data. This was done by calculating the mean and then subtracting the mean from each value. The mean was calculated to be 10.53762 1km. Prior to centering the data the distrubtion was as follows:
After I centered the data it shift to the following. I recalculated the mean and its value was 0.0 indicating that the centering was successful.
The results from the linear regression were:
The p value is 0.0 indicating that there is a significant relationship between the depth and diameter of the crater.
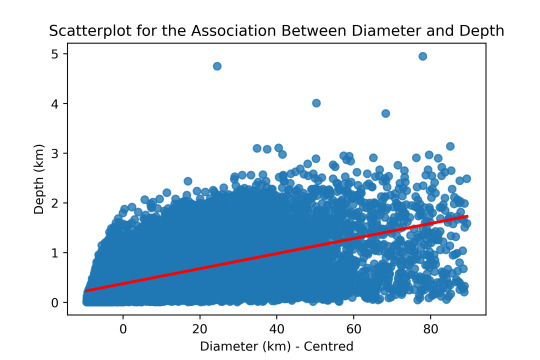
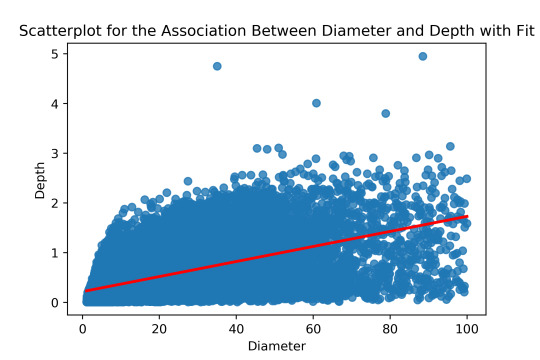
The regression revealed that the estimated correlation linear fit line can be calculated as follows:
CraterDepth = Intercept_Coef + Diameter_Coef * CraterDiameter
CraterDepth = 0.3764 + (0.0151 * CraterDiameter)
This is a positive relationship and the depth increases with crater diameter.
The R-sqaured value was 0.278. It is the proportion of the variance in the response (depth) variable that can be explained by the explanatory (diameter) variable. We now know that this model accounts for about 28% of the variability we see in our response variable, crater depth.
I plotted the data and the regression line is visible in red. This line follows the above equation.
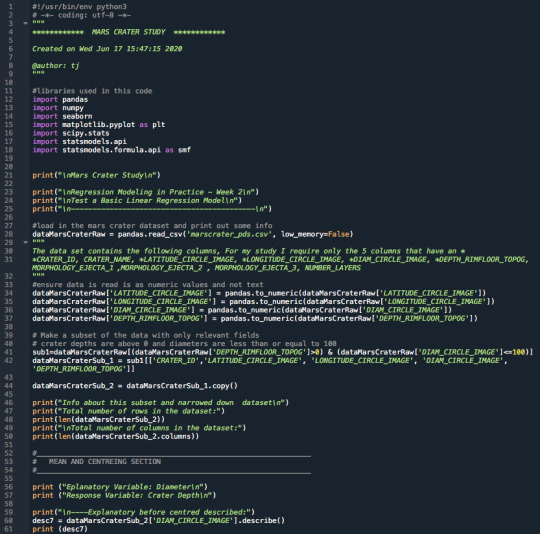
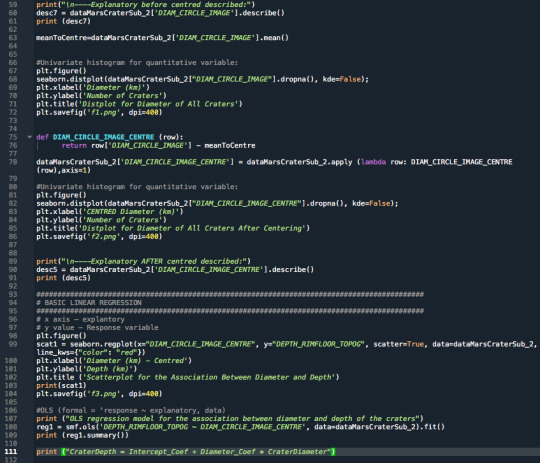
3.Raw Python Code:
The raw Python code is shown in the photos below. I decided to use screenshots for easier readability as it includes syntax highlighting.
4.Code Output:
Below is the raw output from the code. The interpretation and comments on the results are shown above in Section 2.
0 notes
Text
Regression Modeling in Practice Week 1 Writing About Your Data
1. Background
I have chosen the Mars Craters Study data set as it most accurately represents my field in the Physical Science and Engineering area of study. I am interested in examining the craters on Mars and their relationship to further the science in this area.
2. Sample
The Mars Craters Study, presents a global database that includes over 300,000 Mars craters 1 km or larger that were created between 4.2 and 3.8 billion years ago during a period of heavy bombardment (i.e. impacts of asteroids, proto-planets, and comets). This study, created by Stuart Robbins, presents a new global database for Mars that contains 378,540 craters statistically complete for diameters D ≥ 1 km. Each crater was measured and reported individually.
For my analysis I am looking at craters that are less equal to or less than 100 km in diameter and a crater depth that was greater than 0 km. This selection resulted in 76520 individual records.
2. Procedure
The bulk of crater identification and classification was done using observational studies. The craters were identified using THermal EMission Imaging System (THEMIS) aboard the 2001 Mars Odyssey NASA spacecraft. This space instrument is a multi-spectral thermal-infrared imager. The average local time for daytime observations is 4:30 P.M. to yield a high phase angle with shadows and heating effects sufficient for geomorphologic feature identification.
Data was collected between 2001 and 2011. One of the initial goals for the instrument was to create a global mosaic of the planet in both day and night from which thermal inertia maps could be calculated
ArcGIS Software was used to analyze the images and their location was determined in terms of latitude and longitude.
Diameters of the craters were fit using a circle routine approach with the Igor Pro software.
The topology of the crater was recorded by the Mars Orbiter Laser Altimeter (MOLA) attached to the Mars Global Surveyor (MGS) spacecraft. The MOLA instrument transmitted infrared laser pulses towards Mars to determine the distance of the MGS spacecraft to the Martian surface.
3. Measures
More recently the ability to measure craters has been enhanced based on the instruments of the Mars Orbiter. This detailed database includes location in longitude (-180 to 180) and latitude (-90 to 90), ejecta morphology, crater depth (in km), diameter (in km) and the name of the crater if available.
The use of new datasets has allowed for the reexamination of past large craters and also allows for smaller (>1km) craters to be analyzed.
I would like to study the relationship between the crater diameter and the depth of the craters on Mars. The primary questions to be proposed is: 1. “Does the crater diameter have a relationship with the depth of the crater? Is the depth dependant on the diameter of the crater?”
For this primary question it will be important to note and compare the diameter of the crater and the crater depth.
In addition to the primary questions I will also be looking at the location of the craters and would like to investigate and research the following questions: 2. “Are shallower depth craters associated with locations near the poles of Mars?” For this secondary question it will be important to look at the location of the craters and in particular the latitude.
Craters appear throughout the terrain of Mars and are the result of a period of heavy bombardment from asteroids, protoplanets and comets. The craters that appear on Mars are vital in understanding its surface material properties and provide insight into its climate and history and impact physics.
0 notes
Text
Data Analysis Tools Week 4 Testing a Potential Moderator
1.Background
I have decided to look at Mars craters and ask the following question:
A. Is the depth dependant on the diameter of the crater in the context of the moderator located near the poles or the equator? The dataset was limited to craters that had a diameter of 100 km or less and a crater depth that was greater than 0 km. The moderator was split into 3 categories, near the Southpole, near the Equator and near the Northpole.
2.Notes about the Results
* see section 3 for full code and section 4 for code output
I ran the correlation coefficient on the diameter versus depth against the moderator for location (based on latitude).
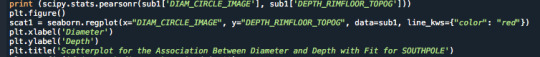
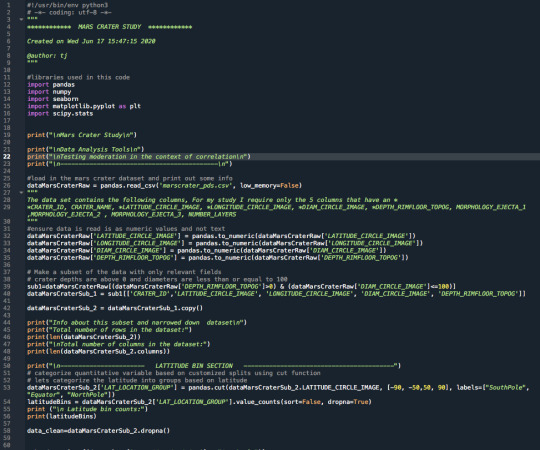
The syntax of the code used to run the correlation and plot the results is:
2.1 South Pole
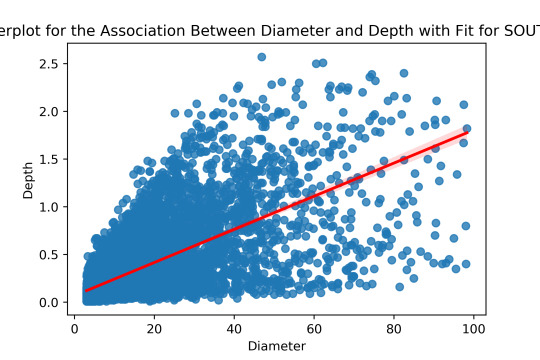
The results for the Southpole show that the correlation coefficient is positive and a value of 0.69 is shown. This shows and increasing trend with larger diameter craters are often deeper. The coefficient is somewhat close to 1 which shows a strong relationship.
The p value is significant with a value of 0 indicating that there is a relationship between diameter and depth.
The results from the code are:
******************** Association between crater diameter and crater depth for SOUTHPOLE (0.6909785490096341, 0.0)
2.2 Equator
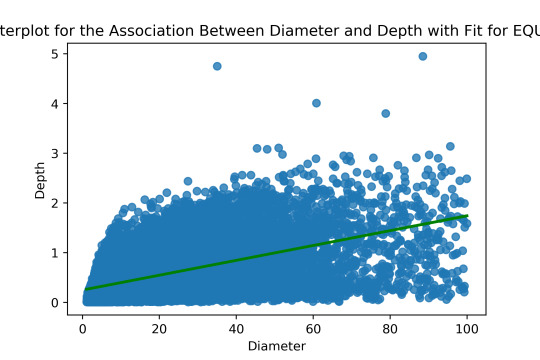
The results for the Southpole show that the correlation coefficient is positive and a value of 0.51 is shown. This shows and increasing trend with larger diameter craters are often deeper. The coefficient is almost between 0 and 1 which shows a moderate weak relationship.
The p value is significant with a value of 0 indicating that there is a relationship between diameter and depth.
The results from the code are:
******************** Association between crater diameter and crater depth for EQUATOR (0.5141921407957738, 0.0)
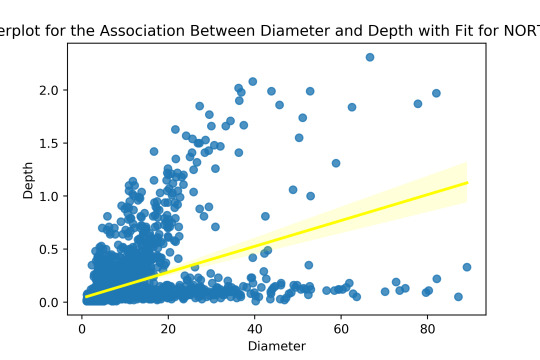
2.1 North Pole
The results for the Southpole show that the correlation coefficient is positive and a value of 0.49 is shown. This shows and increasing trend with larger diameter craters are often deeper. The coefficient is in the middle of 1 and 0 which shows a weak relationship.
The p value is significant with a value of approximately 0 indicating that there is a relationship between diameter and depth.
The results from the code are:
******************** Association between crater diameter and crater depth for NORTHPOLE (0.4687330023740152, 8.270884773408035e-184)
2.4 Scatter plots
Scatter plots for each of the latitude locations were plotted and show that the strongest moderator effect is at the south pole and as the craters travel to the north the correlation is weaker. At the south there is a stronger relationship between diameter and depth than near the equator or north poles.
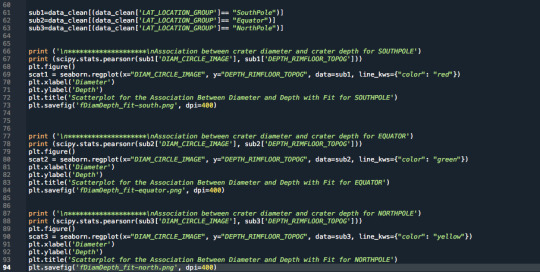
3.Raw Python Code:
The raw Python code is shown in the photos below. I decided to use screenshots for easier readability as it includes syntax highlighting.
4.Code Output:
Below is the raw output from the code. The interpretation and comments on the results are shown above in Section 2.
Mars Crater Study
Data Analysis Tools
Testing moderation in the context of correlation
-------------------------------------------
Info about this subset and narrowed down dataset
Total number of rows in the dataset: 76520
Total number of columns in the dataset: 5
----------------------- LATTITUDE BIN SECTION -----------------------------------------
Latitude bin counts: SouthPole 9909 Equator 63239 NorthPole 3372 Name: LAT_LOCATION_GROUP, dtype: int64
******************** Association between crater diameter and crater depth for SOUTHPOLE (0.6909785490096341, 0.0)
******************** Association between crater diameter and crater depth for EQUATOR (0.5141921407957738, 0.0)
******************** Association between crater diameter and crater depth for NORTHPOLE (0.4687330023740152, 8.270884773408035e-184)
0 notes
Text
Data Analysis Tools Week 3 Generating a Correlation Coefficient
1.Background
I have decided to look at Mars craters and ask the following question:
A. Is the depth dependant on the diameter of the crater? The dataset was limited to craters that had a diameter of 100 km or less and a crater depth that was greater than 0 km.
2.Notes about the Results
2.1 The code generated a correlation coefficient between two qualitative variables, the diameter of the crater and the depth of the crater.
The python suntax that was used is:
print ('association between crater diameter and crater depth') print (scipy.stats.pearsonr(data_clean['DIAM_CIRCLE_IMAGE'], data_clean['DEPTH_RIMFLOOR_TOPOG']))
* see section 3 for full code and section 4 for code output
The results from the code show the following:
association between crater diameter and crater depth (0.5268779814292375, 0.0)
The correlation coefficient is 0.527 and positive indicating a positive relationship between the diameter and the depth of the crater; with increasing crater diameters there is an increase in depth. The p value is 0 and less than 0.05 indicating that we reject the null hypothesis. The relationship is statistically significant. The linear correlation coefficient is not a very strong linear relationship as the coefficient lies close to halfway between 0 and 1.
RSquared or Coefficient of Determination was found to be 0.277. This indicates we can predict approximately 28% of the variability if we know the diameter.
A plotted curve fit of the correlation is shown in the figure below.
3.Raw Python Code:
The raw Python code is shown in the photos below. I decided to use screenshots for easier readability as it includes syntax highlighting.
4.Code Output:
Below is the raw output from the code. The interpretation and comments on the results are shown above in Section 2.
Mars Crater Study
Data Analysis Tools
Generating a Correlation Coefficient
-------------------------------------------
Info about this subset and narrowed down dataset
Total number of rows in the dataset: 76520
Total number of columns in the dataset: 5 association between crater diameter and crater depth (0.5268779814292375, 0.0)
0 notes
Text
Data Analysis Tools Week 2 Running a Chi-Square Test of Independence
1.Background
I have decided to look at Mars craters and ask the following question:
A. Are shallower depth craters associated with locations near the North and South poles of Mars?” The dataset was limited to craters that had a diameter of 100 km or less and a crater depth that was greater than 0 km.
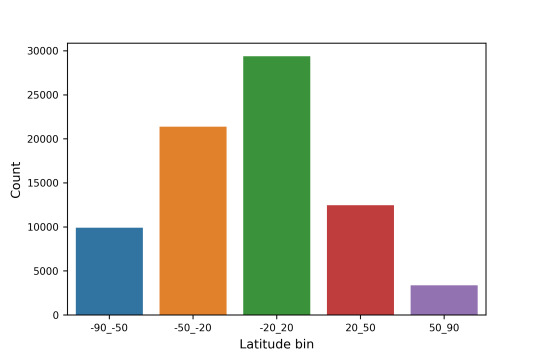
I divided up the latitude of the planet into 5 bins based on the latitude degree increments/bins to see if there was a significant difference between the latitude of these groups and the depth of the crater.
I classified the crater as either being shallow or deep based on the crater depth. The cutoff was chosen to be 180m.
2.Notes about the Results
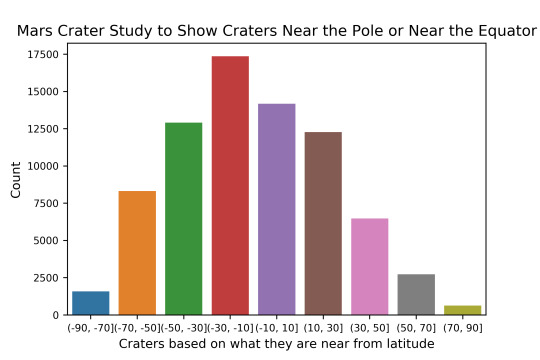
2.1 The crater count based on the latitude is shown below:
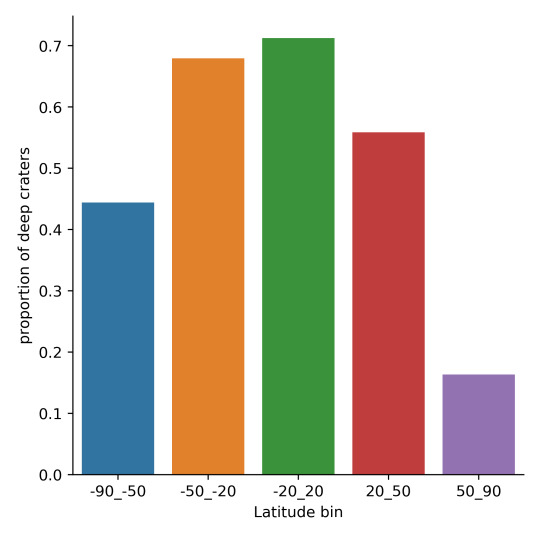
2.2 The crater classification is based on the plot below, where the majority of the craters are classified as deep.

2.3 The overall mean deep craters are shown in the plot below. There seems to be a correlation between latitude and depth of the crater, with a higher concentration of deep craters near the equator of the planet. Lets perform a Chi-squared analysis to further investigate.
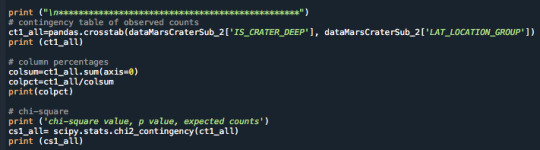
The Chi Squared test was run in Python and the full code is below in section 3. The full results are shown in section 4.
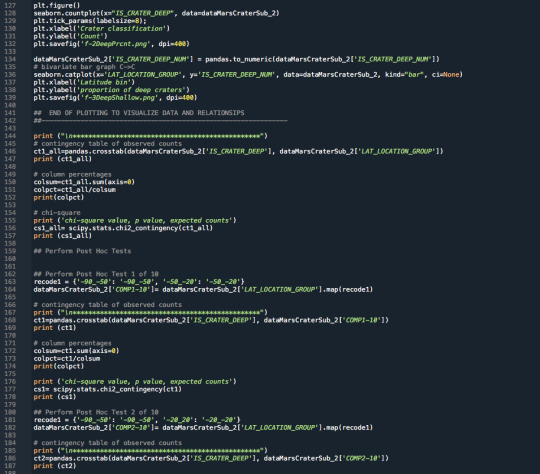
For example the Chi squared test that was coded was written as follows:
The output showed that the p value was under 0.05 and the value was 0.0 indicating that a Post Hoc test was necessary. The p value showed that the alternate hypothesis is to be accepted and there is a correlation between deep craters and the latitude.
Response Variable Categorical 2 Levels: Crater Depth (shallow or deep)
************************************************ LAT_LOCATION_GROUP -90_-50 -50_-20 -20_20 20_50 50_90 IS_CRATER_DEEP SHALLOW 5507 6847 8449 5501 2821 DEEP 4402 14528 20948 6966 551 LAT_LOCATION_GROUP -90_-50 -50_-20 -20_20 20_50 50_90 IS_CRATER_DEEP SHALLOW 0.555757 0.320327 0.28741 0.441245 0.836595 DEEP 0.444243 0.679673 0.71259 0.558755 0.163405 chi-square value, p value, expected counts (5870.45780474349, 0.0, 4, array([[ 3771.55808939, 8135.74065604, 11189.06985102, 4745.18263199, 1283.44877156], [ 6137.44191061, 13239.25934396, 18207.93014898, 7721.81736801, 2088.55122844]]))
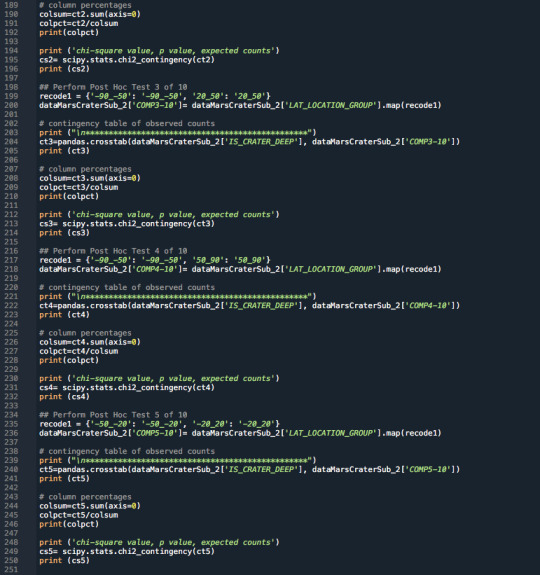
An example Post Hoc test was coded as follows:
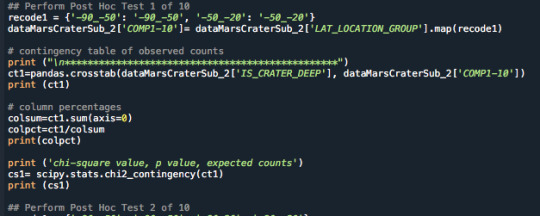
The output showed that the p value was 0.0 indicating the was under the Bonferroni adjustment and the null hypothesis was rejected indicating there is a correlation between latitude groups (-90 to -50 and -50 to -20):
************************************************ COMP1-10 -50_-20 -90_-50 IS_CRATER_DEEP SHALLOW 6847 5507 DEEP 14528 4402 COMP1-10 -50_-20 -90_-50 IS_CRATER_DEEP SHALLOW 0.320327 0.555757 DEEP 0.679673 0.444243 chi-square value, p value, expected counts (1569.4618848788969, 0.0, 1, array([[ 8440.95224396, 3913.04775604], [12934.04775604, 5995.95224396]]))
A table summarizing the results of the 10 Chi Square results are shown below. It shows that we can not accept the null hypothesis and there is a correlation between latitude and crater depth. There is a stronger correlation when looking at the areas close to the poles vs the equator.

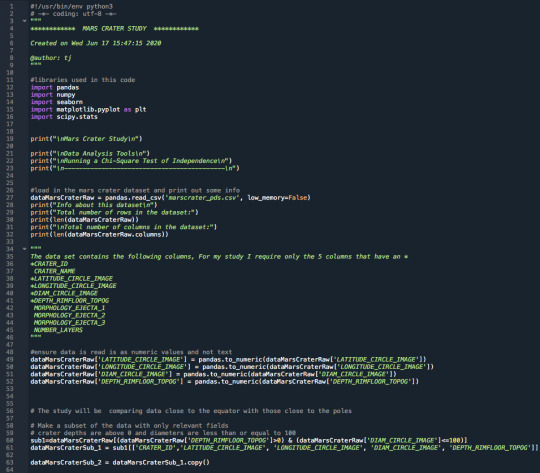
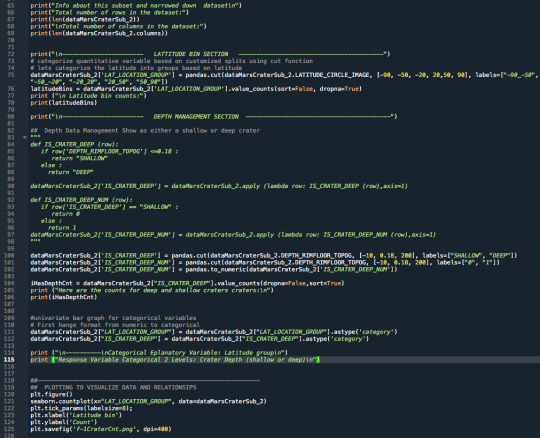
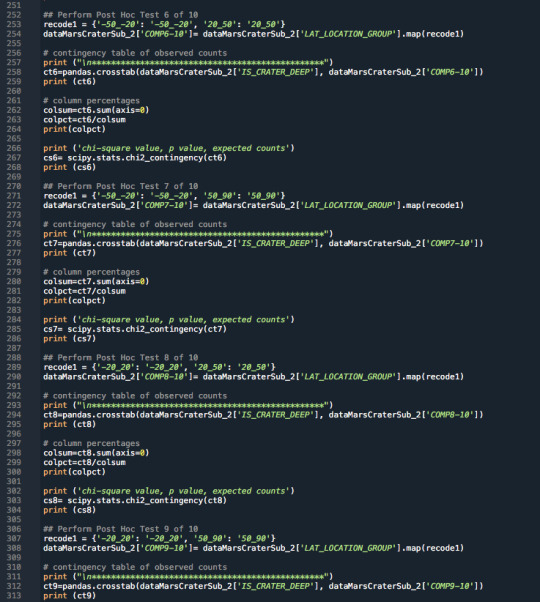
3.Raw Python Code:
The raw Python code is shown in the photos below. I decided to use screenshots for easier readability as it includes syntax highlighting.

4.Code Output:
Below is the raw output from the code. The interpretation and comments on the results are shown above in Section 2.
Mars Crater Study
Data Analysis Tools
Running a Chi-Square Test of Independence
-------------------------------------------
Info about this dataset
Total number of rows in the dataset: 384343
Total number of columns in the dataset: 10 Info about this subset and narrowed down dataset
Total number of rows in the dataset: 76520
Total number of columns in the dataset: 5
----------------------- LATTITUDE BIN SECTION -----------------------------------------
Latitude bin counts: -90_-50 9909 -50_-20 21375 -20_20 29397 20_50 12467 50_90 3372 Name: LAT_LOCATION_GROUP, dtype: int64
----------------------- DEPTH MANAGEMENT SECTION ----------------------------------------- Here are the counts for deep and shallow craters craters:
DEEP 47395 SHALLOW 29125 Name: IS_CRATER_DEEP, dtype: int64
---------- Categorical Eplanatory Variable: Latitude group
Response Variable Categorical 2 Levels: Crater Depth (shallow or deep)
************************************************ LAT_LOCATION_GROUP -90_-50 -50_-20 -20_20 20_50 50_90 IS_CRATER_DEEP SHALLOW 5507 6847 8449 5501 2821 DEEP 4402 14528 20948 6966 551 LAT_LOCATION_GROUP -90_-50 -50_-20 -20_20 20_50 50_90 IS_CRATER_DEEP SHALLOW 0.555757 0.320327 0.28741 0.441245 0.836595 DEEP 0.444243 0.679673 0.71259 0.558755 0.163405 chi-square value, p value, expected counts (5870.45780474349, 0.0, 4, array([[ 3771.55808939, 8135.74065604, 11189.06985102, 4745.18263199, 1283.44877156], [ 6137.44191061, 13239.25934396, 18207.93014898, 7721.81736801, 2088.55122844]]))
************************************************ COMP1-10 -50_-20 -90_-50 IS_CRATER_DEEP SHALLOW 6847 5507 DEEP 14528 4402 COMP1-10 -50_-20 -90_-50 IS_CRATER_DEEP SHALLOW 0.320327 0.555757 DEEP 0.679673 0.444243 chi-square value, p value, expected counts (1569.4618848788969, 0.0, 1, array([[ 8440.95224396, 3913.04775604], [12934.04775604, 5995.95224396]]))
************************************************ COMP2-10 -20_-20 -90_-50 IS_CRATER_DEEP SHALLOW 8449 5507 DEEP 20948 4402 COMP2-10 -20_-20 -90_-50 IS_CRATER_DEEP SHALLOW 0.28741 0.555757 DEEP 0.71259 0.444243 chi-square value, p value, expected counts (2329.314932557565, 0.0, 1, array([[10437.70752557, 3518.29247443], [18959.29247443, 6390.70752557]]))
************************************************ COMP3-10 -90_-50 20_50 IS_CRATER_DEEP SHALLOW 5507 5501 DEEP 4402 6966 COMP3-10 -90_-50 20_50 IS_CRATER_DEEP SHALLOW 0.555757 0.441245 DEEP 0.444243 0.558755 chi-square value, p value, expected counts (289.20138905047946, 7.422790875630638e-65, 1, array([[4874.78870218, 6133.21129782], [5034.21129782, 6333.78870218]]))
************************************************ COMP4-10 -90_-50 50_90 IS_CRATER_DEEP SHALLOW 5507 2821 DEEP 4402 551 COMP4-10 -90_-50 50_90 IS_CRATER_DEEP SHALLOW 0.555757 0.836595 DEEP 0.444243 0.163405 chi-square value, p value, expected counts (847.2982157758986, 2.811519087431208e-186, 1, array([[6213.54958211, 2114.45041789], [3695.45041789, 1257.54958211]]))
************************************************ COMP5-10 -20_20 -50_-20 IS_CRATER_DEEP SHALLOW 8449 6847 DEEP 20948 14528 COMP5-10 -20_20 -50_-20 IS_CRATER_DEEP SHALLOW 0.28741 0.320327 DEEP 0.71259 0.679673 chi-square value, p value, expected counts (63.54773843933685, 1.5652720877138506e-15, 1, array([[ 8856.38761522, 6439.61238478], [20540.61238478, 14935.38761522]]))
************************************************ COMP6-10 -50_-20 20_50 IS_CRATER_DEEP SHALLOW 6847 5501 DEEP 14528 6966 COMP6-10 -50_-20 20_50 IS_CRATER_DEEP SHALLOW 0.320327 0.441245 DEEP 0.679673 0.558755 chi-square value, p value, expected counts (496.2855186756665, 6.111846388145869e-110, 1, array([[ 7799.14012174, 4548.85987826], [13575.85987826, 7918.14012174]]))
************************************************ COMP7-10 -50_-20 50_90 IS_CRATER_DEEP SHALLOW 6847 2821 DEEP 14528 551 COMP7-10 -50_-20 50_90 IS_CRATER_DEEP SHALLOW 0.320327 0.836595 DEEP 0.679673 0.163405 chi-square value, p value, expected counts (3258.881845816943, 0.0, 1, array([[ 8350.64856346, 1317.35143654], [13024.35143654, 2054.64856346]]))
************************************************ COMP8-10 -20_20 20_50 IS_CRATER_DEEP SHALLOW 8449 5501 DEEP 20948 6966 COMP8-10 -20_20 20_50 IS_CRATER_DEEP SHALLOW 0.28741 0.441245 DEEP 0.71259 0.558755 chi-square value, p value, expected counts (931.7404706337541, 1.2358200405213006e-204, 1, array([[ 9795.72305561, 4154.27694439], [19601.27694439, 8312.72305561]]))
************************************************ COMP9-10 -20_20 50_90 IS_CRATER_DEEP SHALLOW 8449 2821 DEEP 20948 551 COMP9-10 -20_20 50_90 IS_CRATER_DEEP SHALLOW 0.28741 0.836595 DEEP 0.71259 0.163405 chi-square value, p value, expected counts (4040.9902387527836, 0.0, 1, array([[10110.29295981, 1159.70704019], [19286.70704019, 2212.29295981]]))
************************************************ COMP10-10 20_50 50_90 IS_CRATER_DEEP SHALLOW 5501 2821 DEEP 6966 551 COMP10-10 20_50 50_90 IS_CRATER_DEEP SHALLOW 0.441245 0.836595 DEEP 0.558755 0.163405 chi-square value, p value, expected counts (1662.095048322109, 0.0, 1, array([[6550.31087821, 1771.68912179], [5916.68912179, 1600.31087821]]))
0 notes
Text
Data Analysis Tools - Running an analysis of variance Week 1 Assignment
1.Background
I have decided to look at Mars craters and ask the following question:
A. Are shallower depth craters associated with locations near the North and South poles of Mars?” The dataset was limited to craters that had a diameter of 100 km or less and a crater depth that was greater than 0 km.
I divided up the latitude of the planet in 20 degree increments/bins to see if there was a significant difference between the latitude of these groups and the depth of the crater.
2.Notes about the Results
2.1 The plot below shows that the crateres were divided into those located in bins of 20 degree increments. The majority of the craters are around the equator areas.
2.2 ANOVA
I initially ran the ANOVA against th category of Latitude bins against greater depth.
Null Hypothesis: There is no relationship between the latitude and the depth of the craters (All means are equal)
Alternate Hypothesis: There is a relationship between the latitude and the depth of the craters (not all means are equal)
The full output from the code is in section 4 below, but the ANOVA results showed a p result of 0.00 which is less than or equal to 0.05, indicating that we reject the Null hypothesis as there is a relationship.
# using ols function for calculating the F-statistic and associated p value model1 = smf.ols(formula='DEPTH_RIMFLOOR_TOPOG ~ C(LAT_LOCATION_GROUP)', data=sub2).fit()
F-statistic: 490.9 Prob (F-statistic): 0.00
The means were not equal:
DEPTH_RIMFLOOR_TOPOG LAT_LOCATION_GROUP (-90, -70] 0.286278 (-70, -50] 0.295007 (-50, -30] 0.358990 (-30, -10] 0.460296 (-10, 10] 0.425274 (10, 30] 0.395404 (30, 50] 0.294638 (50, 70] 0.136315 (70, 90] 0.135931
2.2 POST HOC TEST
Running the Post Hoc test with the Tukey test revealed that there is a relationship between the latitude and the depth of the crater. However at certain locations the means are equal suggesting that at certain latitudes there is no difference. For example the 40 degrees latitude near the south pole have similar means, but comparing the latitude near the south pole to the equator showed very different results. The code was run with the following snytax and the output is below.
mc1 = multi.MultiComparison(sub2['DEPTH_RIMFLOOR_TOPOG'], sub2['LAT_LOCATION_GROUP']) res1 = mc1.tukeyhsd()
Multiple Comparison of Means - Tukey HSD, FWER=0.05 =========================================================== group1 group2 meandiff p-adj lower upper reject ----------------------------------------------------------- (-90, -70] (-70, -50] 0.0087 0.9 -0.0207 0.0381 False (-90, -70] (-50, -30] 0.0727 0.001 0.0441 0.1013 True (-90, -70] (-30, -10] 0.174 0.001 0.1459 0.2022 True (-90, -70] (-10, 10] 0.139 0.001 0.1106 0.1674 True (-90, -70] (10, 30] 0.1091 0.001 0.0805 0.1378 True (-90, -70] (30, 50] 0.0084 0.9 -0.0217 0.0384 False (-90, -70] (50, 70] -0.15 0.001 -0.1838 -0.1161 True (-90, -70] (70, 90] -0.1503 0.001 -0.2008 -0.0999 True (-70, -50] (-50, -30] 0.064 0.001 0.0489 0.0791 True (-70, -50] (-30, -10] 0.1653 0.001 0.151 0.1796 True (-70, -50] (-10, 10] 0.1303 0.001 0.1154 0.1451 True (-70, -50] (10, 30] 0.1004 0.001 0.0852 0.1156 True (-70, -50] (30, 50] -0.0004 0.9 -0.0181 0.0174 False (-70, -50] (50, 70] -0.1587 0.001 -0.1823 -0.135 True (-70, -50] (70, 90] -0.1591 0.001 -0.2033 -0.1148 True (-50, -30] (-30, -10] 0.1013 0.001 0.0888 0.1138 True (-50, -30] (-10, 10] 0.0663 0.001 0.0532 0.0793 True (-50, -30] (10, 30] 0.0364 0.001 0.0229 0.0499 True (-50, -30] (30, 50] -0.0644 0.001 -0.0807 -0.048 True (-50, -30] (50, 70] -0.2227 0.001 -0.2453 -0.2001 True (-50, -30] (70, 90] -0.2231 0.001 -0.2667 -0.1794 True (-30, -10] (-10, 10] -0.035 0.001 -0.0472 -0.0229 True (-30, -10] (10, 30] -0.0649 0.001 -0.0775 -0.0522 True (-30, -10] (30, 50] -0.1657 0.001 -0.1813 -0.15 True (-30, -10] (50, 70] -0.324 0.001 -0.3461 -0.3019 True (-30, -10] (70, 90] -0.3244 0.001 -0.3678 -0.281 True (-10, 10] (10, 30] -0.0299 0.001 -0.0431 -0.0166 True (-10, 10] (30, 50] -0.1306 0.001 -0.1467 -0.1145 True (-10, 10] (50, 70] -0.289 0.001 -0.3114 -0.2665 True (-10, 10] (70, 90] -0.2893 0.001 -0.3329 -0.2458 True (10, 30] (30, 50] -0.1008 0.001 -0.1172 -0.0843 True (10, 30] (50, 70] -0.2591 0.001 -0.2818 -0.2364 True (10, 30] (70, 90] -0.2595 0.001 -0.3032 -0.2158 True (30, 50] (50, 70] -0.1583 0.001 -0.1828 -0.1339 True (30, 50] (70, 90] -0.1587 0.001 -0.2034 -0.114 True (50, 70] (70, 90] -0.0004 0.9 -0.0477 0.0469 False -----------------------------------------------------------
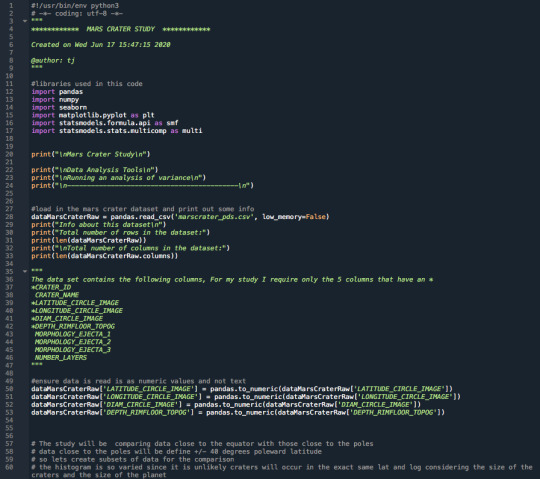
3.Raw Python Code:
The raw Python code is shown in the photos below. I decided to use screenshots for easier readability as it includes syntax highlighting.
4.Code Output:
Below is the raw output from the code. The interpretation and comments on the results are shown above in Section 2.
Mars Crater Study
Data Analysis Tools
Running an analysis of variance
-------------------------------------------
Info about this dataset
Total number of rows in the dataset: 384343
Total number of columns in the dataset: 10 Info about this subset and narrowed down dataset
Total number of rows in the dataset: 76520
Total number of columns in the dataset: 5
----------------------- LATTITUDE BIN SECTION -----------------------------------------
Latitude bin counts: (-90, -70] 1585 (-70, -50] 8324 (-50, -30] 12919 (-30, -10] 17375 (-10, 10] 14180 (10, 30] 12280 (30, 50] 6485 (50, 70] 2738 (70, 90] 634 Name: LAT_LOCATION_GROUP, dtype: int64 Here are the counts for craters in 20 degree bins based on latitude (-30, -10] 17375 (-10, 10] 14180 (-50, -30] 12919 (10, 30] 12280 (-70, -50] 8324 (30, 50] 6485 (50, 70] 2738 (-90, -70] 1585 (70, 90] 634 Name: LAT_LOCATION_GROUP, dtype: int64 Here are the counts for craters in 20 degree bins based on latitude (-30, -10] 0.227065 (-10, 10] 0.185311 (-50, -30] 0.168832 (10, 30] 0.160481 (-70, -50] 0.108782 (30, 50] 0.084749 (50, 70] 0.035781 (-90, -70] 0.020714 (70, 90] 0.008285 Name: LAT_LOCATION_GROUP, dtype: float64 OLS Regression
Eplanatory Variable: Latitude group
Response Variable: Crater Depth
OLS Regression Results ================================================================================ Dep. Variable: DEPTH_RIMFLOOR_TOPOG R-squared: 0.049 Model: OLS Adj. R-squared: 0.049 Method: Least Squares F-statistic: 490.9 Date: Thu, 25 Jun 2020 Prob (F-statistic): 0.00 Time: 11:21:22 Log-Likelihood: -27382. No. Observations: 76520 AIC: 5.478e+04 Df Residuals: 76511 BIC: 5.486e+04 Df Model: 8 Covariance Type: nonrobust =============================================================================================================================== coef std err t P>|t| [0.025 0.975] ------------------------------------------------------------------------------------------------------------------------------- Intercept 0.2863 0.009 32.931 0.000 0.269 0.303 C(LAT_LOCATION_GROUP)[T.Interval(-70, -50, closed='right')] 0.0087 0.009 0.920 0.357 -0.010 0.027 C(LAT_LOCATION_GROUP)[T.Interval(-50, -30, closed='right')] 0.0727 0.009 7.894 0.000 0.055 0.091 C(LAT_LOCATION_GROUP)[T.Interval(-30, -10, closed='right')] 0.1740 0.009 19.163 0.000 0.156 0.192 C(LAT_LOCATION_GROUP)[T.Interval(-10, 10, closed='right')] 0.1390 0.009 15.164 0.000 0.121 0.157 C(LAT_LOCATION_GROUP)[T.Interval(10, 30, closed='right')] 0.1091 0.009 11.814 0.000 0.091 0.127 C(LAT_LOCATION_GROUP)[T.Interval(30, 50, closed='right')] 0.0084 0.010 0.862 0.389 -0.011 0.027 C(LAT_LOCATION_GROUP)[T.Interval(50, 70, closed='right')] -0.1500 0.011 -13.729 0.000 -0.171 -0.129 C(LAT_LOCATION_GROUP)[T.Interval(70, 90, closed='right')] -0.1503 0.016 -9.244 0.000 -0.182 -0.118 ============================================================================== Omnibus: 33558.123 Durbin-Watson: 1.257 Prob(Omnibus): 0.000 Jarque-Bera (JB): 189495.964 Skew: 2.067 Prob(JB): 0.00 Kurtosis: 9.508 Cond. No. 23.1 ==============================================================================
Warnings: [1] Standard Errors assume that the covariance matrix of the errors is correctly specified. means for crater depth by latitude group DEPTH_RIMFLOOR_TOPOG LAT_LOCATION_GROUP (-90, -70] 0.286278 (-70, -50] 0.295007 (-50, -30] 0.358990 (-30, -10] 0.460296 (-10, 10] 0.425274 (10, 30] 0.395404 (30, 50] 0.294638 (50, 70] 0.136315 (70, 90] 0.135931 standard deviations for crater depth by latitude group DEPTH_RIMFLOOR_TOPOG LAT_LOCATION_GROUP (-90, -70] 0.331280 (-70, -50] 0.353152 (-50, -30] 0.352421 (-30, -10] 0.363237 (-10, 10] 0.353117 (10, 30] 0.345958 (30, 50] 0.311536 (50, 70] 0.232491 (70, 90] 0.254736 Post Hoc Analysis
Multiple Comparison of Means - Tukey HSD, FWER=0.05 =========================================================== group1 group2 meandiff p-adj lower upper reject ----------------------------------------------------------- (-90, -70] (-70, -50] 0.0087 0.9 -0.0207 0.0381 False (-90, -70] (-50, -30] 0.0727 0.001 0.0441 0.1013 True (-90, -70] (-30, -10] 0.174 0.001 0.1459 0.2022 True (-90, -70] (-10, 10] 0.139 0.001 0.1106 0.1674 True (-90, -70] (10, 30] 0.1091 0.001 0.0805 0.1378 True (-90, -70] (30, 50] 0.0084 0.9 -0.0217 0.0384 False (-90, -70] (50, 70] -0.15 0.001 -0.1838 -0.1161 True (-90, -70] (70, 90] -0.1503 0.001 -0.2008 -0.0999 True (-70, -50] (-50, -30] 0.064 0.001 0.0489 0.0791 True (-70, -50] (-30, -10] 0.1653 0.001 0.151 0.1796 True (-70, -50] (-10, 10] 0.1303 0.001 0.1154 0.1451 True (-70, -50] (10, 30] 0.1004 0.001 0.0852 0.1156 True (-70, -50] (30, 50] -0.0004 0.9 -0.0181 0.0174 False (-70, -50] (50, 70] -0.1587 0.001 -0.1823 -0.135 True (-70, -50] (70, 90] -0.1591 0.001 -0.2033 -0.1148 True (-50, -30] (-30, -10] 0.1013 0.001 0.0888 0.1138 True (-50, -30] (-10, 10] 0.0663 0.001 0.0532 0.0793 True (-50, -30] (10, 30] 0.0364 0.001 0.0229 0.0499 True (-50, -30] (30, 50] -0.0644 0.001 -0.0807 -0.048 True (-50, -30] (50, 70] -0.2227 0.001 -0.2453 -0.2001 True (-50, -30] (70, 90] -0.2231 0.001 -0.2667 -0.1794 True (-30, -10] (-10, 10] -0.035 0.001 -0.0472 -0.0229 True (-30, -10] (10, 30] -0.0649 0.001 -0.0775 -0.0522 True (-30, -10] (30, 50] -0.1657 0.001 -0.1813 -0.15 True (-30, -10] (50, 70] -0.324 0.001 -0.3461 -0.3019 True (-30, -10] (70, 90] -0.3244 0.001 -0.3678 -0.281 True (-10, 10] (10, 30] -0.0299 0.001 -0.0431 -0.0166 True (-10, 10] (30, 50] -0.1306 0.001 -0.1467 -0.1145 True (-10, 10] (50, 70] -0.289 0.001 -0.3114 -0.2665 True (-10, 10] (70, 90] -0.2893 0.001 -0.3329 -0.2458 True (10, 30] (30, 50] -0.1008 0.001 -0.1172 -0.0843 True (10, 30] (50, 70] -0.2591 0.001 -0.2818 -0.2364 True (10, 30] (70, 90] -0.2595 0.001 -0.3032 -0.2158 True (30, 50] (50, 70] -0.1583 0.001 -0.1828 -0.1339 True (30, 50] (70, 90] -0.1587 0.001 -0.2034 -0.114 True (50, 70] (70, 90] -0.0004 0.9 -0.0477 0.0469 False -----------------------------------------------------------
0 notes
Text
Data Management and Visualization - Week 4 - Creating Graphs Week 4 Assignment
1.Background
I have decided to look at Mars craters and ask the following questions:
A. Is the depth dependant on the diameter of the crater? B. Are shallower depth craters associated with locations near the North and South poles of Mars?” (close to poles defined as +/- 40 degrees latitude) The dataset was limited to craters that had a diameter of 100 km or less and a crater depth that was greater than 0 km.
My code outputs creates frequency distributions for the relevant data variables that will be used to answer the hypothesis questions and does a correlations between variables. I am particularly interested in the crater latitude, the diameter and the depth of the crater. The plots are shown in Section 2.
2.Notes about the Results
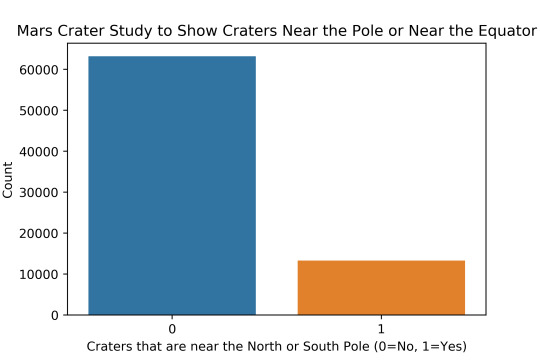
2.1 The plot below shows that the crateres were divided into those located close to the poles and those located close to the equator. The result is that the majority of craters are not located close to the poles.
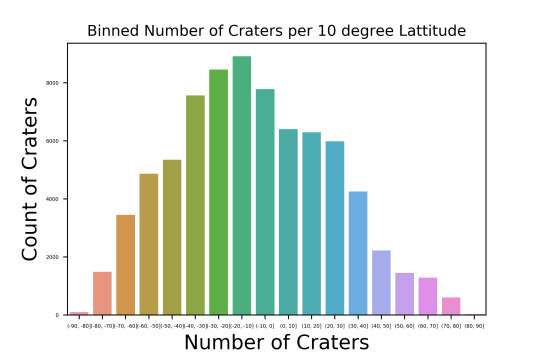
2.2 The plot below shows the count of craters and that most of the craters are located just south of the equator. There plot is a unimodal distribution. The center is just south of the equator and the spread covers the entire latitude showing their are craters all over the planet.
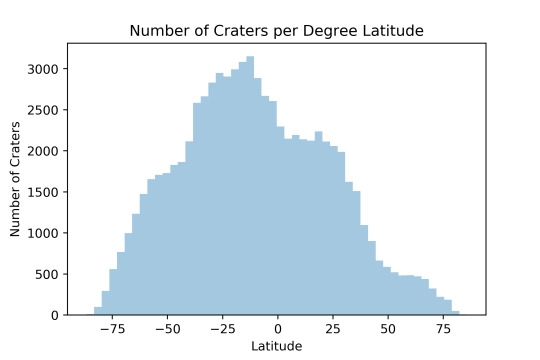
2.3 The plot below shows the count of craters binned into groups of 1- degrees and that most of the craters are located just south of the equator. There is unimodal distribution and this is a modified version of the plot above. The spread covers the entire latitude of the planet.
2.4 The plot below shows the distribution plot for the diameters of craters. The plot is skewed right. The standard deviation is 12km with the max diameter being just under 100km

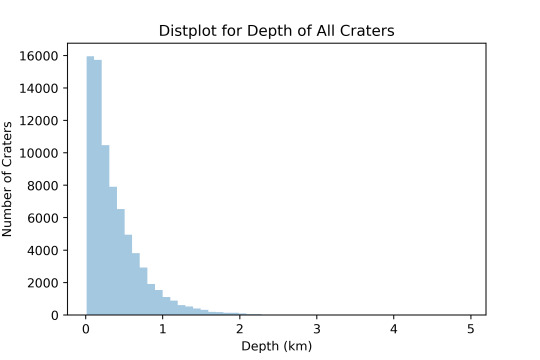
2.5 The plot below shows the distribution plot for the diameters of craters. The plot is skewed right with the center located just above 0. The majority of the craters are under 1 km in depth with the mode just slightly above 0 km.
2.6 The plot below shows the scatter plot comparing the association with diameter and depth of the crater. The explanatory variable is the crater depth and the response variable is the depth. The plot shows that there is a general trend to have deeper depths as the crater diameter increases. A positive relationship is shown.
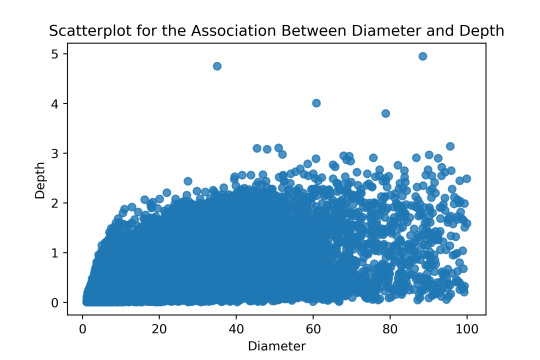
2.7 The plot below shows the scatter plot comparing the association with diameter and depth of the crater. There is a best fit line drawn through the data that shows that as the diameter of the crater increases the depth of the crater increases.

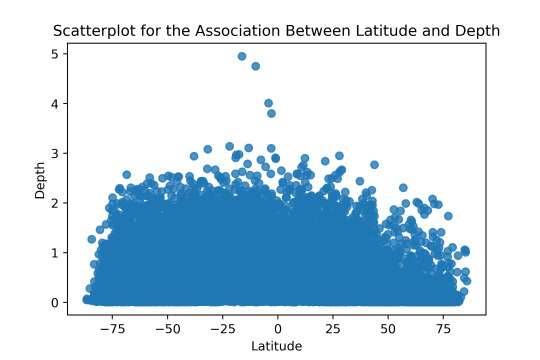
2.8 The plot below shows a scatter plot comparing the latitude of the crater with the depth of the crater. The plot shows that near the poles the depth of the crater is smaller as is shown by the low y values near the extents or poles.
More output is shown in section 4 where the distributions are described from the python code.
3.Raw Python Code:
The raw Python code is shown in the photos below. I decided to use screenshots for easier readability as it includes syntax highlighting.
4.Code Output:
Below is the raw output from the code. The interpretation and comments on the results are shown above in Section 2.
Mars Crater Study
Info about this dataset
Total number of rows in the dataset: 384343
Total number of columns in the dataset: 10
----------------------- NEAR POLE OF PLANET SECTION ----------------------------------------- Here are the counts for craters close to the pole =1 for close to poles 0 63239 1 13281 Name: IS_NEAR_POLE, dtype: int64 Here are the percentages for craters close to the pole =1 for close to poles 0 0.826438 1 0.173562 Name: IS_NEAR_POLE, dtype: float64
----------------------- LATTITUDE BIN SECTION -----------------------------------------
Latitude bin counts: (-90, -80] 100 (-80, -70] 1485 (-70, -60] 3452 (-60, -50] 4872 (-50, -40] 5353 (-40, -30] 7566 (-30, -20] 8456 (-20, -10] 8919 (-10, 0] 7780 (0, 10] 6400 (10, 20] 6298 (20, 30] 5982 (30, 40] 4259 (40, 50] 2226 (50, 60] 1451 (60, 70] 1287 (70, 80] 604 (80, 90] 30 Name: LATITUDE_CIRCLE_IMAGE_10, dtype: int64
Latitude Described: count 76520.000000 mean -9.997340 std 33.599395 min -86.700000 25% -34.660500 50% -12.159000 75% 14.828000 max 85.702000 Name: LATITUDE_CIRCLE_IMAGE, dtype: float64
Latitude Binned Described: count 76520 unique 18 top (-20, -10] freq 8919 Name: LATITUDE_CIRCLE_IMAGE_10, dtype: object
----------------------- CRATER DIAMETER SECTION ----------------------------------------- ------- Diameter Bins ----------- [ 1.06 3.58 5.85 12.0225 99.97 ]
Crater Diameter - 4 categories - quartiles 1=0%tile 19225 2=25%tile 19054 3=50%tile 19111 4=75%tile 19130 Name: DIAM_CIRCLE_4, dtype: int64 -------------------- DIAM_CIRCLE_IMAGE 1.06 1.08 1.10 1.11 ... 99.33 99.35 99.92 99.97 DIAM_CIRCLE_4 ... 1=0%tile 1 1 1 1 ... 0 0 0 0 2=25%tile 0 0 0 0 ... 0 0 0 0 3=50%tile 0 0 0 0 ... 0 0 0 0 4=75%tile 0 0 0 0 ... 2 1 1 1
[4 rows x 5889 columns]
----------------------- CRATER DEPTH SECTION ----------------------------------------- ------- Depth Bins ----------- [0.01 0.26 4.95]
Crater Depth - 2 halves - lower and upper bins 1=Lower 38378 2=Upper 38142 Name: DEPTH_RIMFLOOR_TOPOG_4, dtype: int64 -------------------- DEPTH_RIMFLOOR_TOPOG 0.01 0.02 0.03 0.04 ... 3.80 4.01 4.75 4.95 DEPTH_RIMFLOOR_TOPOG_4 ... 1=Lower 404 862 1301 1644 ... 0 0 0 0 2=Upper 0 0 0 0 ... 1 1 1 1
[2 rows x 280 columns]
All Depths Described: count 76520.000000 mean 0.376384 std 0.354846 min 0.010000 25% 0.120000 50% 0.260000 75% 0.520000 max 4.950000 Name: DEPTH_RIMFLOOR_TOPOG, dtype: float64
----------------------- HYPOTHESIS SECTION -----------------------------------------
----Diameter described: count 76520.000000 mean 10.537621 std 12.353504 min 1.060000 25% 3.580000 50% 5.850000 75% 12.022500 max 99.970000 Name: DIAM_CIRCLE_IMAGE, dtype: float64
----Depth described: count 76520.000000 mean 0.376384 std 0.354846 min 0.010000 25% 0.120000 50% 0.260000 75% 0.520000 max 4.950000 Name: DEPTH_RIMFLOOR_TOPOG, dtype: float64
----Depth described: count 76520.000000 mean -9.997340 std 33.599395 min -86.700000 25% -34.660500 50% -12.159000 75% 14.828000 max 85.702000 Name: LATITUDE_CIRCLE_IMAGE, dtype: float64
0 notes
Text
Data Management and Visualization - Week 3 - Making Data Management Decisions Mars Crater Study
Week 3 Assignment
1.Background
I have decided to look at Mars craters and ask the following questions:
A. Is the depth dependant on the diameter of the crater? B. Are shallower depth craters associated with locations near the North and South poles of Mars?” (close to poles defined as +/- 40 degrees latitude)
My code outputs creates frequency distributions for the relevant data variables that will be used to answer the hypothesis questions. I am particularly interested in the crater latitude, the diameter and the depth of the crater.
For this reason the data management portion focuses on making decisions for these variables.
2.Notes about the Results
2.1 Locations
As can be imaged the distribution varies widely as the location of the craters vary widely across the planet and it is unlikely that multiple craters impact the exact location on the planet. For this reason, I will focus on 2 particular locations, those close to the planets poles and those near the equator. I have created a new variable that identifies whether the crater is: a. Near the North Pole b. Near the South Pole c. Near the Equator
The new value for these corresponds to =1, =-1 and =0. The frequency counts for those show that the majority of the craters and not near the poles. The distribution of values are: 0 322844 -1 39900 1 21599
I have also chosen to divide the planet up into 10 degree latitude positions. This resulted in 18 bins of 10 degree increments ranging from -90 to +90 latitude. The results showed that the majority of the craters occured between -30 and 0 degrees latitude. (-30, -20] 46504 (-20, -10] 46158 (-10, 0] 40921 Near the poles the counts were even less, with the extreme poles showing a small count and percentage: (-90, -80] 631 (80, 90] 44
2.2 Diameters
The diameter of the craters were investigated and put into 4 percentile bins. the bins range is shown in the following output and repeated below. It shows that the crater size for percentils 0-75 range from 1 to 2.5km in diameter, however the 75% percentile range has craters as large as 1164 km. The vast majority of craters according to the output are under 2.5km.
------- Diameter Bins ----------- [1.00000e+00 1.18000e+00 1.53000e+00 2.55000e+00 1.16422e+03]
Crater Diameter - 4 categories - quartiles 1=0%tile 96308 2=25%tile 97609 3=50%tile 94359 4=75%tile 96067
2.3 Depths
Several of the craters had depths of 0 km. The depths of the craters were put into 2 bins that ranged from -0.4 km to 0 km and 0 km to 4.95 km. The frequency count is shown below and shows that the vast majority are shallow craters.
Crater Depth - 2 halves - lower and upper bins 1=Lower 307539 2=Upper 76804
2.4 Depth Management
To further classify the depths of the craters a new variable was created for each row and it classified the crater as either being a -1, - or 1. This classification meant: -1 crater depth represents a negative value or peak in the crater 0 crater depth noted as 0km +1 crater is a regular crater depression
The results of the frequency distribution show the following: 0 307529 1 76804 -1 10
This shows that there majority of the craters are marked with a depth of 0km and only 10 of 384343 craters have peaks, making this occurrence rare. There is no sign that the 0s represent missing data, but appear to be just shallow craters.
3.Raw Python Code:
The raw Python code is shown in the photos below. I decided to use screenshots for easier readability as it includes syntax highlighting.
4.Code Output:
Mars Crater Study
Info about this dataset
Total number of rows in the dataset: 384343
Total number of columns in the dataset: 10
----------------------- NEAR POLE OF PLANET SECTION ----------------------------------------- Here is a sample of the first 10 rows CRATER_ID LATITUDE_CIRCLE_IMAGE ... DEPTH_RIMFLOOR_TOPOG IS_NEAR_POLE 0 01-000000 84.367 ... 0.22 1 1 01-000001 72.760 ... 1.97 1 2 01-000002 69.244 ... 0.09 1 3 01-000003 70.107 ... 0.13 1 4 01-000004 77.996 ... 0.11 1 5 01-000005 68.547 ... 0.19 1 6 01-000006 69.492 ... 0.10 1 7 01-000007 78.716 ... 0.05 1 8 01-000008 75.539 ... 0.11 1 9 01-000009 69.371 ... 0.00 1
[10 rows x 6 columns] Here are the counts for craters close to the pole =1 for close to poles 0 322844 -1 39900 1 21599 Name: IS_NEAR_POLE, dtype: int64
----------------------- LATTITUDE BIN SECTION -----------------------------------------
Latitude bin counts: (-90, -80] 631 (-80, -70] 6984 (-70, -60] 13527 (-60, -50] 18758 (-50, -40] 25396 (-40, -30] 34577 (-30, -20] 46504 (-20, -10] 46158 (-10, 0] 40921 (0, 10] 32362 (10, 20] 30411 (20, 30] 28990 (30, 40] 23365 (40, 50] 14160 (50, 60] 10801 (60, 70] 7974 (70, 80] 2780 (80, 90] 44 Name: LATITUDE_CIRCLE_IMAGE_10, dtype: int64
----------------------- CRATER DIAMETER SECTION ----------------------------------------- ------- Diameter Bins ----------- [1.00000e+00 1.18000e+00 1.53000e+00 2.55000e+00 1.16422e+03]
Crater Diameter - 4 categories - quartiles 1=0%tile 96308 2=25%tile 97609 3=50%tile 94359 4=75%tile 96067 Name: DIAM_CIRCLE_4, dtype: int64 -------------------- DIAM_CIRCLE_IMAGE 1.00 1.01 1.02 ... 624.50 1096.65 1164.22 DIAM_CIRCLE_4 ... 1=0%tile 3129 6298 6077 ... 0 0 0 2=25%tile 0 0 0 ... 0 0 0 3=50%tile 0 0 0 ... 0 0 0 4=75%tile 0 0 0 ... 1 1 1
[4 rows x 6240 columns]
----------------------- CRATER DEPTH SECTION ----------------------------------------- ------- Depth Bins ----------- [-0.42 0. 4.95]
Crater Depth - 2 halves - lower and upper bins 1=Lower 307539 2=Upper 76804 Name: DEPTH_RIMFLOOR_TOPOG_4, dtype: int64 -------------------- DEPTH_RIMFLOOR_TOPOG -0.42 -0.03 -0.02 -0.01 ... 4.01 4.72 4.75 4.95 DEPTH_RIMFLOOR_TOPOG_4 ... 1=Lower 1 2 4 3 ... 0 0 0 0 2=Upper 0 0 0 0 ... 1 1 1 1
[2 rows x 296 columns]
----------------------- DEPTH MANAGEMENT SECTION ----------------------------------------- Here is a sample of the first 10 rows CRATER_ID LATITUDE_CIRCLE_IMAGE ... DEPTH_RIMFLOOR_TOPOG_4 HAS_CRATER_DEPTH 0 01-000000 84.367 ... 2=Upper 1 1 01-000001 72.760 ... 2=Upper 1 2 01-000002 69.244 ... 2=Upper 1 3 01-000003 70.107 ... 2=Upper 1 4 01-000004 77.996 ... 2=Upper 1 5 01-000005 68.547 ... 2=Upper 1 6 01-000006 69.492 ... 2=Upper 1 7 01-000007 78.716 ... 2=Upper 1 8 01-000008 75.539 ... 2=Upper 1 9 01-000009 69.371 ... 1=Lower 0
[10 rows x 10 columns] Here are the counts for craters with a depression (+ or - depth)
0 307529 1 76804 -1 10 Name: HAS_CRATER_DEPTH, dtype: int64
0 notes
Text
Week 2 Assignment
Background
I have decided to look at Mars craters and ask the following questions:
1. Is the depth dependant on the diameter of the crater? 2. Are shallower depth craters associated with locations near the North and South poles of Mars?” (close to poles defined as +/- 40 degrees latitude)
My code outputs creates frequency distributions (in count and percentage) for the entire data set first. I output the location of the crater in latitude, the diameter of the crater and the depth of the crater.
I have also created a subset of data that divides the data into datasets close to the equator and those that are close to the poles. This will allow me to compare the two datasets.
Notes about the Results
As can be imaged the distribution varies widely as the location of the craters vary widely across the planet and it is unlikely that multiple craters impact the exact location on the planet. For this reason, the frequency of the crater at the same location is low and is under 1 percent. I have also chosen to sort the distribution so that I can see the most frequent location, diameters and depths.
For craters close to the poles they appear shallow and 78% of these craters have depths of 0 km.
The most frequent diameter of the dataset was 1.01km across and occured in 1.6% of the time. The most impact latitude on the planet was at -23.6 degrees latitude.
There were no gaps in the data used.
Data is organized in the output as follows: -All Raw Data -Subset for craters close to the equator -Subset or craters close to the poles For each of these I output the count and percentage for the latitude, diameter and depth of the crater
Raw Python Code:
#!/usr/bin/env python3 # -*- coding: utf-8 -*- """ ************ MARS CRATER STUDY ************
Created on Wed Jun 17 15:47:15 2020
@author: tj """
#libraries used in this code import pandas import numpy
print("\nMars Crater Study\n")
#load in the mars crater dataset dataMarsCraterRaw = pandas.read_csv('marscrater_pds.csv', low_memory=False)
print("Total number of rows in the dataset:") print(len(dataMarsCraterRaw)) print("\nTotal number of columns in the dataset:") print(len(dataMarsCraterRaw.columns))
""" The data set contains the following columns, For my study I require only the 5 columns that have an * *CRATER_ID CRATER_NAME *LATITUDE_CIRCLE_IMAGE *LONGITUDE_CIRCLE_IMAGE *DIAM_CIRCLE_IMAGE *DEPTH_RIMFLOOR_TOPOG MORPHOLOGY_EJECTA_1 MORPHOLOGY_EJECTA_2 MORPHOLOGY_EJECTA_3 NUMBER_LAYERS """
#ensure data is read is as numeric values and not text dataMarsCraterRaw['LATITUDE_CIRCLE_IMAGE'] = pandas.to_numeric(dataMarsCraterRaw['LATITUDE_CIRCLE_IMAGE']) dataMarsCraterRaw['LONGITUDE_CIRCLE_IMAGE'] = pandas.to_numeric(dataMarsCraterRaw['LONGITUDE_CIRCLE_IMAGE']) dataMarsCraterRaw['DIAM_CIRCLE_IMAGE'] = pandas.to_numeric(dataMarsCraterRaw['DIAM_CIRCLE_IMAGE']) dataMarsCraterRaw['DEPTH_RIMFLOOR_TOPOG'] = pandas.to_numeric(dataMarsCraterRaw['DEPTH_RIMFLOOR_TOPOG'])
print("\n*************** ALL RAW DATA ***************")
# As the data is very unordered and craters are less likely to be in the same spot I have deceided to sort the distribution # so that we can identify the most populous data
print("\n*************** LATITUDE ***************") print("Counts for the Latitude of the craters:") distLatCnt = dataMarsCraterRaw["LATITUDE_CIRCLE_IMAGE"].value_counts(dropna=False,sort=True) print(distLatCnt)
print("\nPercentages for the Latitude of the craters:") distLatPrc = dataMarsCraterRaw["LATITUDE_CIRCLE_IMAGE"].value_counts(dropna=False,sort=True, normalize=True) print(distLatPrc)
""" May want to look at longitude later in the study so this is a placeholder for now. print("\n*************** LONGITUDE ***************") print("Counts for the Longitude of the craters:") distLongCnt = dataMarsCraterRaw["LONGITUDE_CIRCLE_IMAGE"].value_counts(dropna=False,sort=True) print(distLongCnt)
print("Percentages for the Longitude of the craters:") distLongPrc = dataMarsCraterRaw["LONGITUDE_CIRCLE_IMAGE"].value_counts(dropna=False,sort=True, normalize=True) print(distLongPrc) """
print("\n*************** DIAMETER ***************") print("Counts for the Diameter of the craters:") distDiamCnt = dataMarsCraterRaw["DIAM_CIRCLE_IMAGE"].value_counts(dropna=False,sort=True) print(distDiamCnt)
print("\nPercentages for the Diameter of the craters:") distDiamPrc = dataMarsCraterRaw["DIAM_CIRCLE_IMAGE"].value_counts(dropna=False,sort=True, normalize=True) print(distDiamPrc)
print("\n*************** DEPTH ***************") print("Counts for the Depth of the craters:") distDepthCnt = dataMarsCraterRaw["DEPTH_RIMFLOOR_TOPOG"].value_counts(dropna=False,sort=True) print(distDepthCnt)
print("\nPercentages for the Depth of the craters:") distDepthPrc = dataMarsCraterRaw["DEPTH_RIMFLOOR_TOPOG"].value_counts(dropna=False,sort=True, normalize=True) print(distDepthPrc)
# The study will be comparing data close to the equator with those close to the poles # data close to the poles will be define +/- 40 degrees poleward latitude # so lets create subsets of data for the comparison
print("\n*************** SUBSET OF DATA ***************") dataMarsCraterEquator = dataMarsCraterRaw[ (dataMarsCraterRaw['LATITUDE_CIRCLE_IMAGE']>=-50) & (dataMarsCraterRaw['LATITUDE_CIRCLE_IMAGE']<=50) ] print("Total number of rows in the close-to-equator dataset:") print(len(dataMarsCraterEquator)) # create a datasubset for data close to the north and south pole. This is defined as +-40 degrees poleward dataMarsCraterPoles = dataMarsCraterRaw[ (dataMarsCraterRaw['LATITUDE_CIRCLE_IMAGE']<-50) | (dataMarsCraterRaw['LATITUDE_CIRCLE_IMAGE']>50) ] print("Total number of rows in the close-to-poles dataset:") print(len(dataMarsCraterPoles)) # Summation of rows in each of these subsets should equal to the total number of the original raw data table
print("\n*************** CRATERS CLOSE TO THE EQUATOR ***************")
print("\n*************** LATITUDE for EQUATOR SUBSET ***************") print("Counts for the Latitude of the craters near the equator:") distELatCnt = dataMarsCraterEquator["LATITUDE_CIRCLE_IMAGE"].value_counts(dropna=False,sort=True) print(distELatCnt) print("\nPercentages for the Latitude of the craters near the equator:") distELatPrc = dataMarsCraterEquator["LATITUDE_CIRCLE_IMAGE"].value_counts(dropna=False,sort=True, normalize=True) print(distELatPrc)
print("\n*************** DIAMETER for EQUATOR SUBSET ***************") print("Counts for the Diameter of the craters near the equator:") distEDiamCnt = dataMarsCraterEquator["DIAM_CIRCLE_IMAGE"].value_counts(dropna=False,sort=True) print(distEDiamCnt) print("\nPercentages for the Diameter of the craters near the equator:") distEDiamPrc = dataMarsCraterEquator["DIAM_CIRCLE_IMAGE"].value_counts(dropna=False,sort=True, normalize=True) print(distEDiamPrc)
print("\n*************** DEPTH for EQUATOR SUBSET ***************") print("Counts for the Depth of the craters near the equator:") distEDepthCnt = dataMarsCraterEquator["DEPTH_RIMFLOOR_TOPOG"].value_counts(dropna=False,sort=True) print(distEDepthCnt) print("\nPercentages for the Depth of the craters near the equator:") distEDepthPrc = dataMarsCraterEquator["DEPTH_RIMFLOOR_TOPOG"].value_counts(dropna=False,sort=True, normalize=True) print(distEDepthPrc)
print("\n*************** CRATERS CLOSE TO THE POLES ***************")
print("\n*************** LATITUDE for CLOSE-TO-POLES SUBSET ***************") print("Counts for the Latitude of the craters close to the poles:") distPLatCnt = dataMarsCraterPoles["LATITUDE_CIRCLE_IMAGE"].value_counts(dropna=False,sort=True) print(distPLatCnt) print("\nPercentages for the Latitude of the close to the poles:") distPLatPrc = dataMarsCraterPoles["LATITUDE_CIRCLE_IMAGE"].value_counts(dropna=False,sort=True, normalize=True) print(distPLatPrc)
print("\n*************** DIAMETER for CLOSE-TO-POLES SUBSET ***************") print("Counts for the Diameter of the craters close to the poles:") distPDiamCnt = dataMarsCraterPoles["DIAM_CIRCLE_IMAGE"].value_counts(dropna=False,sort=True) print(distPDiamCnt) print("\nPercentages for the Diameter of the craters close to the poles:") distPDiamPrc = dataMarsCraterPoles["DIAM_CIRCLE_IMAGE"].value_counts(dropna=False,sort=True, normalize=True) print(distPDiamPrc)
print("\n*************** DEPTH for CLOSE-TO-POLES SUBSET ***************") print("Counts for the Depth of the craters close to the poles:") distPDepthCnt = dataMarsCraterPoles["DEPTH_RIMFLOOR_TOPOG"].value_counts(dropna=False,sort=True) print(distPDepthCnt) print("\nPercentages for the Depth of the craters close to the poles:") distPDepthPrc = dataMarsCraterPoles["DEPTH_RIMFLOOR_TOPOG"].value_counts(dropna=False,sort=True, normalize=True) print(distPDepthPrc)
Code Output
Mars Crater Study
Total number of rows in the dataset: 384343
Total number of columns in the dataset: 10
*************** ALL RAW DATA ***************
*************** LATITUDE *************** Counts for the Latitude of the craters: -23.634 17 -2.572 16 -12.970 15 -17.317 15 -3.150 15 .. -47.176 1 38.302 1 -49.988 1 56.487 1 -63.516 1 Name: LATITUDE_CIRCLE_IMAGE, Length: 129197, dtype: int64
Percentages for the Latitude of the craters: -23.634 0.000044 -2.572 0.000042 -12.970 0.000039 -17.317 0.000039 -3.150 0.000039
-47.176 0.000003 38.302 0.000003 -49.988 0.000003 56.487 0.000003 -63.516 0.000003 Name: LATITUDE_CIRCLE_IMAGE, Length: 129197, dtype: float64
*************** DIAMETER *************** Counts for the Diameter of the craters: 1.01 6298 1.02 6077 1.03 6035 1.04 5941 1.05 5771
115.47 1 52.90 1 65.18 1 64.82 1 65.79 1 Name: DIAM_CIRCLE_IMAGE, Length: 6240, dtype: int64
Percentages for the Diameter of the craters: 1.01 0.016386 1.02 0.015811 1.03 0.015702 1.04 0.015458 1.05 0.015015
115.47 0.000003 52.90 0.000003 65.18 0.000003 64.82 0.000003 65.79 0.000003 Name: DIAM_CIRCLE_IMAGE, Length: 6240, dtype: float64
*************** DEPTH *************** Counts for the Depth of the craters: 0.00 307529 0.07 2059 0.08 2047 0.09 2008 0.10 1999
4.75 1 2.84 1 4.95 1 2.97 1 3.08 1 Name: DEPTH_RIMFLOOR_TOPOG, Length: 296, dtype: int64
Percentages for the Depth of the craters: 0.00 0.800142 0.07 0.005357 0.08 0.005326 0.09 0.005224 0.10 0.005201
4.75 0.000003 2.84 0.000003 4.95 0.000003 2.97 0.000003 3.08 0.000003 Name: DEPTH_RIMFLOOR_TOPOG, Length: 296, dtype: float64
*************** SUBSET OF DATA *************** Total number of rows in the close-to-equator dataset: 322844 Total number of rows in the close-to-poles dataset: 61499
*************** CRATERS CLOSE TO THE EQUATOR ***************
*************** LATITUDE for EQUATOR SUBSET *************** Counts for the Latitude of the craters near the equator: -23.634 17 -2.572 16 -22.340 15 -12.406 15 -17.317 15 .. 42.240 1 45.063 1 46.044 1 16.290 1 -39.182 1 Name: LATITUDE_CIRCLE_IMAGE, Length: 93466, dtype: int64
Percentages for the Latitude of the craters near the equator: -23.634 0.000053 -2.572 0.000050 -22.340 0.000046 -12.406 0.000046 -17.317 0.000046
42.240 0.000003 45.063 0.000003 46.044 0.000003 16.290 0.000003 -39.182 0.000003 Name: LATITUDE_CIRCLE_IMAGE, Length: 93466, dtype: float64
*************** DIAMETER for EQUATOR SUBSET *************** Counts for the Diameter of the craters near the equator: 1.01 5557 1.02 5384 1.03 5310 1.04 5207 1.05 5107
128.10 1 78.73 1 78.77 1 87.81 1 165.98 1 Name: DIAM_CIRCLE_IMAGE, Length: 5773, dtype: int64
Percentages for the Diameter of the craters near the equator: 1.01 0.017213 1.02 0.016677 1.03 0.016448 1.04 0.016129 1.05 0.015819
128.10 0.000003 78.73 0.000003 78.77 0.000003 87.81 0.000003 165.98 0.000003 Name: DIAM_CIRCLE_IMAGE, Length: 5773, dtype: float64
*************** DEPTH for EQUATOR SUBSET *************** Counts for the Depth of the craters near the equator: 0.00 259380 0.10 1533 0.11 1495 0.09 1492 0.12 1445
4.01 1 2.89 1 4.72 1 2.50 1 3.31 1 Name: DEPTH_RIMFLOOR_TOPOG, Length: 293, dtype: int64
Percentages for the Depth of the craters near the equator: 0.00 0.803422 0.10 0.004748 0.11 0.004631 0.09 0.004621 0.12 0.004476
4.01 0.000003 2.89 0.000003 4.72 0.000003 2.50 0.000003 3.31 0.000003 Name: DEPTH_RIMFLOOR_TOPOG, Length: 293, dtype: float64
*************** CRATERS CLOSE TO THE POLES ***************
*************** LATITUDE for CLOSE-TO-POLES SUBSET *************** Counts for the Latitude of the craters close to the poles: -58.016 8 -52.885 8 -54.023 8 -57.865 8 -58.413 8 .. 73.158 1 -63.830 1 -52.418 1 -73.587 1 72.000 1 Name: LATITUDE_CIRCLE_IMAGE, Length: 35731, dtype: int64
Percentages for the Latitude of the close to the poles: -58.016 0.000130 -52.885 0.000130 -54.023 0.000130 -57.865 0.000130 -58.413 0.000130
73.158 0.000016 -63.830 0.000016 -52.418 0.000016 -73.587 0.000016 72.000 0.000016 Name: LATITUDE_CIRCLE_IMAGE, Length: 35731, dtype: float64
*************** DIAMETER for CLOSE-TO-POLES SUBSET *************** Counts for the Diameter of the craters close to the poles: 1.01 741 1.04 734 1.03 725 1.02 693 1.06 680
63.02 1 100.24 1 28.56 1 36.48 1 23.81 1 Name: DIAM_CIRCLE_IMAGE, Length: 3467, dtype: int64
Percentages for the Diameter of the craters close to the poles: 1.01 0.012049 1.04 0.011935 1.03 0.011789 1.02 0.011268 1.06 0.011057
63.02 0.000016 100.24 0.000016 28.56 0.000016 36.48 0.000016 23.81 0.000016 Name: DIAM_CIRCLE_IMAGE, Length: 3467, dtype: float64
*************** DEPTH for CLOSE-TO-POLES SUBSET *************** Counts for the Depth of the craters close to the poles: 0.00 48149 0.04 706 0.05 696 0.03 666 0.07 658
2.32 1 2.50 1 2.20 1 2.25 1 2.40 1 Name: DEPTH_RIMFLOOR_TOPOG, Length: 231, dtype: int64
Percentages for the Depth of the craters close to the poles: 0.00 0.782923 0.04 0.011480 0.05 0.011317 0.03 0.010829 0.07 0.010699
2.32 0.000016 2.50 0.000016 2.20 0.000016 2.25 0.000016 2.40 0.000016 Name: DEPTH_RIMFLOOR_TOPOG, Length: 231, dtype: float64
0 notes
Text
Assignment 1: Develop Research Question and Personal Codebook
DATASET:
I have chosen the Mars Craters Study data set as it most accurately represents my field in the Physical Science and Engineering area of study. I am interested in examining the craters on Mars and their relationship to further the science in this area.
The Mars Craters Study, presents a global database that includes over 300,000 Mars craters 1 km or larger that were created between 4.2 and 3.8 billion years ago during a period of heavy bombardment
RESEARCH QUESTIONS:
I would like to study the relationship between the crater diameter and the depth of the craters on Mars. The primary questions to be proposed is: 1. “Does the crater diameter have a relationship with the depth of the crater? Is the depth dependant on the diameter of the crater?”
For this primary question it will be important to note and compare the diameter of the crater and the crater depth.
In addition to the primary questions I will also be looking at the location of the craters and would like to investigate and research the following questions: 2. “Are shallower depth craters associated with locations near the poles of Mars?”
For this secondary question it will be important to look at the location of the craters and in particular the latitude. I will consider locations close to the poles as poleward +/- 40 degrees latitude.
PERSONALIZED CODEBOOK:
A subset of the variables used in the provide dataset will be used for the study. Not all variables are required for my study, a unique identifier is used along with the diameter and depth and location. The applicable Mars Crater variables names used in my study are:
CRATER_ID LATITUDE_CIRCLE_IMAGE LONGITUDE_CIRCLE_IMAGE DIAM_CIRCLE_IMAGE DEPTH_RIMFLOOR_TOPOG
The description of each of the applicable variables are:
• CRATER_ID – crater ID for internal sue, based upon the region of the planet (1/16ths), the “pass” under which the crate was identified, ad the order in which it was identified
• LATITUDE_CIRCLE_IMAGE – latitude from the derived center of a non-linear least-squares circle fit to the vertices selected to manually identify the crater rim (units are decimal degrees North)
• LONGITUDE_CIRCLE_IMAGE – longitude from the derived center of a non-linear least-squares circle fit to the vertices selected to manually identify the crater rim (units are decimal degrees East)
• DIAM_CIRCLE_IMAGE – diameter from a non-linear least squares circle fit to the vertices selected to manually identify the crater rim (units are km)
• DEPTH_RIMFLOOR_TOPOG – average elevation of each of the manually determined N points along (or inside) the crater rim(units are km) where: Depth Rim - Points are selected as relative topographic highs under the assumption they are the least eroded so most original points along the rim Depth Floor – Points were chosen as the lowest elevation that did not include visible embedded craters
HYPOTHESIS:
It is hypothesized that a direct correlation does exist between the depth of the crater and the crater diameter of craters caused by asteroid bombardment.
It is also hypothesized that the depths of the craters near the poles of the planet are much shallower than those found near the equator.
The hypotheses are based on a literature review which is discussed below.
LITERATURE REVIEW:
A literature review was conducted on Mars cratering with an investigation on the crater, depth, diameter and locations. The following keywords were used in a literature research on Google Scholar: Mars, Mars craters, Mars crater depth, Mars crater depth diameter relationship, Mars crater depth poles, craters poles vs equator
Craters appear throughout the terrain of Mars and are the result of a period of heavy bombardment from asteroids, protoplanets and comets. The craters that appear on Mars are vital in understanding its surface material properties and provide insight into its climate and history and impact physics.
In the simplest form a crater can be assumed to be in a circular shape and be characterized via its depth and diameter. The craters depth to diameter ratio is a fundamental property of craters but was not directly measurable until the last two decades. More recently the ability to measure craters has been enhanced based on the instruments of the Mars Orbiter. There have been several relationships and correlations made between crater depth and diameter, however several of these are based on older data and the most recent dataset can provide the opportunity to compare and contrast new relationships based on new data with historical relationships. Depending on the complexity of the crater different relationships between depth and diameter can be observed.
Recent studies have shown that the craters formed near the poles of the planet can be up to 3 times shallower than their counterparts closer to the equator.
The use of new datasets has allowed for the reexamination of past large craters and also allows for smaller (>1km) craters to be analyzed.
REFERENCES:
Barlow, N.G., 1993. Depth-diameter ratios for Martian impact craters: Implications for target properties and episodes of degradation. In its Mars: Past, Present, and Future. Results from the MSATT Program, Part 1 p 1 (SEE N94-33190 09-91)
Barlow, N. G. (1988). Crater size-frequency distributions and a revised Martian relative chronology. Icarus, 75(2), 285-305.
Barlow, N.G. and Bradley, T.L., 1990. Martian impact craters: Correlations of ejecta and interior morphologies with diameter, latitude, and terrain. Icarus, 87(1), pp.156-179.
Boyce, J.M., Mouginis‐Mark, P. and Garbeil, H., 2005. Ancient oceans in the northern lowlands of Mars: Evidence from impact crater depth/diameter relationships. Journal of Geophysical Research: Planets, 110(E3).
Cintala, M.J., Head, J.W. and Mutch, T.A., 1976, April. Martian crater depth/diameter relationships-Comparison with the moon and Mercury. In Lunar and Planetary Science Conference Proceedings (Vol. 7, pp. 3575-3587).
Hartmann, W.K., 1966. Martian cratering. Icarus, 5(1-6), pp.565-576.
Malin, M.C. and Dzurisin, D., 1977. Landform degradation on Mercury, the Moon, and Mars: Evidence from crater depth/diameter relationships. Journal of Geophysical Research, 82(2), pp.376-388.
Robbins, Stuart. 2011. Planetary Surface Properties, Cratering Physics, and the Volcanic History of Mars from a New Global Martian Crater Database.
Robbins, S. J., and Hynek, B. M. ( 2012), A new global database of Mars impact craters ≥1 km: 2. Global crater properties and regional variations of the simple‐to‐complex transition diameter, J. Geophys. Res., 117, E06001, doi:10.1029/2011JE003967.
Stewart, S.T., Valiant, G.J., 2006. Martian subsurface properties and crater formation processes inferred from fresh impact crater geometries. Meteor. & Planet. Sci. 41, 10, pp. 1509- 1537.
Stepinski, T.F., Mendenhall, M.P. and Bue, B.D., 2009. Machine cataloging of impact craters on Mars. icarus, 203(1), pp.77-87.
1 note
·
View note