#Core–Shell Nanoparticles
Explore tagged Tumblr posts
Visit Tumblr Blog
Explore Tumblr blogs with no restrictions, modern design and the best experience.
Last Seen Tumblr Blogs


Fun Fact
Women make up for the other 50% of Tumblr’s audience.
Text
What Are Core–Shell Nanoparticles? Uses, Benefits & Why They’re Transforming Modern Materials
1. Welcome to the Core–Shell Revolution
Imagine materials so small they're invisible to the naked eye—yet powerful enough to revolutionize everything from clean energy to medical diagnostics. These are core–shell nanoparticles, and they’re quietly powering the next wave of innovation across industries.
At Nanochemazone, we work with a wide range of advanced nanomaterials like PTFE Suspension Resin Powder, Graphene Oxide Powder, and Calcium Carbonate (CaCO₃) Nanoparticles—all of which play a role in composite and hybrid structures like core–shells. In this post, we’ll unpack what core–shell nanoparticles are, how they’re made, where they’re used, and why they’re becoming essential to everything from electronics to biotech.
2. What Are Core–Shell Nanoparticles?
At their core (literally), these nanoparticles are a two-part system: a central core made of one material (metal, ceramic, or polymer), surrounded by a protective or functional shell made of another.
This core–shell structure provides several advantages compared to traditional single-material nanoparticles, including enhanced stability, improved functionality, and the ability to fine-tune surface properties for targeted applications. The shell can enhance properties such as stability, functionality, or reactivity—without changing the identity of the core.
At Nanochemazone, we offer several high-purity, lab-ready core–shell combinations including:
Gold–Palladium (Au/Pd) – for catalysis and biomedical uses
Aluminium/Silica (Al/SiO₂) – for thermal insulation and composite materials
Lanthanum Fluoride doped with Europium (LaF₃/Eu) – for medical imaging and fluorescence applications
3. How Are They Made?
Though they may sound complex, core–shell nanoparticles are synthesized through well-established processes such as:
Sol–gel techniques
Microemulsion synthesis
Chemical precipitation
Each method allows control over particle size, composition, and core-to-shell ratio. For example, with products like Graphene Nanoplatelets Powder or PTFE Suspension Resin Powder, we can fine-tune the shell thickness or disperse them in resins or solvents for enhanced compatibility.
4. Real-World Uses & Applications
4.1 Catalysis & Chemical Industry
Core–shell nanoparticles like Gold–Palladium (Au/Pd) and Gold–Platinum are prized for their high catalytic activity. They’re widely used in:
Catalytic converters
Green hydrogen production
Organic synthesis
Powders such as Calcium Oxide Nanoparticles and Barium Sulfate Nanoparticles are also used in tandem with core–shell structures to enhance catalytic surface area and reusability.
4.2 Electronics & Conductive Inks
In modern electronics, core–shells enable better conductivity, durability, and miniaturization. CdSe/ZnS core–shells are widely utilized in quantum dots and sensor technologies.
Materials like Graphene Powder (Industrial Grade), Reduced Graphene Oxide Powder, Polyetheretherketone (PEEK), and Polyamide 66 (PA66) are frequently embedded in circuits, inks, or casings to boost strength and conductivity.
4.3 Medicine, Biotech & Imaging
Thanks to their biocompatibility and controlled surface properties, core–shells such as Au/Pd and LaF₃/Eu are increasingly used in:
Bioimaging and diagnostics
Drug delivery systems
Photodynamic therapy
Other materials like Cellulose Nanofiber Powder and Calcium Carbonate Nanoparticles are used to develop bioresorbable carriers or as drug-loading matrices.
4.4 Coatings, Composites & Advanced Materials
For engineers, PTFE Suspension Resin Powder and Carbon Fiber Powder are go-to choices for high-performance coatings and composites.
Core–shells incorporated into polymers like PVC, PET, POM, and PS—along with fillers like CaCO₃ or BaSO₄—create materials with superior strength, thermal resistance, and surface finish.
5. Top Benefits of Core–Shell Structures
✅ Tunable Properties – Adjust thermal, optical, and catalytic behavior without changing the core material ✅ Improved Stability – Shells protect against oxidation, moisture, and chemical degradation ✅ Cost Efficiency – Use expensive materials (e.g., palladium) only on the shell, reducing overall material cost ✅ Hybrid Functionality – Combine magnetic + fluorescent or conductive + barrier features in one particle
6. Emerging Trends & Future Potentials
The future of core–shell nanotechnology lies in multifunctional hybrid structures:
Nanowires, MXenes, and graphdiyne are rapidly emerging as promising materials in electronics and energy storage.
Researchers are exploring ZnO–TiO₂ and ZnO–MgO core–shells for dye-sensitized solar cells.
Sustainability is driving demand for green nanomaterials, including biodegradable or plant-based nanoparticle systems.
7. Nanochemazone’s Edge: Why Partner With Us
At Nanochemazone, we offer:
ISO and GMP-certified nanomaterials for industrial and research-grade use
A wide selection of powders and dispersions: PTFE, Graphene Oxide, CaCO₃, BaSO₄, CaO, Cellulose Nanofiber
Global shipping, 24/7 support, and custom synthesis services
Every product is customizable by purity, particle size, solvent type, and more—so you always get exactly what you need.
8. Practical Tips: Choosing the Right Core–Shell
🧪 Match by function:
Catalysis → Au/Pd
Imaging → LaF₃/Eu
Electronics → CdSe/ZnS
📏 Choose the right size: Most core–shell particles are 50–100 nm, but we can scale up/down to your requirements.
🧴 Decide on the form: Choose between dry powder or liquid dispersion depending on your process.
9. FAQ Section
Q: What’s the difference between PTFE Suspension Resin Powder and Graphene Oxide Powder? A: PTFE offers non-stick, thermal resistance ideal for coatings. Graphene Oxide brings conductivity and flexibility, great for electronics or inks.
Q: How do I store core–shell nanoparticles safely? A: Store in airtight containers at room temperature, away from light and moisture. Store dispersions in the refrigerator and shake well before use.
Q: Are core–shells scalable for mass production? A: Absolutely. Our synthesis processes are scalable from grams to kilos while maintaining particle integrity.
Q: Can they be used with polymers like PET, PA66, or PEEK? A: Yes—core–shells are often blended into thermoplastics for high-strength, functional composites.
10. Conclusion
Core–shell nanoparticles aren’t just lab curiosities—they’re real-world game changers. Whether you're creating next-gen electronics, developing smart drug delivery systems, or formulating high-performance coatings, these engineered nanomaterials are unlocking new frontiers.
👉 Explore Nanochemazone’s full catalog today, or contact us for a custom quote tailored to your formulation needs. We’re here to help you innovate—one nanoparticle at a time.
#Core–Shell Nanoparticles#Nanoparticle Applications#Advanced Nanomaterials#Nanomaterial Powder Suppliers#Core–Shell Nanoparticle Uses#Graphene Oxide Nanoparticles#PTFE Suspension Resin Powder#Calcium Carbonate Nanoparticles#Bulk nanomaterials delivery#Nanoparticles Supplier#High Purity Nanopowders#Metal Oxide Nanopowders#Laboratory Grade Nanomaterials#Custom Nanomaterial Synthesis#Carbon Nanotubes Bulk#Graphene Nanoplatelets#Buy MXene Online
1 note
·
View note
Text

Researchers reveal ways to fine-tune nanoparticles and outline future areas of study
The demand for renewable energy sources is constantly growing fueling the development of catalytic-based technologies. By separating and forming chemical bonds, these technologies can be used to produce environmentally friendly energy. In recent decades, researchers have been actively studying how core-shell nanoparticles can improve the performance of catalytic systems, which mainly use metal catalysts that accelerate chemical reactions. Researchers from Skoltech analyzed the latest achievements in synthesizing core-shell particles, research methods, techniques for adjusting their properties, and also identified the most promising areas for future research. A large review has been published in Nanoscale.
Read more.
8 notes
·
View notes
Text
Minior Life Cycle
This Pokémon is born in the ozone layer. It falls to the ground once the outer shell enclosing its core grows heavy.
The average weight is 88.2 lbs
https://m.bulbapedia.bulbagarden.net/wiki/File:Pok%C3%A9mon_HOME_Wallpaper_Minior.png
minior's seven colored cores in a wallpaper for Pokémon HOME
Minior is a spherical Pokémon with two forms: one form with a rocky outer coating and the other with its core exposed. When it sheds its rocky coating, its exposed core form is both the lightest Rock-type and Flying-type Pokémon. Both of its forms tie with Carbink and Dwebble as the shortest Rock-type.
In its Meteor Form, Minior resembles a modestly sized rock. Its rocky exterior is formed by four large plates separated by two large cracks. The cracks encircle its body both horizontally and vertically. Five white spikes extend just above the rocky surface, giving it a star shape. Two large, black spots on its front resemble eyes, and there is a third spot in the center of its back. Rings of dark brown triangles surround the holes its spikes protrude from and the spot on its back, pointing outward. One of the triangles surrounding the spot on its back is replaced with a small, brown dot. The eyespots have a half-ring of triangles resembling eyelashes. One eye has a small, brown dot in the corner. Even while apparently at rest, Minior tends to spin slowly in place.
When its core is exposed, Minior loses its rocky shell. The core is a bright, pastel color. Depending on the color of debris and food it absorbed and ate while in the stratosphere, Minior's core can be Red, Orange, Yellow, Green, Blue, Indigo, or Violet. A handful of darker triangles are also visible on its body in random places. Minior's eyes and mouth are formed from energy that floats in front of its body like a two-dimensional mask. The eyes are two large swirls and the mouth is a smaller line. Its face tends to stay level regardless of how Minior spins the rest of its body. The colors of Minior's forms are determined by the composition of the dust it consumes.
Minior forms in the stratosphere from an aggregation of mutated nanoparticles, where it absorbs particulate matter from which it builds its core and shell. When touched in Meteor Form, Minior will react when touched or called to, it is unknown if these responses indicate its consciousness. Eventually, this process makes it too heavy and it falls towards the surface of the planet. When its shell breaks from landing, Minior becomes lighter and capable of attacking quickly. However, it cannot survive for long with its core exposed, and will eventually die if not placed inside a Poké Ball quickly enough. Despite this, many fallen Miniors will attempt to return to space, sadly being unable to return to space. Despite their wish to return home, all they can do is fade away without their shells.
While in the ozone layer, it serves as food to stronger Pokémon such as Rayquaza. Minior's diet consists of eating dust. Places where Minior falls are few, Alola being one of them.
Now most if ALL of that was from Bulbpidea
Let's think about reasons the species can survive
Now the atmosphere is let's just say...large and there's not a lot there in real life except a bunch of gas, matter, microbiology, fugle spores, and a lot more small stuff
But in the world of Pokemon, there's of course a LOT more from large Pokemon like Rayquaza or anything other Pokemon that can fly up to/live in the atmosphere
Here's an ideal
They either live because the Pokemon world still has a VERY large atmosphere and stuff happening is few and far between OR Minior mate a lot more than we think
Think about it
Where can they be found?
The upper atmosphere and the surface!
Either they mate in the upper atmosphere, OR they mate on the surface now.....why would they, you know, DIE on the surface, so why mate there?
Well think about it
Minior die without a shell fast but we don't always find them like that
Most Minior we find have shells so either Minior has a way of making shells when on the surface fast or the more likely option is it doesn't break
Minior has 2 options: either eat so much the shell gets so strong and heavy they induce planet fall, or they run from predators, and they may go too low, and gravity is like, "Gotcha!" And they fall
When we see Minior they still have the shell so my guess is this
It's more likely for the shell to NOT brake when Minior eats enough to the point the Shell is STRONG enough that fall (and most likely) will survive planet fall where getting chased is either an accident or a last-ditch effort to get something off its tail
Places like Aloha might be breeding grounds where Miniors eat above or eat going to Aloha, where they will gain weight and fall, having an easier time finding a mate on the ground than in the air. Then they will quickly mate and either eventually be able to go back to space or die on the ground from predation and or eventually shell damage from weather (or just starvation) while the eggs that are most likely as light or lighter in a non-daycare environment enough to float back up into the upper atmosphere
Thank you for coming to my Minior Ted talk
2 notes
·
View notes
Text
if i wasn’t Girlblogging as much yesterday it was because i was preoccupied with the chaotic state of our senior design program, another undergraduate who HAD to use the centrifuge mass balancing scale to measure out a shit ton of NaOH and prevented me from cleaning my first silica shell coated nanoparticles of the year to the point where the reaction pushed too far and the ammonium etched the core, and then having to deal with a polyacrylic acid modification reaction that wouldn’t give me a stable pH reading until i LITERALLY started praying for the reading to stabilize so i could neutralize it with 0.1 M NaOH.
#i feel like i don’t Girlblog as much about my research as i do about orchestra but. i do both.#iskul bukol
5 notes
·
View notes
Text
Ship Tank Cleaning
Ship Tank Cleaning
MASTER GUIDE: CRUDE OIL STORAGE TANK CLEANING – THE DEFINITIVE RESOURCE
I. Advanced Sludge Characterization
1.1 Petrochemical Analysis
SARA Fractions (Saturates/Aromatics/Resins/Asphaltenes):
Typical Distribution in Sludge:
math
\text{Asphaltenes} = 15-25\%,\ \text{Resins} = 20-35\%
Rheological Properties:
Yield Stress: 50-200 Pa (measured with viscometers)
Thixotropy Index: 1.5-3.0
1.2 Microstructural Imaging
SEM-EDS Analysis:
Fig. 1: SEM micrograph showing asphaltene aggregates (10μm scale)
Table: EDS elemental composition (weight %)
Element Fresh Crude Aged Sludge
Carbon 82-85% 76-78%
Sulfur 1-2% 3-5%
Vanadium <50 ppm 300-500 ppm
II. Cutting-Edge Cleaning Technologies
2.1 High-Definition Hydroblasting
3D Nozzle Trajectory Optimization:
CFD-modeled spray patterns (Fig. 2)
Optimal parameters:
Pressure: 280-350 bar
Nozzle angle: 15-25°
Coverage rate: 8-12 m²/min
2.2 Plasma Arc Cleaning
Technical Specifications:
Power: 40-60 kW DC
Temperature: 8,000-12,000°C (localized)
Effectiveness: 99.9% hydrocarbon removal
2.3 Nanoremediation
Magnetic Nanoparticles:
Fe₃O₄ core with oleophilic coating
Recovery rate: 92% at 0.5 g/L concentration
III. Operational Excellence Framework
3.1 Decision Matrix for Method Selection
Ship Tank Cleaning
Criteria Weight Robotic Chemical Thermal
Safety 30% 9 6 7
Cost Efficiency 25% 7 8 5
Environmental 20% 8 5 6
Speed 15% 9 7 8
Flexibility 10% 6 9 5
*Scoring: 1-10 (10=best)*
3.2 Gantt Chart for Turnaround
Diagram
Code
IV. HSE Protocols Redefined
4.1 Quantified Risk Assessment (QRA)
Fault Tree Analysis:
Probability of H₂S exposure:
math
P_{total} = P_1 \times P_2 = 0.2 \times 0.05 = 0.01 (1\%)
Where:
P₁ = Probability of gas detection failure
P₂ = Probability of PPE breach
4.2 Emergency Response Drills
Scenario Training Modules
Confined space rescue (5-minute response)
Foam suppression system activation
Medical evacuation procedures
V. Economic Modeling
5.1 Total Cost of Ownership (TCO)
math
TCO = C_{capex} + \sum_{n=1}^{5} \frac{C_{opex}}{(1+r)^n} + C_{downtime}
Case Example:
Robotic system: $2.1M over 5 years (15% IRR)
Manual cleaning: $3.4M over 5 years (9% IRR)
5.2 Carbon Credit Potential
CO₂ Equivalent Savings:
Automated vs manual: 120 tons CO₂e per cleaning
Monetization: $6,000 at $50/ton (EU ETS price)
VI. Digital Transformation
6.1 AI-Powered Predictive Cleaning
Machine Learning Model:
Input parameters:
Crude TAN (Total Acid Number)
BS&W history
Temperature fluctuations
Output: Optimal cleaning interval (accuracy: ±3 days)
6.2 Blockchain Documentation
Smart Contract Features:
Automated regulatory reporting
Waste tracking with RFID tags
Immutable safety inspection logs
VII. Global Regulatory Atlas
7.1 Comparative Matrix
Requirement USA (OSHA) EU (ATEX) UAE (ADNOC)
Entry permits 1910.146 137-2013 COP 48.01
H₂S monitoring 10 ppm TWA 5 ppm STEL 2 ppm alarm
Waste classification D001 HP7 Class 2.1
VIII. Expert Interviews
8.1 Q&A with Shell's Tank Integrity Manager
Key Insight:
*"Our new laser ablation system reduced cleaning downtime by 40%, but the real breakthrough was integrating real-time viscosity sensors with our ERP system."*
8.2 MIT Energy Initiative Findings
Research Paper:
*"Nanoparticle-enhanced solvents demonstrated 30% higher recovery rates in heavy crude applications (Journal of Petroleum Tech, 2023)."*
IX. Implementation Toolkit
9.1 Field Operations Manual
Checklist Templates:
Pre-entry verification (30-point list)
Waste manifest (API 13.1 compliant)
PPE inspection log
9.2 Calculation Worksheets
Sludge Volume Estimator:
math
V_{sludge} = \pi r^2 \times h_{avg} \times \rho_{compact}
Ventilation Calculator:
math
Q = \frac{V \times ACH}{60}
X. Future Outlook (2025-2030)
Autonomous Cleaning Drones (Under development by Aramco)
Supercritical CO₂ Extraction (Pilot phase in Norway)
Self-Healing Tank Linings (Graphene nanocomposite trials)
0 notes
Text
Ship Tank Cleaning
Ship Tank Cleaning
MASTER GUIDE: CRUDE OIL STORAGE TANK CLEANING – THE DEFINITIVE RESOURCE
I. Advanced Sludge Characterization
1.1 Petrochemical Analysis
SARA Fractions (Saturates/Aromatics/Resins/Asphaltenes):
Typical Distribution in Sludge:
math
\text{Asphaltenes} = 15-25\%,\ \text{Resins} = 20-35\%
Rheological Properties:
Yield Stress: 50-200 Pa (measured with viscometers)
Thixotropy Index: 1.5-3.0
1.2 Microstructural Imaging
SEM-EDS Analysis:
Fig. 1: SEM micrograph showing asphaltene aggregates (10μm scale)
Table: EDS elemental composition (weight %)
Element Fresh Crude Aged Sludge
Carbon 82-85% 76-78%
Sulfur 1-2% 3-5%
Vanadium <50 ppm 300-500 ppm
II. Cutting-Edge Cleaning Technologies
2.1 High-Definition Hydroblasting
3D Nozzle Trajectory Optimization:
CFD-modeled spray patterns (Fig. 2)
Optimal parameters:
Pressure: 280-350 bar
Nozzle angle: 15-25°
Coverage rate: 8-12 m²/min
2.2 Plasma Arc Cleaning
Technical Specifications:
Power: 40-60 kW DC
Temperature: 8,000-12,000°C (localized)
Effectiveness: 99.9% hydrocarbon removal
2.3 Nanoremediation
Magnetic Nanoparticles:
Fe₃O₄ core with oleophilic coating
Recovery rate: 92% at 0.5 g/L concentration
III. Operational Excellence Framework
3.1 Decision Matrix for Method Selection
Ship Tank Cleaning
Criteria Weight Robotic Chemical Thermal
Safety 30% 9 6 7
Cost Efficiency 25% 7 8 5
Environmental 20% 8 5 6
Speed 15% 9 7 8
Flexibility 10% 6 9 5
*Scoring: 1-10 (10=best)*
3.2 Gantt Chart for Turnaround
Diagram
Code
IV. HSE Protocols Redefined
4.1 Quantified Risk Assessment (QRA)
Fault Tree Analysis:
Probability of H₂S exposure:
math
P_{total} = P_1 \times P_2 = 0.2 \times 0.05 = 0.01 (1\%)
Where:
P₁ = Probability of gas detection failure
P₂ = Probability of PPE breach
4.2 Emergency Response Drills
Scenario Training Modules
Confined space rescue (5-minute response)
Foam suppression system activation
Medical evacuation procedures
V. Economic Modeling
5.1 Total Cost of Ownership (TCO)
math
TCO = C_{capex} + \sum_{n=1}^{5} \frac{C_{opex}}{(1+r)^n} + C_{downtime}
Case Example:
Robotic system: $2.1M over 5 years (15% IRR)
Manual cleaning: $3.4M over 5 years (9% IRR)
5.2 Carbon Credit Potential
CO₂ Equivalent Savings:
Automated vs manual: 120 tons CO₂e per cleaning
Monetization: $6,000 at $50/ton (EU ETS price)
VI. Digital Transformation
6.1 AI-Powered Predictive Cleaning
Machine Learning Model:
Input parameters:
Crude TAN (Total Acid Number)
BS&W history
Temperature fluctuations
Output: Optimal cleaning interval (accuracy: ±3 days)
6.2 Blockchain Documentation
Smart Contract Features:
Automated regulatory reporting
Waste tracking with RFID tags
Immutable safety inspection logs
VII. Global Regulatory Atlas
7.1 Comparative Matrix
Requirement USA (OSHA) EU (ATEX) UAE (ADNOC)
Entry permits 1910.146 137-2013 COP 48.01
H₂S monitoring 10 ppm TWA 5 ppm STEL 2 ppm alarm
Waste classification D001 HP7 Class 2.1
VIII. Expert Interviews
8.1 Q&A with Shell's Tank Integrity Manager
Key Insight:
*"Our new laser ablation system reduced cleaning downtime by 40%, but the real breakthrough was integrating real-time viscosity sensors with our ERP system."*
8.2 MIT Energy Initiative Findings
Research Paper:
*"Nanoparticle-enhanced solvents demonstrated 30% higher recovery rates in heavy crude applications (Journal of Petroleum Tech, 2023)."*
IX. Implementation Toolkit
9.1 Field Operations Manual
Checklist Templates:
Pre-entry verification (30-point list)
Waste manifest (API 13.1 compliant)
PPE inspection log
9.2 Calculation Worksheets
Sludge Volume Estimator:
math
V_{sludge} = \pi r^2 \times h_{avg} \times \rho_{compact}
Ventilation Calculator:
math
Q = \frac{V \times ACH}{60}
X. Future Outlook (2025-2030)
Autonomous Cleaning Drones (Under development by Aramco)
Supercritical CO₂ Extraction (Pilot phase in Norway)
Self-Healing Tank Linings (Graphene nanocomposite trials)
0 notes
Text
Industry trend|"Nano ink" batch printing wearable sensors

Personalized healthcare can tailor the ratio of nutrients, metabolites and drugs according to the unique needs of individuals. The realization of this process is inseparable from the continuous monitoring of certain biomarkers. Recently, the California Institute of Technology announced on its official website that its research team has successfully developed a new "nano-ink" printing technology that can mass-produce durable wearable sweat sensors. These sensors have the function of real-time tracking of multiple biomarkers such as vitamins, hormones, metabolites and drugs, allowing patients and doctors to continuously observe the dynamic changes at the molecular level.
The nanoparticles generated by this printing technology are named core-shell cubic nanoparticles. Their operating mechanism relies on the recognition ability of the molecularly imprinted polymer shell to specific molecules (such as vitamin C). Once the target molecules exist, they will contact the polymer shell and penetrate into the internal pores, causing the electrical signal to weaken. By monitoring this signal change, the content of the target molecule can be accurately determined. In addition, the team also introduced nickel hexacyanoferrate as a core material to enhance the stability of the sensor in biological fluids and ensure the accuracy of long-term measurements.
It is worth noting that this technology is not limited to the detection of a single biomarker, but can also build sensor arrays by using different types of nanoparticle "ink" to achieve simultaneous measurement of multiple amino acids, metabolites, hormones or drug levels. In the study, the team has successfully printed sensors for vitamin C, tryptophan and creatinine, and has been applied in actual cases.
The advent of this technology provides new possibilities for the realization of personalized drug dosage, especially in the field of cancer treatment. It can remotely monitor the dosage of anti-cancer drugs in the body in real time, opening up new avenues for disease treatment. In addition, the study also explored the feasibility of implanting nanoparticle sensors subcutaneously to accurately monitor drug levels in the body. This breakthrough marks a key step towards more precise and efficient personalized medicine.
This paper is from Ulink Media, Shenzhen, China, the organizer of IOTE EXPO (IoT Expo in China)

0 notes
Text

High-Purity Nanomaterials & Graphene Nanoplatelets Powder Supplier
Nanochemazone is a global leader in advanced nanomaterials, offering high-purity Graphene Nanoplatelets Powder, MXenes, metal oxides, and custom nanoparticles for research and industrial use.
#research chemicals#chemicalindustry#2d materials#science#Core–Shell Nanoparticle Uses#Graphene Oxide Nanoparticles#PTFE Suspension Resin Powder#Calcium Carbonate Nanoparticles#Nanoparticles Supplier#High Purity Nanopowders#Advanced Nanomaterials#Buy MXene Online#Graphene Nanoplatelets#Carbon Nanotubes Bulk#Custom Nanomaterial Synthesis#Laboratory Grade Nanomaterials#Metal Oxide Nanopowders#Nano Additive Manufacturing
0 notes
Text
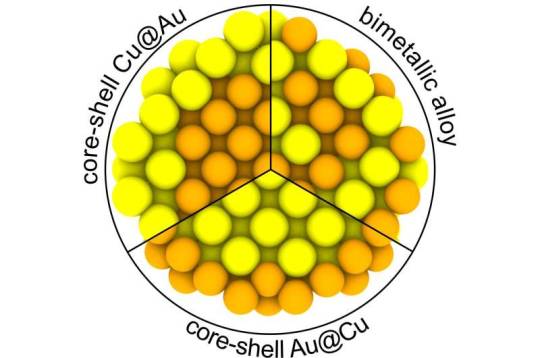
New results to help fine-tune catalytic properties of bimetallic nanoparticles
Nanoparticles range in size from 1 to 100 nanometers, and compared with usual particles, they are known to have unique features that are increasingly used for diagnosing cancer, developing small electronic devices and solar batteries, as well as in many other spheres. In their new paper published in Physical Review B, researchers from Skoltech revealed that catalytic properties of bimetallic nanoparticles—when a material accelerates or delays a chemical reaction without being consumed by the reaction—can be fine-tuned while changing the structure of the nanoparticle. As of now, of greatest interest are bimetallic core-shell particles, in which the core and the shell consist of different metals. Researchers studied three types of nanoparticles: Cu-core/Au-shell, Au-core/Cu-shell, and homogeneous bimetallic AuCu alloy particles. Unlike core-shell particles, the structure of usual bimetallic particles is not ordered.
Read more.
#Materials Science#Science#Nanoparticles#Nanotechnology#Catalysts#Gold#Copper#Skoltech#Core shell structures
12 notes
·
View notes
Text
Tiny magnetic discs offer remote brain stimulation without transgenes
New Post has been published on https://thedigitalinsider.com/tiny-magnetic-discs-offer-remote-brain-stimulation-without-transgenes/
Tiny magnetic discs offer remote brain stimulation without transgenes

Novel magnetic nanodiscs could provide a much less invasive way of stimulating parts of the brain, paving the way for stimulation therapies without implants or genetic modification, MIT researchers report.
The scientists envision that the tiny discs, which are about 250 nanometers across (about 1/500 the width of a human hair), would be injected directly into the desired location in the brain. From there, they could be activated at any time simply by applying a magnetic field outside the body. The new particles could quickly find applications in biomedical research, and eventually, after sufficient testing, might be applied to clinical uses.
The development of these nanoparticles is described in the journal Nature Nanotechnology, in a paper by Polina Anikeeva, a professor in MIT’s departments of Materials Science and Engineering and Brain and Cognitive Sciences, graduate student Ye Ji Kim, and 17 others at MIT and in Germany.
Deep brain stimulation (DBS) is a common clinical procedure that uses electrodes implanted in the target brain regions to treat symptoms of neurological and psychiatric conditions such as Parkinson’s disease and obsessive-compulsive disorder. Despite its efficacy, the surgical difficulty and clinical complications associated with DBS limit the number of cases where such an invasive procedure is warranted. The new nanodiscs could provide a much more benign way of achieving the same results.
Over the past decade other implant-free methods of producing brain stimulation have been developed. However, these approaches were often limited by their spatial resolution or ability to target deep regions. For the past decade, Anikeeva’s Bioelectronics group as well as others in the field used magnetic nanomaterials to transduce remote magnetic signals into brain stimulation. However, these magnetic methods relied on genetic modifications and can’t be used in humans.
Since all nerve cells are sensitive to electrical signals, Kim, a graduate student in Anikeeva’s group, hypothesized that a magnetoelectric nanomaterial that can efficiently convert magnetization into electrical potential could offer a path toward remote magnetic brain stimulation. Creating a nanoscale magnetoelectric material was, however, a formidable challenge.
Kim synthesized novel magnetoelectric nanodiscs and collaborated with Noah Kent, a postdoc in Anikeeva’s lab with a background in physics who is a second author of the study, to understand the properties of these particles.
The structure of the new nanodiscs consists of a two-layer magnetic core and a piezoelectric shell. The magnetic core is magnetostrictive, which means it changes shape when magnetized. This deformation then induces strain in the piezoelectric shell which produces a varying electrical polarization. Through the combination of the two effects, these composite particles can deliver electrical pulses to neurons when exposed to magnetic fields.
One key to the discs’ effectiveness is their disc shape. Previous attempts to use magnetic nanoparticles had used spherical particles, but the magnetoelectric effect was very weak, says Kim. This anisotropy enhances magnetostriction by over a 1000-fold, adds Kent.
The team first added their nanodiscs to cultured neurons, which allowed then to activate these cells on demand with short pulses of magnetic field. This stimulation did not require any genetic modification.
They then injected small droplets of magnetoelectric nanodiscs solution into specific regions of the brains of mice. Then, simply turning on a relatively weak electromagnet nearby triggered the particles to release a tiny jolt of electricity in that brain region. The stimulation could be switched on and off remotely by the switching of the electromagnet. That electrical stimulation “had an impact on neuron activity and on behavior,” Kim says.
The team found that the magnetoelectric nanodiscs could stimulate a deep brain region, the ventral tegmental area, that is associated with feelings of reward.
The team also stimulated another brain area, the subthalamic nucleus, associated with motor control. “This is the region where electrodes typically get implanted to manage Parkinson’s disease,” Kim explains. The researchers were able to successfully demonstrate the modulation of motor control through the particles. Specifically, by injecting nanodiscs only in one hemisphere, the researchers could induce rotations in healthy mice by applying magnetic field.
The nanodiscs could trigger the neuronal activity comparable with conventional implanted electrodes delivering mild electrical stimulation. The authors achieved subsecond temporal precision for neural stimulation with their method yet observed significantly reduced foreign body responses as compared to the electrodes, potentially allowing for even safer deep brain stimulation.
The multilayered chemical composition and physical shape and size of the new multilayered nanodiscs is what made precise stimulation possible.
While the researchers successfully increased the magnetostrictive effect, the second part of the process, converting the magnetic effect into an electrical output, still needs more work, Anikeeva says. While the magnetic response was a thousand times greater, the conversion to an electric impulse was only four times greater than with conventional spherical particles.
“This massive enhancement of a thousand times didn’t completely translate into the magnetoelectric enhancement,” says Kim. “That’s where a lot of the future work will be focused, on making sure that the thousand times amplification in magnetostriction can be converted into a thousand times amplification in the magnetoelectric coupling.”
What the team found, in terms of the way the particles’ shapes affects their magnetostriction, was quite unexpected. “It’s kind of a new thing that just appeared when we tried to figure out why these particles worked so well,” says Kent.
Anikeeva adds: “Yes, it’s a record-breaking particle, but it’s not as record-breaking as it could be.” That remains a topic for further work, but the team has ideas about how to make further progress.
While these nanodiscs could in principle already be applied to basic research using animal models, to translate them to clinical use in humans would require several more steps, including large-scale safety studies, “which is something academic researchers are not necessarily most well-positioned to do,” Anikeeva says. “When we find that these particles are really useful in a particular clinical context, then we imagine that there will be a pathway for them to undergo more rigorous large animal safety studies.”
The team included researchers affiliated with MIT’s departments of Materials Science and Engineering, Electrical Engineering and Computer Science, Chemistry, and Brain and Cognitive Sciences; the Research Laboratory of Electronics; the McGovern Institute for Brain Research; and the Koch Institute for Integrative Cancer Research; and from the Friedrich-Alexander University of Erlangen, Germany. The work was supported, in part, by the National Institutes of Health, the National Center for Complementary and Integrative Health, the National Institute for Neurological Disorders and Stroke, the McGovern Institute for Brain Research, and the K. Lisa Yang and Hock E. Tan Center for Molecular Therapeutics in Neuroscience.
#250#applications#author#background#Behavior#bioelectronics#Brain#Brain and cognitive sciences#brain research#brain stimulation#brains#Cancer#Cells#challenge#chemical#chemistry#Composition#computer#Computer Science#development#devices#Disease#disorders#DMSE#droplets#effects#electrical stimulation#electricity#electrodes#Electronics
0 notes
Text
Ship Tank Cleaning
Ship Tank Cleaning
MASTER GUIDE: CRUDE OIL STORAGE TANK CLEANING – THE DEFINITIVE RESOURCE
I. Advanced Sludge Characterization
1.1 Petrochemical Analysis
SARA Fractions (Saturates/Aromatics/Resins/Asphaltenes):
Typical Distribution in Sludge:
math
\text{Asphaltenes} = 15-25\%,\ \text{Resins} = 20-35\%
Rheological Properties:
Yield Stress: 50-200 Pa (measured with viscometers)
Thixotropy Index: 1.5-3.0
1.2 Microstructural Imaging
SEM-EDS Analysis:
Fig. 1: SEM micrograph showing asphaltene aggregates (10μm scale)
Table: EDS elemental composition (weight %)
Element Fresh Crude Aged Sludge
Carbon 82-85% 76-78%
Sulfur 1-2% 3-5%
Vanadium <50 ppm 300-500 ppm
II. Cutting-Edge Cleaning Technologies
2.1 High-Definition Hydroblasting
3D Nozzle Trajectory Optimization:
CFD-modeled spray patterns (Fig. 2)
Optimal parameters:
Pressure: 280-350 bar
Nozzle angle: 15-25°
Coverage rate: 8-12 m²/min
2.2 Plasma Arc Cleaning
Technical Specifications:
Power: 40-60 kW DC
Temperature: 8,000-12,000°C (localized)
Effectiveness: 99.9% hydrocarbon removal
2.3 Nanoremediation
Magnetic Nanoparticles:
Fe₃O₄ core with oleophilic coating
Recovery rate: 92% at 0.5 g/L concentration
III. Operational Excellence Framework
3.1 Decision Matrix for Method Selection
Ship Tank Cleaning
Criteria Weight Robotic Chemical Thermal
Safety 30% 9 6 7
Cost Efficiency 25% 7 8 5
Environmental 20% 8 5 6
Speed 15% 9 7 8
Flexibility 10% 6 9 5
*Scoring: 1-10 (10=best)*
3.2 Gantt Chart for Turnaround
Diagram
Code
IV. HSE Protocols Redefined
4.1 Quantified Risk Assessment (QRA)
Fault Tree Analysis:
Probability of H₂S exposure:
math
P_{total} = P_1 \times P_2 = 0.2 \times 0.05 = 0.01 (1\%)
Where:
P₁ = Probability of gas detection failure
P₂ = Probability of PPE breach
4.2 Emergency Response Drills
Scenario Training Modules
Confined space rescue (5-minute response)
Foam suppression system activation
Medical evacuation procedures
V. Economic Modeling
5.1 Total Cost of Ownership (TCO)
math
TCO = C_{capex} + \sum_{n=1}^{5} \frac{C_{opex}}{(1+r)^n} + C_{downtime}
Case Example:
Robotic system: $2.1M over 5 years (15% IRR)
Manual cleaning: $3.4M over 5 years (9% IRR)
5.2 Carbon Credit Potential
CO₂ Equivalent Savings:
Automated vs manual: 120 tons CO₂e per cleaning
Monetization: $6,000 at $50/ton (EU ETS price)
VI. Digital Transformation
6.1 AI-Powered Predictive Cleaning
Machine Learning Model:
Input parameters:
Crude TAN (Total Acid Number)
BS&W history
Temperature fluctuations
Output: Optimal cleaning interval (accuracy: ±3 days)
6.2 Blockchain Documentation
Smart Contract Features:
Automated regulatory reporting
Waste tracking with RFID tags
Immutable safety inspection logs
VII. Global Regulatory Atlas
7.1 Comparative Matrix
Requirement USA (OSHA) EU (ATEX) UAE (ADNOC)
Entry permits 1910.146 137-2013 COP 48.01
H₂S monitoring 10 ppm TWA 5 ppm STEL 2 ppm alarm
Waste classification D001 HP7 Class 2.1
VIII. Expert Interviews
8.1 Q&A with Shell's Tank Integrity Manager
Key Insight:
*"Our new laser ablation system reduced cleaning downtime by 40%, but the real breakthrough was integrating real-time viscosity sensors with our ERP system."*
8.2 MIT Energy Initiative Findings
Research Paper:
*"Nanoparticle-enhanced solvents demonstrated 30% higher recovery rates in heavy crude applications (Journal of Petroleum Tech, 2023)."*
IX. Implementation Toolkit
9.1 Field Operations Manual
Checklist Templates:
Pre-entry verification (30-point list)
Waste manifest (API 13.1 compliant)
PPE inspection log
9.2 Calculation Worksheets
Sludge Volume Estimator:
math
V_{sludge} = \pi r^2 \times h_{avg} \times \rho_{compact}
Ventilation Calculator:
math
Q = \frac{V \times ACH}{60}
X. Future Outlook (2025-2030)
Autonomous Cleaning Drones (Under development by Aramco)
Supercritical CO₂ Extraction (Pilot phase in Norway)
Self-Healing Tank Linings (Graphene nanocomposite trials)
0 notes
Text
Ship Tank Cleaning
Ship Tank Cleaning
MASTER GUIDE: CRUDE OIL STORAGE TANK CLEANING – THE DEFINITIVE RESOURCE
I. Advanced Sludge Characterization
1.1 Petrochemical Analysis
SARA Fractions (Saturates/Aromatics/Resins/Asphaltenes):
Typical Distribution in Sludge:
math
\text{Asphaltenes} = 15-25\%,\ \text{Resins} = 20-35\%
Rheological Properties:
Yield Stress: 50-200 Pa (measured with viscometers)
Thixotropy Index: 1.5-3.0
1.2 Microstructural Imaging
SEM-EDS Analysis:
Fig. 1: SEM micrograph showing asphaltene aggregates (10μm scale)
Table: EDS elemental composition (weight %)
Element Fresh Crude Aged Sludge
Carbon 82-85% 76-78%
Sulfur 1-2% 3-5%
Vanadium <50 ppm 300-500 ppm
II. Cutting-Edge Cleaning Technologies
2.1 High-Definition Hydroblasting
3D Nozzle Trajectory Optimization:
CFD-modeled spray patterns (Fig. 2)
Optimal parameters:
Pressure: 280-350 bar
Nozzle angle: 15-25°
Coverage rate: 8-12 m²/min
2.2 Plasma Arc Cleaning
Technical Specifications:
Power: 40-60 kW DC
Temperature: 8,000-12,000°C (localized)
Effectiveness: 99.9% hydrocarbon removal
2.3 Nanoremediation
Magnetic Nanoparticles:
Fe₃O₄ core with oleophilic coating
Recovery rate: 92% at 0.5 g/L concentration
III. Operational Excellence Framework
3.1 Decision Matrix for Method Selection
Ship Tank Cleaning
Criteria Weight Robotic Chemical Thermal
Safety 30% 9 6 7
Cost Efficiency 25% 7 8 5
Environmental 20% 8 5 6
Speed 15% 9 7 8
Flexibility 10% 6 9 5
*Scoring: 1-10 (10=best)*
3.2 Gantt Chart for Turnaround
Diagram
Code
IV. HSE Protocols Redefined
4.1 Quantified Risk Assessment (QRA)
Fault Tree Analysis:
Probability of H₂S exposure:
math
P_{total} = P_1 \times P_2 = 0.2 \times 0.05 = 0.01 (1\%)
Where:
P₁ = Probability of gas detection failure
P₂ = Probability of PPE breach
4.2 Emergency Response Drills
Scenario Training Modules
Confined space rescue (5-minute response)
Foam suppression system activation
Medical evacuation procedures
V. Economic Modeling
5.1 Total Cost of Ownership (TCO)
math
TCO = C_{capex} + \sum_{n=1}^{5} \frac{C_{opex}}{(1+r)^n} + C_{downtime}
Case Example:
Robotic system: $2.1M over 5 years (15% IRR)
Manual cleaning: $3.4M over 5 years (9% IRR)
5.2 Carbon Credit Potential
CO₂ Equivalent Savings:
Automated vs manual: 120 tons CO₂e per cleaning
Monetization: $6,000 at $50/ton (EU ETS price)
VI. Digital Transformation
6.1 AI-Powered Predictive Cleaning
Machine Learning Model:
Input parameters:
Crude TAN (Total Acid Number)
BS&W history
Temperature fluctuations
Output: Optimal cleaning interval (accuracy: ±3 days)
6.2 Blockchain Documentation
Smart Contract Features:
Automated regulatory reporting
Waste tracking with RFID tags
Immutable safety inspection logs
VII. Global Regulatory Atlas
7.1 Comparative Matrix
Requirement USA (OSHA) EU (ATEX) UAE (ADNOC)
Entry permits 1910.146 137-2013 COP 48.01
H₂S monitoring 10 ppm TWA 5 ppm STEL 2 ppm alarm
Waste classification D001 HP7 Class 2.1
VIII. Expert Interviews
8.1 Q&A with Shell's Tank Integrity Manager
Key Insight:
*"Our new laser ablation system reduced cleaning downtime by 40%, but the real breakthrough was integrating real-time viscosity sensors with our ERP system."*
8.2 MIT Energy Initiative Findings
Research Paper:
*"Nanoparticle-enhanced solvents demonstrated 30% higher recovery rates in heavy crude applications (Journal of Petroleum Tech, 2023)."*
IX. Implementation Toolkit
9.1 Field Operations Manual
Checklist Templates:
Pre-entry verification (30-point list)
Waste manifest (API 13.1 compliant)
PPE inspection log
9.2 Calculation Worksheets
Sludge Volume Estimator:
math
V_{sludge} = \pi r^2 \times h_{avg} \times \rho_{compact}
Ventilation Calculator:
math
Q = \frac{V \times ACH}{60}
X. Future Outlook (2025-2030)
Autonomous Cleaning Drones (Under development by Aramco)
Supercritical CO₂ Extraction (Pilot phase in Norway)
Self-Healing Tank Linings (Graphene nanocomposite trials)
0 notes